Fucoidan Market Size 2024-2028
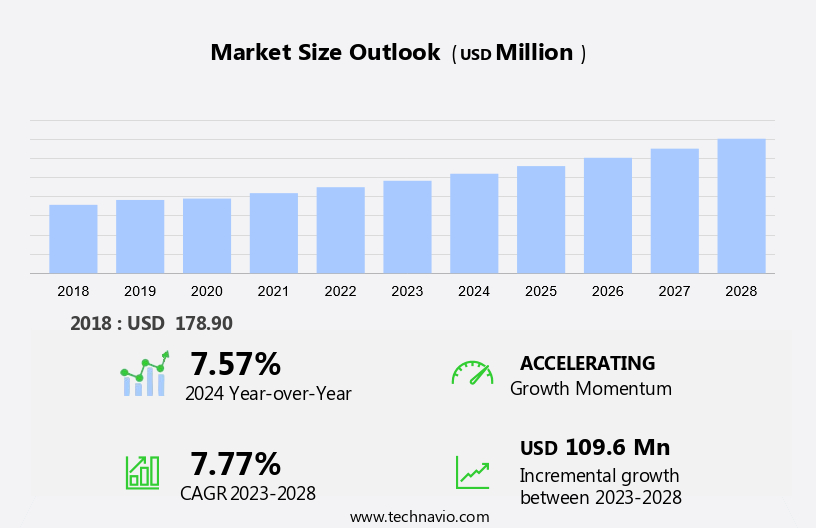
The fucoidan market size is forecast to increase by USD 109.6 million at a CAGR of 7.77% between 2023 and 2028. The market is experiencing significant growth due to increasing consumer health awareness and the expanding application of fucoidan in the pharmaceutical sector. However, ensuring quality control and purity is crucial in this market, as contaminants and heavy metals can pose a challenge. Farmers and manufacturers must adhere to stringent regulations to mitigate these issues. Fucoidan, a naturally occurring complex sulfated polysaccharide, is renowned for its health benefits, including antioxidant, anti-inflammatory, and immune-boosting properties. The inflammation-reducing properties of fucoidan, derived from seaweeds such as Undaria pinnatifida and Fucus vesiculosus, have been the subject of numerous clinical trials. Currency devaluation in certain regions may impact market growth, but the overall demand for fucoidan remains strong. To stay competitive, market players must prioritize quality and purity in their production processes.
What will be the Size of the Market During the Forecast Period?
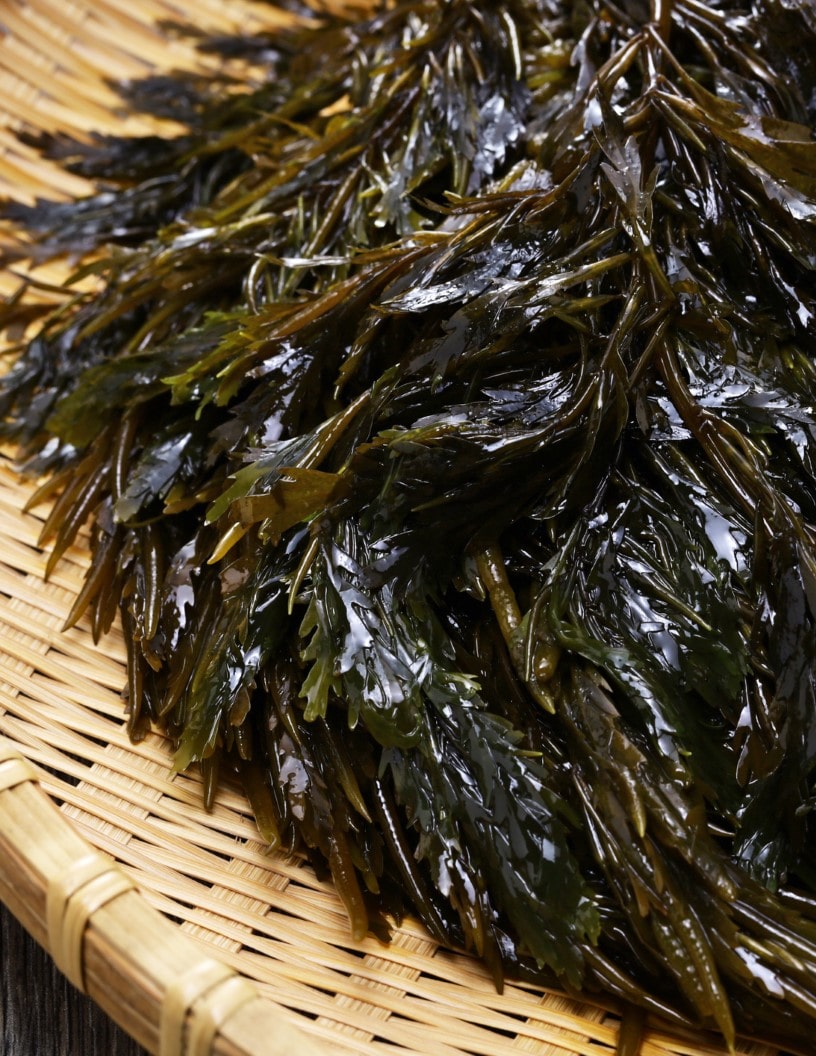
Brown seaweed, a type of marine algae, has gained significant attention in the natural health industry due to its numerous health benefits. This seaweed, also known as Fucoidan, is found in various types of edible seaweed such as Kombu, Wakame, and Mozuku. Fucoidan is rich in bioactive compounds, including antioxidants, which help protect the body from damage caused by free radicals. These antioxidants play a crucial role in maintaining overall health and wellness. Furthermore, Fucoidan exhibits anti-inflammatory properties, making it an ideal ingredient for natural health supplements.
Furthermore, the immune-boosting properties of Fucoidan are another reason for its growing popularity. It is believed to enhance the body's natural immune response, helping to protect against various health issues. Additionally, Fucoidan has been studied for its potential antitumor, anti-angiogenic, antiviral, anticoagulant, and antithrombotic properties. The market for natural health supplements derived from Fucoidan is witnessing steady growth as consumers become increasingly health-conscious. The demand for these supplements is driven by the growing awareness of the health benefits associated with Fucoidan. Fucoidan is not limited to supplements alone. It is also used in various foods and beverages as a functional ingredient.
Also, the market for functional foods and beverages is expanding rapidly, providing ample opportunities for Fucoidan to be incorporated into a wide range of products. Moreover, Fucoidan is also available in various forms such as capsules, powders, and natural health products. These forms offer flexibility to consumers, allowing them to choose the most convenient way to incorporate Fucoidan into their daily health regimen. Beta-glucans, another type of bioactive compound, are also gaining popularity in the natural health industry. While Fucoidan and beta-glucans belong to different categories of natural health ingredients, they share several health benefits. Both are known for their antioxidant properties and immune-boosting capabilities.
In conclusion, the market potential of brown seaweed and its health benefits is significant. The growing demand for natural health supplements and functional foods and beverages presents ample opportunities for Fucoidan to be incorporated into various products. With its numerous health benefits, Fucoidan is poised to make a lasting impact on the natural health industry.
Market Segmentation
The market research report provides comprehensive data (region-wise segment analysis), with forecasts and estimates in "USD million" for the period 2024-2028, as well as historical data from 2018-2022 for the following segments.
- Type
- Powder
- Capsule
- Others
- Application
- Pharmaceutical
- Dietary Supplements
- Cosmetics
- Geography
- APAC
- China
- Japan
- Europe
- Germany
- North America
- US
- South America
- Middle East and Africa
- APAC
By Type Insights
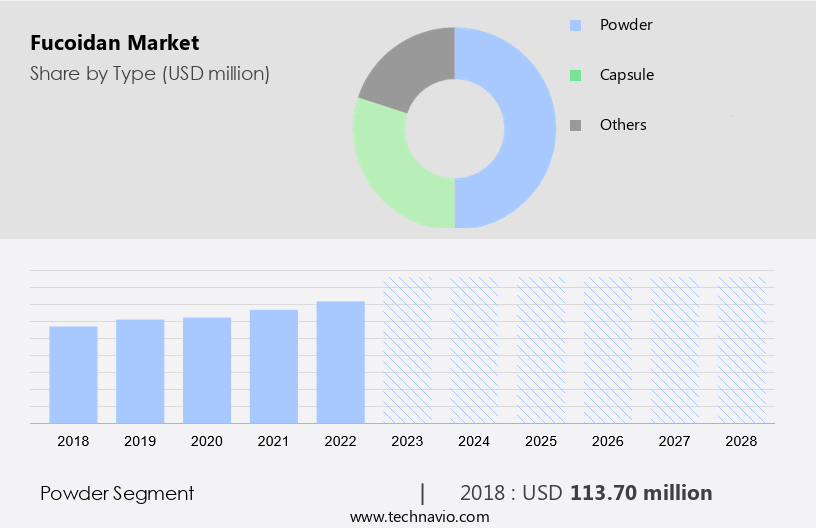
The powder segment is estimated to witness significant growth during the forecast period. Fucoidan is a powder derived from a specific type of oceanic seaweed. This dietary supplement is known for its high fiber content, which promotes satiety, aids in weight control, and improves digestion. Additionally, it is rich in essential vitamins and minerals, including iodine, calcium, magnesium, potassium, sodium, and phosphorus. Fucoidan is available in both capsule and powder form for consumption, as well as in functional foods and beverages. The anti-oxidative, anti-tumor, anti-virus, and anti-coagulation properties of fucoidan make it an effective ingredient in the prevention and management of chronic diseases such as cancer and cardiovascular disease. It also promotes tissue regeneration and reduces inflammation, oxidative stress, and fibrosis in patients with chronic renal failure.
Furthermore, its antibacterial and anti-inflammatory properties boost the immune system and support natural physiological activities. Fucoidan is easily dissolvable in water, resulting in a clear and transparent solution with a light brown hue. The powder form is used in dietary supplements and food products, while the off-white powder is utilized in cosmetics. The versatile benefits of fucoidan continue to attract consumer interests, making it a valuable ingredient in various industries.
Get a glance at the market share of various segments Request Free Sample
The powder segment was valued at USD 113.70 million in 2018 and showed a gradual increase during the forecast period.
Regional Insights
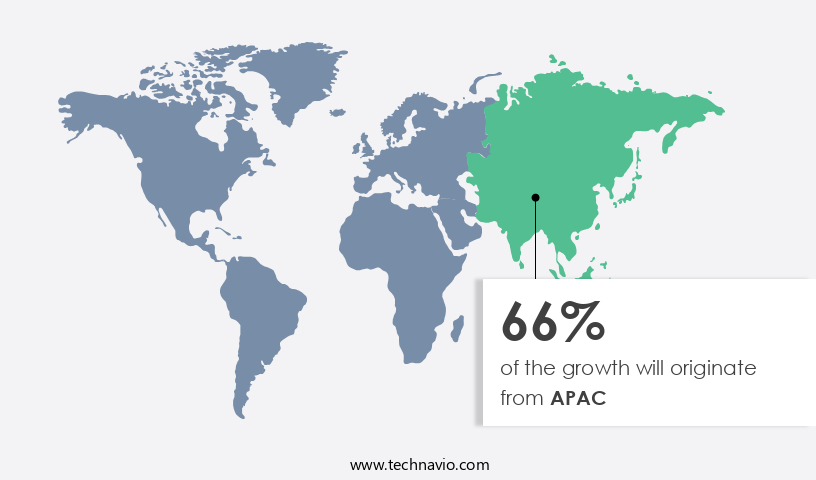
APAC is estimated to contribute 66% to the growth of the global market during the forecast period. Technavio's analysts have elaborately explained the regional trends and drivers that shape the market during the forecast period.
For more insights on the market share of various regions Request Free Sample
The market in Asia Pacific (APAC), driven by countries such as China, Japan, South Korea, and Indonesia, is experiencing steady growth due to escalating health awareness and the increasing utilization of fucoidan in human food and animal feed. Fucoidan, a compound extracted from brown seaweed, is gaining popularity in Asian cuisines, particularly in Chinese, Japanese, and Korean dishes, leading to a growth in demand for this substance. APAC is the primary producer and processor of fucoidan, with China and Japan being the major contributors to global production. In addition, Australia has approved several listed medicines containing fucoidan extracts. Fucoidan is recognized for its antioxidant, antitumor, anti-angiogenic, antiviral, anti-inflammatory, anticoagulant, and antithrombotic properties.
Furthermore, these health benefits have fueled the demand for fucoidan in various industries, including food and beverage, pharmaceuticals, and cosmetics. The market is expected to grow moderately during the forecast period, driven by the increasing adoption of fucoidan in functional foods and dietary supplements. Microalgae, including brown seaweed, are a rich source of fucoidan. The use of microalgae as a sustainable and eco-friendly alternative to traditional sources of fucoidan is gaining traction, further boosting the market growth. The increasing investment in research and development and the growing awareness of the health benefits of fucoidan are also expected to drive market growth during the forecast period.
In conclusion, the market in APAC is poised for steady growth due to increasing health awareness, rising demand for functional foods, and the growing adoption of fucoidan in various industries. The market is expected to witness significant growth during the forecast period, driven by the increasing utilization of fucoidan in food and beverage, pharmaceuticals, and cosmetics industries. The use of microalgae as a sustainable source of fucoidan and the growing investment in research and development are also expected to fuel the market growth.
Our researchers analyzed the data with 2023 as the base year, along with the key drivers, trends, and challenges. A holistic analysis of drivers will help companies refine their marketing strategies to gain a competitive advantage.
Market Driver
Growing health consciousness among consumers is notably driving market growth. Fucoidan, a complex polysaccharide derived from brown seaweeds such as Kombu, Wakame, and Mozuku, has gained significant attention in the natural health industry due to its numerous health benefits. These benefits include anti-inflammatory and antioxidant properties, making Fucoidan an effective immune-boosting supplement.
Moreover, consumers are increasingly interested in Fucoidan as a sustainable health solution for managing chronic diseases like cancer and cardiovascular disease, as well as immune disorders. Fucoidan is available in various application types, including healthcare and cosmetics. Thus, such factors are driving the growth of the market during the forecast period.
Market Trends
Increasing demand for fucoidan in the pharmaceutical industry is the key trend in the market. Fucoidan, a complex sulfated polysaccharide derived from brown seaweeds such as Kombu, Wakame, and Mozuku, has gained significant attention in the natural health industry due to its numerous health benefits. This marine compound is renowned for its anti-inflammatory and antioxidant properties, making it an ideal supplement for addressing chronic diseases, including cancer and cardiovascular disease.
Moreover, consumer interests in natural health supplements continue to grow, leading to the development of various application types, such as capsules, powders, functional foods, and beverages. Seaherb, Marinova, and other sustainable health solution providers source their Fucoidan from various seaweed sources, ensuring the highest quality and purity. Thus, such trends will shape the growth of the market during the forecast period.
Market Challenge
Stringent regulations on fucoidan is the major challenge that affects the growth of the market. Fucoidan, a complex sulfated polysaccharide derived from brown seaweeds such as Kombu, Wakame, and Mozuku, has gained significant attention in the natural health industry due to its numerous health benefits. These seaweeds are rich sources of this bioactive compound, which is known for its anti-inflammatory, antioxidant, and immune-boosting properties.
Moreover, consumer interests in natural health supplements, functional foods and beverages have fuelled the demand for Fucoidan in various application types, including healthcare and cosmetics. Fucoidan's potential applications extend beyond chronic diseases like cancer and cardiovascular disease to immune disorders. Hence, the above factors will impede the growth of the market during the forecast period.
Exclusive Customer Landscape
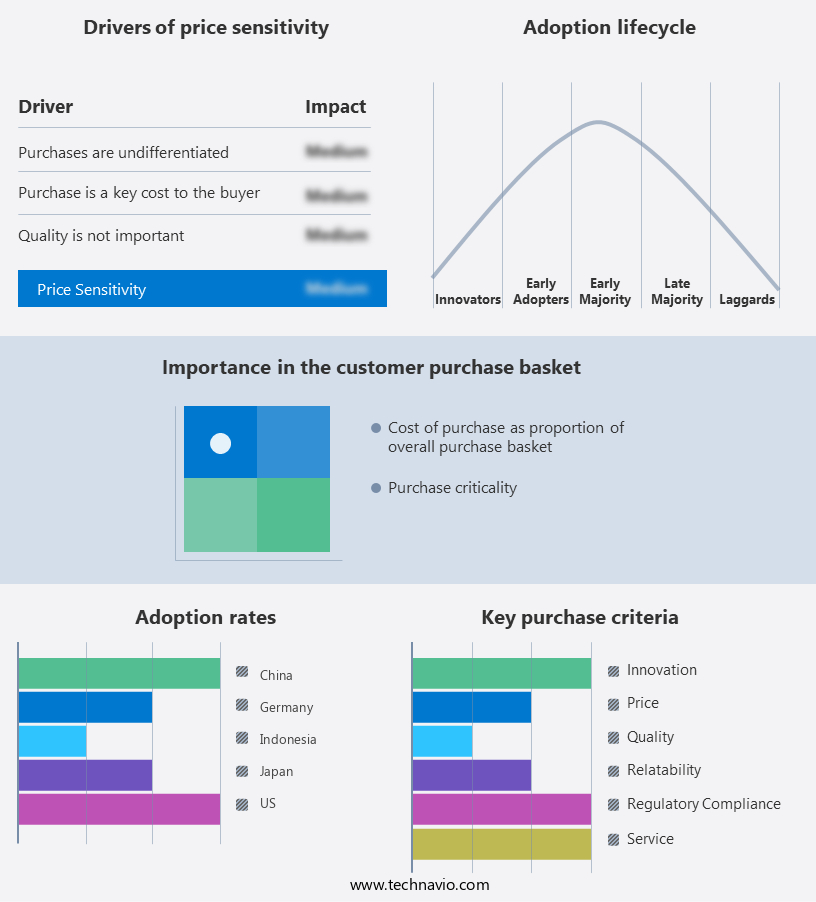
The market forecasting report includes the adoption lifecycle of the market, covering from the innovator's stage to the laggard's stage. It focuses on adoption rates in different regions based on penetration. Furthermore, the report also includes key purchase criteria and drivers of price sensitivity to help companies evaluate and develop their market growth analysis strategies.
Customer Landscape
Key Companies & Market Insights
Companies are implementing various strategies, such as strategic alliances, partnerships, mergers and acquisitions, geographical expansion, and product/service launches, to enhance their presence in the market.
Biocorp Co. Ltd: The company offers fucodian which is high purity fucoidan with over 25 percent sugar content, and over 25 percent sulfate group content.
The market research and growth report includes detailed analyses of the competitive landscape of the market and information about key companies, including:
- ABLY, Inc.
- Biosynth Ltd.
- Champion Co., Ltd.
- Fucoidan USA.com
- Hi Q Marine Biotech International Ltd.
- Hongo Co.,Ltd.
- Inaba Foods USA Inc.
- International Flavors and Fragrances Inc.
- Kamerycah, Inc.
- KANEHIDE BIO Co.Ltd.
- Lemandou Chemicals
- Marinova Pty Ltd.
- Merck KGaA
- SeaHerb Co., LTD.
- SUGOI HEALTH
- The Synergy Co.
- TOKAI BUSSAN CO., LTD.
- Vesta Nutra
Qualitative and quantitative analysis of companies has been conducted to help clients understand the wider business environment as well as the strengths and weaknesses of key market players. Data is qualitatively analyzed to categorize companies as pure play, category-focused, industry-focused, and diversified; it is quantitatively analyzed to categorize companies as dominant, leading, strong, tentative, and weak.
Research Analyst Overview
Brown seaweeds, including kombu, wakame, mozuku, and others, are rich sources of Fucoidan, a complex sulfated polysaccharide. Fucoidan is gaining popularity in the natural health market due to its numerous health benefits. It is known for its anti-inflammatory, antioxidant, and immune-boosting properties. Fucoidan is used in various forms, such as capsules, powders, and functional foods and beverages, to cater to consumer interests. Chronic diseases like cancer, cardiovascular disease, and immune disorders are on the rise, fueling the demand for natural health supplements. Fucoidan's antitumor, antioxidant, anti-angiogenic, antiviral, anticoagulant, and antithrombotic properties make it an attractive option for healthcare applications.
In the cosmetics industry, Fucoidan is used in skincare products due to its anti-aging properties. It helps protect the skin from damage caused by free radicals and inflammation. Fucoidan's application extends to marine resources, including seaherbs like Marinova and sustainable health solutions. Quality control and purity are crucial factors in the market. Farmers and manufacturers must ensure that their products are free from contaminants, such as heavy metals. Clinical trials are ongoing to further explore Fucoidan's potential health benefits. Fucoidan is derived from various seaweeds, including Undaria pinnatifida and Fucus vesiculosus. Ocean waters rich in nutrients provide the ideal conditions for the growth of these macro algae.
Fucoidan is also found in microalgae, such as Euglena gracilis, and beta-glucans. Heart disease, stroke, and other chronic conditions are driving the demand for nutritional foods, nutraceuticals, and dietary supplements. Fucoidan's health benefits make it a valuable addition to this market. However, it is essential to ensure that Fucoidan products meet the highest standards of quality control and purity.
|
Market Scope |
|
|
Report Coverage |
Details |
|
Page number |
186 |
|
Base year |
2023 |
|
Historic period |
2018-2022 |
|
Forecast period |
2024-2028 |
|
Growth momentum & CAGR |
Accelerate at a CAGR of 7.77% |
|
Market growth 2024-2028 |
USD 109.6 million |
|
Market structure |
Fragmented |
|
YoY growth 2023-2024(%) |
7.57 |
|
Regional analysis |
APAC, Europe, North America, South America, and Middle East and Africa |
|
Performing market contribution |
APAC at 66% |
|
Key countries |
Japan, China, US, Indonesia, and Germany |
|
Competitive landscape |
Leading Companies, Market Positioning of Companies, Competitive Strategies, and Industry Risks |
|
Key companies profiled |
ABLY, Inc., Biocorp Co. Ltd., Biosynth Ltd., Champion Co., Ltd., Fucoidan USA.com, Hi Q Marine Biotech International Ltd., Hongo Co.,Ltd., Inaba Foods USA Inc., International Flavors and Fragrances Inc., Kamerycah, Inc., KANEHIDE BIO Co.Ltd., Lemandou Chemicals, Marinova Pty Ltd., Merck KGaA, SeaHerb Co., LTD., SUGOI HEALTH, The Synergy Co., TOKAI BUSSAN CO., LTD., and Vesta Nutra |
|
Market dynamics |
Parent market analysis, market growth inducers and obstacles, market forecast, fast-growing and slow-growing segment analysis, COVID-19 impact and recovery analysis and future consumer dynamics, market condition analysis for the forecast period |
|
Customization purview |
If our market report has not included the data that you are looking for, you can reach out to our analysts and get segments customized. |
What are the Key Data Covered in this Market Research and Growth Report?
- CAGR of the market during the forecast period
- Detailed information on factors that will drive the market growth and forecasting between 2024 and 2028
- Precise estimation of the size of the market and its contribution of the market in focus to the parent market
- Accurate predictions about upcoming market growth and trends and changes in consumer behaviour
- Growth of the market across APAC, Europe, North America, South America, and Middle East and Africa
- Thorough analysis of the market's competitive landscape and detailed information about companies
- Comprehensive analysis of factors that will challenge the growth of market companies
We can help! Our analysts can customize this market research report to meet your requirements. Get in touch
 RIA -
RIA - 
