Antioxidant Market Analysis APAC, North America, Europe, Middle East and Africa, South America - China, US, Japan, Germany, UK - Size and Forecast 2024-2028

Antioxidant Market Analysis APAC, North America, Europe, Middle East and Africa, South America - China, US, Japan, Germany, UK - Size and Forecast 2024-2028

Published: Oct 2024 171 Pages SKU: IRTNTR74686

Market Overview at a Glance

$1.50 B
Market Opportunity
6.4%
CAGR
5.6
YoY growth 2023-2024(%)

Antioxidant Market Size 2024-2028 

The antioxidant market size is forecast to increase by USD 1.50 billion at a CAGR of 6.4% between 2023 and 2028. The market is experiencing significant growth due to the increasing global population and rising demand for processed foods. The manufacturing facilities for antioxidants are facing challenges from supply chain disruptions and trade barriers. To mitigate these issues, strategic alliances and collaborations are being formed to ensure a steady supply of antioxidants. The market is also witnessing a trend towards the production of antioxidant-enriched cosmetic products and anti-aging products, further boosting market growth. In addition, the use of antioxidants in personal care products is becoming more prominent, as consumers seek skincare solutions that offer anti-aging benefits and promote overall skin health. Moreover, antioxidants are increasingly being incorporated into plastic additives, contributing to the development of more durable and longer-lasting plastic products. Despite these opportunities, the high cost of antioxidants remains a significant challenge for market participants. In summary, the market is witnessing growth due to increasing demand from various industries, including personal care and plastic additives, as well as new extraction techniques, but is facing challenges from supply chain disruptions and high costs.

What will be the Size of the Market During the Forecast Period?

Antioxidant Market Size

 Request Free Sample

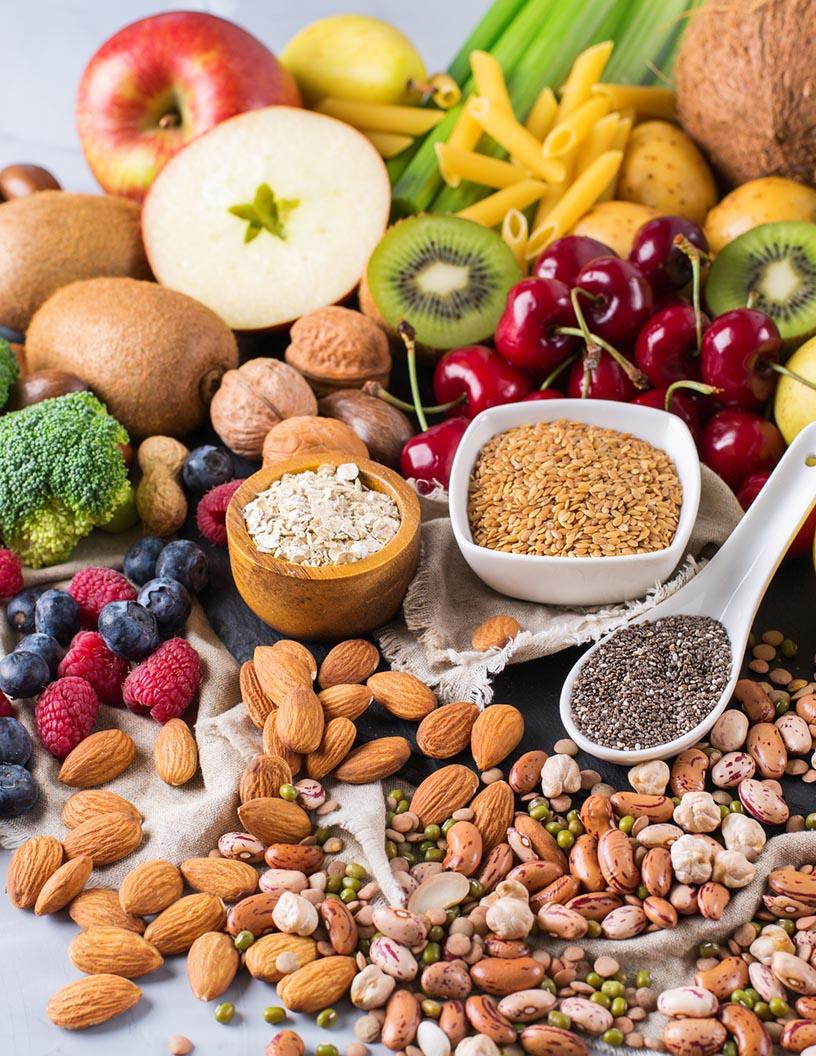
Antioxidants are substances that inhibit or neutralize the damaging effects of free radicals, unstable molecules formed during an oxidation process. These reactive species can cause harm to organisms' cells, leading to various health issues and food spoilage. Free radicals are naturally produced in the body during metabolic processes, but they can also originate from external sources such as pollution, UV radiation, and certain foods. In the food industry, antioxidants play a crucial role in preserving the quality and extending the shelf life of various products. Fruits and vegetables are rich sources of natural antioxidants, including vitamin C, vitamin E, polyphenols, carotenoids, and flavonoids. Raspberries, spinach, and eggplant are some examples of nutrient-dense produce that offer significant antioxidant benefits. However, the demand for antioxidants extends beyond fresh produce. Artificially produced antioxidants are used as additions in processed food, fuel, plastics, latex, pharmaceutical items, cosmetic products, and animal feeds. In the food and beverages sector, antioxidants act as preservatives, preventing oxidation and rancidity that can lead to food waste.

Vitamin C-based, vitamin E-based, polyphenols-based, carotenoids-based, and nutraceutical antioxidants are popular choices for food manufacturers. The antioxidants market is driven by the growing awareness of their health benefits and the increasing demand for extended shelf life and reduced food waste. The market is expected to grow significantly due to the expanding application areas and the continuous research and development in antioxidant technology. In conclusion, antioxidants are essential in preventing oxidation and protecting organisms' cells from damage. Their role goes beyond fresh produce, extending to various industries such as food and beverages, pharmaceuticals, cosmetics, and more. Natural antioxidants derived from fruits, vegetables, and other sources continue to be in high demand, while synthetic antioxidants offer solutions for specific applications where natural alternatives may not suffice. The antioxidants market is poised for growth as the demand for extended shelf life, reduced food waste, and health benefits continues to increase.

Market Segmentation

The market research report provides comprehensive data (region-wise segment analysis), with forecasts and estimates in "USD million" for the period 2024-2028, as well as historical data from 2018-2022 for the following segments.

  • Application
    • Food and beverages
    • Pharmaceuticals
    • Personal care
    • Animal feeds
  • Type
    • Vitamin C-based
    • Vitamin E-based
    • Polyphenols-based
    • Carotenoids-based
  • Geography
    • APAC
      • China
      • Japan
    • North America
      • US
    • Europe
      • Germany
      • UK
    • Middle East and Africa
    • South America

By Application Insights

The food and beverages segment is estimated to witness significant growth during the forecast period. Antioxidants play a significant role in the food and beverage industry, serving both nutritional and functional purposes. These compounds help prevent food deterioration, which can lead to spoilage and undesirable flavors, primarily due to oxidation. In response, antioxidants are extensively used to inhibit oxidation and extend the shelf life of various food products. For instance, BHA (butylated hydroxyanisole), BHT (butylated hydroxytoluene), and TBHQ (tertiary butylhydroquinone) are commonly used antioxidants in beverages to maintain their freshness.

However, processed food and beverages require added antioxidants to extend their shelf life and maintain desirable taste and texture. Antioxidants, such as BHA (butylated hydroxyanisole), BHT (butylated hydroxytoluene), and TBHQ (tertiary butylhydroquinone), are widely used in the food and beverage industry to inhibit oxidation. For instance, raspberries and spinach are naturally rich in antioxidants, but added antioxidants help preserve the quality of beverages like fruit juices and carbonated drinks. By preventing oxidation, antioxidants ensure that food and beverages maintain their freshness, flavor, and nutritional value for an extended period.

Antioxidant Market Size

Get a glance at the market share of various segments Request Free Sample

The Food and beverages segment accounted for USD 1.18 billion in 2018 and showed a gradual increase during the forecast period.

Regional Insights

APAC is estimated to contribute 56% to the growth of the global market during the forecast period. Technavio's analysts have elaborately explained the regional trends and drivers that shape the market during the forecast period.

Antioxidant Market Share by Geography

For more insights on the market share of various regions Request Free Sample

The market experienced significant growth in 2023, with Asia Pacific (APAC) leading the charge. This region held the largest market share and is projected to expand at the fastest rate during the forecast period. Factors contributing to this growth include the increasing disposable incomes of consumers and the rising population of elderly individuals in APAC. In this region, there is a high demand for antioxidant-based food and beverages, animal feeds, and nutraceutical products. For instance, there is a strong preference for antioxidant-infused skincare products, such as skin whitening creams and anti-aging serums, due to growing consumer awareness about personal hygiene and wellness.

Additionally, the increasing geriatric population in economies like China, Japan, and South Korea has fueled the demand for sun protection products that contain antioxidants. Polyphenols, vitamin C, vitamin E, carotenoids, and other nutraceutical antioxidants are widely used in various industries, including food and beverages, animal feeds, and pharmaceuticals, to enhance product quality and shelf life. As the demand for clean label products continues to rise, there is a growing focus on natural antioxidant sources, such as plant extracts and natural vitamins. Overall, the market is expected to continue its expansion in the coming years, driven by increasing consumer awareness, growing demand for functional foods and beverages, and the rising geriatric population.

Our researchers analyzed the data with 2023 as the base year, along with the key drivers, trends, and challenges. A holistic analysis of drivers will help companies refine their marketing strategies to gain a competitive advantage.

Market Driver

Rising demand from personal care industry is the key driver of the market. Antioxidants, primarily derived from natural sources, play a crucial role in neutralizing free radicals that can cause oxidative stress. Free radicals, formed due to various factors such as sunlight, pollution, environmental toxins, tobacco use, and stress, can damage the skin's structure and genetic material, leading to inflammation, hyperpigmentation, acne, and cell damage, ultimately resulting in wrinkles. To combat this, antioxidants work by scavenging free radicals, preventing them from causing further cell damage. These antioxidants, including vitamin C, help correct signs of aging, repair skin, and brighten skin tone.

Additionally, they can stimulate collagen production, which is essential for maintaining youthful-looking skin. In various industries, antioxidants are used as additives in the defense and aerospace sectors as fuel and plastic additives, and in cosmetic products to enhance their effectiveness.

Market Trends

The rising adoption of new extraction techniques of antioxidants is the upcoming trend in the market. Antioxidants, derived from natural resources, have gained significant attention in various industries due to their beneficial properties. Extraction of these antioxidants, particularly Vitamin A, from natural sources is increasingly preferred over synthetic methods. New techniques, referred to as non-conventional extraction methods, are being adopted to improve the efficiency and sustainability of the extraction process.

These techniques include ultrasound-assisted extraction, pulsed electric field extraction, enzyme-assisted extraction, microwave-assisted extraction, pressurized liquid extraction, supercritical fluid extraction, pressurized low-polarity water extraction, and molecular distillation. These methods offer advantages such as reduced processing time and energy consumption, elimination of harmful solvents, and increased yield. Organic cosmetics and health food industries are major consumers of antioxidants, making the market for these natural extracts a promising one.

Market Challenge

The high cost of antioxidants is a key challenge affecting the market growth. Antioxidants are essential compounds used in various industries, including food and cosmetics, to extend the shelf life and enhance the quality of products. However, the global population's increasing demand for processed foods and antioxidant-enriched cosmetics and anti-aging products puts pressure on the supply chain, leading to potential disruptions and trade barriers. For instance, tocopherol, a popular antioxidant derived from vegetable oil, faces production challenges due to the high demand for vegetable oil in multiple industries.

The limited supply of vegetable oil, used as the raw material for tocopherol production, drives up its cost and, consequently, the cost of antioxidants. Strategic alliances between manufacturing facilities and suppliers can help mitigate these challenges and ensure a stable supply of antioxidants.

Exclusive Customer Landscape

The market forecasting report includes the adoption lifecycle of the market, covering from the innovator's stage to the laggard's stage. It focuses on adoption rates in different regions based on penetration. Furthermore, the report also includes key purchase criteria and drivers of price sensitivity to help companies evaluate and develop their market growth analysis strategies.

Antioxidant Market Share by Geography

 Customer Landscape

Key Companies & Market Insights

Companies are implementing various strategies, such as strategic alliances, partnerships, mergers and acquisitions, geographical expansion, and product/service launches, to enhance their presence in the market.

Adisseo Co. - The company offers antioxidants such as Selisseo.

The market research and growth report includes detailed analyses of the competitive landscape of the market and information about key companies, including:

  • 3V Sigma USA Inc.
  • ADEKA Corp
  • Archer Daniels Midland Co.
  • Barentz International BV
  • BASF SE
  • Beijing Tiangang Auxiliary Co. Ltd.
  • BIOTECNOLOGIAS APLICADAS SL
  • Cargill Inc.
  • Chitec Technology Co. Ltd.
  • Clariant AG
  • Double Bond Chemical Ind. Co. Ltd.
  • Dover Chemical Corp.
  • DuPont de Nemours Inc.
  • Eastman Chemical Co.
  • Everspring Chemical Co. Ltd.
  • Evonik Industries AG
  • IMCD NV
  • Kalsec Inc.
  • Kemin Industries Inc.
  • Koninklijke DSM NV
  • Oxiris Chemicals SA
  • SI Group Inc.
  • Solvay SA
  • Taiwan Dyestuffs and Pigments Corp.

Qualitative and quantitative analysis of companies has been conducted to help clients understand the wider business environment as well as the strengths and weaknesses of key market players. Data is qualitatively analyzed to categorize companies as pure play, category-focused, industry-focused, and diversified; it is quantitatively analyzed to categorize companies as dominant, leading, strong, tentative, and weak.

Research Analyst Overview

The antioxidants market encompasses the production and consumption of various antioxidants used in different industries. Antioxidants are substances that prevent or slow down the oxidation process in organisms' cells. Oxidation is a natural process that results in the formation of free radicals, which can damage cells and lead to various health issues. Fruits and vegetables are rich sources of natural antioxidants such as vitamin C, vitamin E, carotenoids, and polyphenols. Raspberries, spinach, and eggplant are some of the foods known for their high antioxidant content. However, antioxidants are also artificially produced and used as additions in processed food, preservatives in fuels, plastics, and latex, and as ingredients in the pharmaceutical and cosmetic industries. Natural antioxidants like vitamin C and vitamin E are popular in the food antioxidants market, while synthetic antioxidants like butylated hydroxyanisole (BHA), butylated hydroxytoluene (BHT), and propyl gallate are widely used in various industries.

Further, antioxidants offer numerous health benefits, including extending shelf life, reducing food waste, and enhancing the nutritional value of food and beverages, animal feeds, and vitamin-based products. The global population's increasing demand for clean label products and the growing awareness of the health benefits of antioxidants are driving the market's growth. The market also caters to the defense and aerospace sectors, where antioxidants are used as fuel and plastic additives, and in the production of antioxidant-enriched cosmetics and anti-aging products. The market's growth is, however, challenged by supply chain disruptions, trade barriers, and strategic alliances among market players.

Market Scope

Report Coverage

Details

Page number

171

Base year

2023

Historic period

2018-2022

Forecast period

2024-2028

Growth momentum & CAGR

Accelerate at a CAGR of 6.4%

Market growth 2024-2028

USD 1.50 billion

Market structure

Fragmented

YoY growth 2023-2024(%)

5.6

Regional analysis

APAC, North America, Europe, Middle East and Africa, and South America

Performing market contribution

APAC at 56%

Key countries

China, US, Japan, Germany, and UK

Competitive landscape

Leading Companies, Market Positioning of Companies, Competitive Strategies, and Industry Risks

Key companies profiled

3V Sigma USA Inc., ADEKA Corp, Adisseo Co., Archer Daniels Midland Co., Barentz International BV, BASF SE, Beijing Tiangang Auxiliary Co. Ltd., BIOTECNOLOGIAS APLICADAS SL, Cargill Inc., Chitec Technology Co. Ltd., Clariant AG, Double Bond Chemical Ind. Co. Ltd., Dover Chemical Corp., DuPont de Nemours Inc., Eastman Chemical Co., Everspring Chemical Co. Ltd., Evonik Industries AG, IMCD NV, Kalsec Inc., Kemin Industries Inc., Koninklijke DSM NV, Oxiris Chemicals SA, SI Group Inc., Solvay SA, and Taiwan Dyestuffs and Pigments Corp.

Market dynamics

Parent market analysis, market growth inducers and obstacles, market forecast, fast-growing and slow-growing segment analysis, COVID-19 impact and recovery analysis and future consumer dynamics, market condition analysis for the forecast period

Customization purview

If our market report has not included the data that you are looking for, you can reach out to our analysts and get segments customized.

Request Free Sample

What are the Key Data Covered in this Market Research and Growth Report?

  • CAGR of the market during the forecast period
  • Detailed information on factors that will drive the market growth and forecasting between 2024 and 2028
  • Precise estimation of the size of the market  and its contribution of the market in focus to the parent market
  • Accurate predictions about upcoming market growth and trends and changes in consumer behaviour
  • Growth of the market across APAC, North America, Europe, Middle East and Africa, and South America
  • Thorough analysis of the market's competitive landscape and detailed information about companies
  • Comprehensive analysis of factors that will challenge the growth of market companies

We can help! Our analysts can customize this market research report to meet your requirements. Get in touch

1 Executive Summary

  • 1.1 Market overview
    • Executive Summary - Chart on Market Overview
    • Executive Summary - Data Table on Market Overview
    • Executive Summary - Chart on Global Market Characteristics
    • Executive Summary - Chart on Market by Geography
    • Executive Summary - Chart on Market Segmentation by Application
    • Executive Summary - Chart on Market Segmentation by Type
    • Executive Summary - Chart on Incremental Growth
    • Executive Summary - Data Table on Incremental Growth
    • Executive Summary - Chart on Company Market Positioning

2 Market Landscape

  • 2.1 Market ecosystem
    • Parent Market
    • Data Table on - Parent Market
  • 2.2 Market characteristics
    • Market characteristics analysis
  • 2.3 Value chain analysis
    • Value Chain Analysis

3 Market Sizing

  • 3.1 Market definition
    • Offerings of companies included in the market definition
  • 3.2 Market segment analysis
    • Market segments
  • 3.3 Market size 2023
    • 3.4 Market outlook: Forecast for 2023-2028
      • Chart on Global - Market size and forecast 2023-2028 ($ million)
      • Data Table on Global - Market size and forecast 2023-2028 ($ million)
      • Chart on Global Market: Year-over-year growth 2023-2028 (%)
      • Data Table on Global Market: Year-over-year growth 2023-2028 (%)

    4 Historic Market Size

    • 4.1 Global Antioxidant Market 2018 - 2022
      • Historic Market Size - Data Table on Global Antioxidant Market 2018 - 2022 ($ million)
    • 4.2 Application segment analysis 2018 - 2022
      • Historic Market Size - Application Segment 2018 - 2022 ($ million)
    • 4.3 Type segment analysis 2018 - 2022
      • Historic Market Size - Type Segment 2018 - 2022 ($ million)
    • 4.4 Geography segment analysis 2018 - 2022
      • Historic Market Size - Geography Segment 2018 - 2022 ($ million)
    • 4.5 Country segment analysis 2018 - 2022
      • Historic Market Size - Country Segment 2018 - 2022 ($ million)

    5 Five Forces Analysis

    • 5.1 Five forces summary
      • Five forces analysis - Comparison between 2023 and 2028
    • 5.2 Bargaining power of buyers
      • Bargaining power of buyers - Impact of key factors 2023 and 2028
    • 5.3 Bargaining power of suppliers
      • Bargaining power of suppliers - Impact of key factors in 2023 and 2028
    • 5.4 Threat of new entrants
      • Threat of new entrants - Impact of key factors in 2023 and 2028
    • 5.5 Threat of substitutes
      • Threat of substitutes - Impact of key factors in 2023 and 2028
    • 5.6 Threat of rivalry
      • Threat of rivalry - Impact of key factors in 2023 and 2028
    • 5.7 Market condition
      • Chart on Market condition - Five forces 2023 and 2028

    6 Market Segmentation by Application

    • 6.1 Market segments
      • Chart on Application - Market share 2023-2028 (%)
      • Data Table on Application - Market share 2023-2028 (%)
    • 6.2 Comparison by Application
      • Chart on Comparison by Application
      • Data Table on Comparison by Application
    • 6.3 Food and beverages - Market size and forecast 2023-2028
      • Chart on Food and beverages - Market size and forecast 2023-2028 ($ million)
      • Data Table on Food and beverages - Market size and forecast 2023-2028 ($ million)
      • Chart on Food and beverages - Year-over-year growth 2023-2028 (%)
      • Data Table on Food and beverages - Year-over-year growth 2023-2028 (%)
    • 6.4 Pharmaceuticals - Market size and forecast 2023-2028
      • Chart on Pharmaceuticals - Market size and forecast 2023-2028 ($ million)
      • Data Table on Pharmaceuticals - Market size and forecast 2023-2028 ($ million)
      • Chart on Pharmaceuticals - Year-over-year growth 2023-2028 (%)
      • Data Table on Pharmaceuticals - Year-over-year growth 2023-2028 (%)
    • 6.5 Personal care - Market size and forecast 2023-2028
      • Chart on Personal care - Market size and forecast 2023-2028 ($ million)
      • Data Table on Personal care - Market size and forecast 2023-2028 ($ million)
      • Chart on Personal care - Year-over-year growth 2023-2028 (%)
      • Data Table on Personal care - Year-over-year growth 2023-2028 (%)
    • 6.6 Animal feeds - Market size and forecast 2023-2028
      • Chart on Animal feeds - Market size and forecast 2023-2028 ($ million)
      • Data Table on Animal feeds - Market size and forecast 2023-2028 ($ million)
      • Chart on Animal feeds - Year-over-year growth 2023-2028 (%)
      • Data Table on Animal feeds - Year-over-year growth 2023-2028 (%)
    • 6.7 Market opportunity by Application
      • Market opportunity by Application ($ million)
      • Data Table on Market opportunity by Application ($ million)

    7 Market Segmentation by Type

    • 7.1 Market segments
      • Chart on Type - Market share 2023-2028 (%)
      • Data Table on Type - Market share 2023-2028 (%)
    • 7.2 Comparison by Type
      • Chart on Comparison by Type
      • Data Table on Comparison by Type
    • 7.3 Vitamin C-based - Market size and forecast 2023-2028
      • Chart on Vitamin C-based - Market size and forecast 2023-2028 ($ million)
      • Data Table on Vitamin C-based - Market size and forecast 2023-2028 ($ million)
      • Chart on Vitamin C-based - Year-over-year growth 2023-2028 (%)
      • Data Table on Vitamin C-based - Year-over-year growth 2023-2028 (%)
    • 7.4 Vitamin E-based - Market size and forecast 2023-2028
      • Chart on Vitamin E-based - Market size and forecast 2023-2028 ($ million)
      • Data Table on Vitamin E-based - Market size and forecast 2023-2028 ($ million)
      • Chart on Vitamin E-based - Year-over-year growth 2023-2028 (%)
      • Data Table on Vitamin E-based - Year-over-year growth 2023-2028 (%)
    • 7.5 Polyphenols-based - Market size and forecast 2023-2028
      • Chart on Polyphenols-based - Market size and forecast 2023-2028 ($ million)
      • Data Table on Polyphenols-based - Market size and forecast 2023-2028 ($ million)
      • Chart on Polyphenols-based - Year-over-year growth 2023-2028 (%)
      • Data Table on Polyphenols-based - Year-over-year growth 2023-2028 (%)
    • 7.6 Carotenoids-based - Market size and forecast 2023-2028
      • Chart on Carotenoids-based - Market size and forecast 2023-2028 ($ million)
      • Data Table on Carotenoids-based - Market size and forecast 2023-2028 ($ million)
      • Chart on Carotenoids-based - Year-over-year growth 2023-2028 (%)
      • Data Table on Carotenoids-based - Year-over-year growth 2023-2028 (%)
    • 7.7 Market opportunity by Type
      • Market opportunity by Type ($ million)
      • Data Table on Market opportunity by Type ($ million)

    8 Customer Landscape

    • 8.1 Customer landscape overview
      • Analysis of price sensitivity, lifecycle, customer purchase basket, adoption rates, and purchase criteria

    9 Geographic Landscape

    • 9.1 Geographic segmentation
      • Chart on Market share by geography 2023-2028 (%)
      • Data Table on Market share by geography 2023-2028 (%)
    • 9.2 Geographic comparison
      • Chart on Geographic comparison
      • Data Table on Geographic comparison
    • 9.3 APAC - Market size and forecast 2023-2028
      • Chart on APAC - Market size and forecast 2023-2028 ($ million)
      • Data Table on APAC - Market size and forecast 2023-2028 ($ million)
      • Chart on APAC - Year-over-year growth 2023-2028 (%)
      • Data Table on APAC - Year-over-year growth 2023-2028 (%)
    • 9.4 North America - Market size and forecast 2023-2028
      • Chart on North America - Market size and forecast 2023-2028 ($ million)
      • Data Table on North America - Market size and forecast 2023-2028 ($ million)
      • Chart on North America - Year-over-year growth 2023-2028 (%)
      • Data Table on North America - Year-over-year growth 2023-2028 (%)
    • 9.5 Europe - Market size and forecast 2023-2028
      • Chart on Europe - Market size and forecast 2023-2028 ($ million)
      • Data Table on Europe - Market size and forecast 2023-2028 ($ million)
      • Chart on Europe - Year-over-year growth 2023-2028 (%)
      • Data Table on Europe - Year-over-year growth 2023-2028 (%)
    • 9.6 Middle East and Africa - Market size and forecast 2023-2028
      • Chart on Middle East and Africa - Market size and forecast 2023-2028 ($ million)
      • Data Table on Middle East and Africa - Market size and forecast 2023-2028 ($ million)
      • Chart on Middle East and Africa - Year-over-year growth 2023-2028 (%)
      • Data Table on Middle East and Africa - Year-over-year growth 2023-2028 (%)
    • 9.7 South America - Market size and forecast 2023-2028
      • Chart on South America - Market size and forecast 2023-2028 ($ million)
      • Data Table on South America - Market size and forecast 2023-2028 ($ million)
      • Chart on South America - Year-over-year growth 2023-2028 (%)
      • Data Table on South America - Year-over-year growth 2023-2028 (%)
    • 9.8 China - Market size and forecast 2023-2028
      • Chart on China - Market size and forecast 2023-2028 ($ million)
      • Data Table on China - Market size and forecast 2023-2028 ($ million)
      • Chart on China - Year-over-year growth 2023-2028 (%)
      • Data Table on China - Year-over-year growth 2023-2028 (%)
    • 9.9 US - Market size and forecast 2023-2028
      • Chart on US - Market size and forecast 2023-2028 ($ million)
      • Data Table on US - Market size and forecast 2023-2028 ($ million)
      • Chart on US - Year-over-year growth 2023-2028 (%)
      • Data Table on US - Year-over-year growth 2023-2028 (%)
    • 9.10 Japan - Market size and forecast 2023-2028
      • Chart on Japan - Market size and forecast 2023-2028 ($ million)
      • Data Table on Japan - Market size and forecast 2023-2028 ($ million)
      • Chart on Japan - Year-over-year growth 2023-2028 (%)
      • Data Table on Japan - Year-over-year growth 2023-2028 (%)
    • 9.11 Germany - Market size and forecast 2023-2028
      • Chart on Germany - Market size and forecast 2023-2028 ($ million)
      • Data Table on Germany - Market size and forecast 2023-2028 ($ million)
      • Chart on Germany - Year-over-year growth 2023-2028 (%)
      • Data Table on Germany - Year-over-year growth 2023-2028 (%)
    • 9.12 UK - Market size and forecast 2023-2028
      • Chart on UK - Market size and forecast 2023-2028 ($ million)
      • Data Table on UK - Market size and forecast 2023-2028 ($ million)
      • Chart on UK - Year-over-year growth 2023-2028 (%)
      • Data Table on UK - Year-over-year growth 2023-2028 (%)
    • 9.13 Market opportunity by geography
      • Market opportunity by geography ($ million)
      • Data Tables on Market opportunity by geography ($ million)

    10 Drivers, Challenges, and Opportunity/Restraints

    • 10.1 Market drivers
      • 10.2 Market challenges
        • 10.3 Impact of drivers and challenges
          • Impact of drivers and challenges in 2023 and 2028
        • 10.4 Market opportunities/restraints

          11 Competitive Landscape

          • 11.1 Overview
            • 11.2 Competitive Landscape
              • Overview on criticality of inputs and factors of differentiation
            • 11.3 Landscape disruption
              • Overview on factors of disruption
            • 11.4 Industry risks
              • Impact of key risks on business

            12 Competitive Analysis

            • 12.1 Companies profiled
              • Companies covered
            • 12.2 Market positioning of companies
              • Matrix on companies position and classification
            • 12.3 Adisseo Co.
              • Adisseo Co. - Overview
              • Adisseo Co. - Product / Service
              • Adisseo Co. - Key news
              • Adisseo Co. - Key offerings
            • 12.4 Archer Daniels Midland Co.
              • Archer Daniels Midland Co. - Overview
              • Archer Daniels Midland Co. - Business segments
              • Archer Daniels Midland Co. - Key news
              • Archer Daniels Midland Co. - Key offerings
              • Archer Daniels Midland Co. - Segment focus
            • 12.5 BASF SE
              • BASF SE - Overview
              • BASF SE - Business segments
              • BASF SE - Key news
              • BASF SE - Key offerings
              • BASF SE - Segment focus
            • 12.6 BIOTECNOLOGIAS APLICADAS SL
              • BIOTECNOLOGIAS APLICADAS SL - Overview
              • BIOTECNOLOGIAS APLICADAS SL - Product / Service
              • BIOTECNOLOGIAS APLICADAS SL - Key offerings
            • 12.7 Cargill Inc.
              • Cargill Inc. - Overview
              • Cargill Inc. - Product / Service
              • Cargill Inc. - Key offerings
            • 12.8 DuPont de Nemours Inc.
              • DuPont de Nemours Inc. - Overview
              • DuPont de Nemours Inc. - Business segments
              • DuPont de Nemours Inc. - Key news
              • DuPont de Nemours Inc. - Key offerings
              • DuPont de Nemours Inc. - Segment focus
            • 12.9 Eastman Chemical Co.
              • Eastman Chemical Co. - Overview
              • Eastman Chemical Co. - Business segments
              • Eastman Chemical Co. - Key news
              • Eastman Chemical Co. - Key offerings
              • Eastman Chemical Co. - Segment focus
            • 12.10 Kalsec Inc.
              • Kalsec Inc. - Overview
              • Kalsec Inc. - Product / Service
              • Kalsec Inc. - Key offerings
            • 12.11 Kemin Industries Inc.
              • Kemin Industries Inc. - Overview
              • Kemin Industries Inc. - Product / Service
              • Kemin Industries Inc. - Key news
              • Kemin Industries Inc. - Key offerings
            • 12.12 Koninklijke DSM NV
              • Koninklijke DSM NV - Overview
              • Koninklijke DSM NV - Business segments
              • Koninklijke DSM NV - Key news
              • Koninklijke DSM NV - Key offerings
              • Koninklijke DSM NV - Segment focus

            13 Appendix

            • 13.1 Scope of the report
              • 13.2 Inclusions and exclusions checklist
                • Inclusions checklist
                • Exclusions checklist
              • 13.3 Currency conversion rates for US$
                • Currency conversion rates for US$
              • 13.4 Research methodology
                • Research methodology
              • 13.5 Data procurement
                • Information sources
              • 13.6 Data validation
                • Data validation
              • 13.7 Validation techniques employed for market sizing
                • Validation techniques employed for market sizing
              • 13.8 Data synthesis
                • Data synthesis
              • 13.9 360 degree market analysis
                • 360 degree market analysis
              • 13.10 List of abbreviations
                • List of abbreviations

              Research Methodology

              Technavio presents a detailed picture of the market by way of study, synthesis, and summation of data from multiple sources. The analysts have presented the various facets of the market with a particular focus on identifying the key industry influencers. The data thus presented is comprehensive, reliable, and the result of extensive research, both primary and secondary.

              INFORMATION SOURCES

              Primary sources

              • Manufacturers and suppliers
              • Channel partners
              • Industry experts
              • Strategic decision makers

              Secondary sources

              • Industry journals and periodicals
              • Government data
              • Financial reports of key industry players
              • Historical data
              • Press releases

              DATA ANALYSIS

              Data Synthesis

              • Collation of data
              • Estimation of key figures
              • Analysis of derived insights

              Data Validation

              • Triangulation with data models
              • Reference against proprietary databases
              • Corroboration with industry experts

              REPORT WRITING

              Qualitative

              • Market drivers
              • Market challenges
              • Market trends
              • Five forces analysis

              Quantitative

              • Market size and forecast
              • Market segmentation
              • Geographical insights
              • Competitive landscape

              Interested in this report?

              Get your sample now to see our research methodology and insights!

              Download Now

              Frequently Asked Questions

              Antioxidant market growth will increase by $ 1500 mn during 2024-2028 .

              The Antioxidant market is expected to grow at a CAGR of 6.4% during 2024-2028 .

              Antioxidant market is segmented by Application( Food and beverages, Pharmaceuticals, Personal care, Animal feeds) Type( Vitamin C-based, Vitamin E-based, Polyphenols-based, Carotenoids-based)

              3V Sigma USA Inc., ADEKA Corp, Adisseo Co., Archer Daniels Midland Co., Barentz International BV, BASF SE, Beijing Tiangang Auxiliary Co. Ltd., BIOTECNOLOGIAS APLICADAS SL, Cargill Inc., Chitec Technology Co. Ltd., Clariant AG, Double Bond Chemical Ind. Co. Ltd., Dover Chemical Corp., DuPont de Nemours Inc., Eastman Chemical Co., Everspring Chemical Co. Ltd., Evonik Industries AG, IMCD NV, Kalsec Inc., Kemin Industries Inc., Koninklijke DSM NV, Oxiris Chemicals SA, SI Group Inc., Solvay SA, Taiwan Dyestuffs and Pigments Corp. are a few of the key vendors in the Antioxidant market.

              APAC will register the highest growth rate of 56% among the other regions. Therefore, the Antioxidant market in APAC is expected to garner significant business opportunities for the vendors during the forecast period.

              China, US, Japan, Germany, UK

              • Rising demand from personal care industryAntioxidants is the driving factor this market.
              • predominantly natural antioxidants is the driving factor this market.
              • work by reversing or preventing free radicals from causing oxidative stress. Free radical damage damages the structure and genetic material is the driving factor this market.
              • which leads to inflammation that disrupts the regularly scheduled self-repair systems of the skin. Eventually is the driving factor this market.
              • this leads to hyperpigmentation is the driving factor this market.
              • acne is the driving factor this market.
              • and cell damage that results in wrinkles. Sunlight is the driving factor this market.
              • pollution is the driving factor this market.
              • environmental toxins is the driving factor this market.
              • tobacco is the driving factor this market.
              • and stress also contribute to free radicals. Therefore is the driving factor this market.
              • antioxidants work by scavenging atoms to lose free radicals or electrons so that they cannot cause cell damage. Antioxidants help correct signs of aging is the driving factor this market.
              • repair skin is the driving factor this market.
              • and brighten skin tone. Some antioxidants is the driving factor this market.
              • such as vitamin C is the driving factor this market.
              • can also stimulate collagen production is the driving factor this market.
              • which is vital for youthful skin. Some of the natural antioxidants used in personal care products are vitamin C is the driving factor this market.
              • niacinamide is the driving factor this market.
              • resveratrol is the driving factor this market.
              • vitamin E is the driving factor this market.
              • retinol (vitamin A) is the driving factor this market.
              • Coenzyme Q10 is the driving factor this market.
              • and polyphenols.The growth in the global aging population (above 65 years) is increasing the demand for anti-aging professional skincare products. The signs of anti-aging include wrinkles is the driving factor this market.
              • dark spots is the driving factor this market.
              • dark circles is the driving factor this market.
              • hyperpigmentation is the driving factor this market.
              • and uneven skin tones. To address this growing demand is the driving factor this market.
              • manufacturers of anti-aging products have started developing specific solutions and multifunctional and natural products by using ingredients such as natural antioxidants. Also is the driving factor this market.
              • the demand for natural and organic skincare products is increasing due to increased health consciousness among consumers of skincare products globally is the driving factor this market.
              • which is expected to drive the adoption of antioxidants during the forecast period.An increase in social media campaigns and celebrity endorsements for skincare products is the driving factor this market.
              • particularly natural skincare products is the driving factor this market.
              • has increased awareness about anti-aging ingredients. The continuous release of promotional videos and advertisements by celebrities on social media platforms is the driving factor this market.
              • such as YouTube is the driving factor this market.
              • Instagram is the driving factor this market.
              • and Facebook is the driving factor this market.
              • influence the buying behavior of consumers is the driving factor this market.
              • particularly millennials. Social media influencers also create awareness about key ingredients in skincare products is the driving factor this market.
              • which are highly effective. This increases the adoption of skincare products that contain natural antioxidants such as vitamin C is the driving factor this market.
              • Niacinamide is the driving factor this market.
              • vitamin E is the driving factor this market.
              • and Retinol (vitamin A). Consumers are also concerned about various skin issues such as aging is the driving factor this market.
              • wrinkles is the driving factor this market.
              • and acne is the driving factor this market.
              • which is expected to drive the adoption of skincare products that contain natural antioxidants and will foster the growth of the global antioxidant market during the forecast period. is the driving factor this market.

              The Antioxidant market vendors should focus on grabbing business opportunities from the Food and beverages segment as it accounted for the largest market share in the base year.