Seaweed Market Size 2024-2028
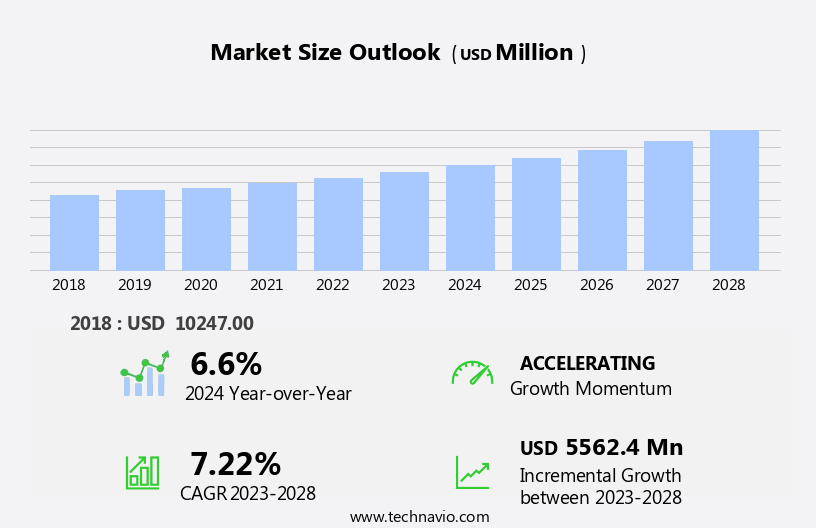
The seaweed market size is forecast to increase by USD 5.56 billion, at a CAGR of 7.22% between 2023 and 2028.
- The market is characterized by three key drivers. Firstly, marketing strategies have increasingly emphasized the health benefits of seaweed, positioning it as a desirable food option, particularly within the paleo diet trend. Secondly, the rising demand for sustainable and eco-friendly food sources further bolsters the market's growth. The increasing population base concerned about obesity is driving the market further. As consumers become more aware of the health benefits associated with seaweed, its popularity in food and beverage products is escalating. However, this market is not without challenges. Health risks associated with the consumption of certain types of seaweed, such as heavy metal contamination and iodine toxicity, pose significant obstacles. Companies must navigate these challenges by implementing stringent quality control measures and transparent labeling practices to assure consumers of their products' safety and authenticity.
- Capitalizing on the market's potential requires a strategic approach that addresses both the opportunities presented by consumer preferences and the challenges posed by potential health risks. Companies that successfully navigate these dynamics will be well-positioned to capitalize on the growing demand for seaweed and contribute to the industry's continued expansion.
What will be the Size of the Seaweed Market during the forecast period?

Explore in-depth regional segment analysis with market size data - historical 2018-2022 and forecasts 2024-2028 - in the full report.
Request Free Sample
The market continues to evolve, driven by the ongoing exploration of new applications and advancements in technology across various sectors. Integrated multi-trophic aquaculture systems combine seaweed cultivation with other marine organisms, enhancing efficiency and sustainability. The value chain of seaweed extends beyond food products to include feedstock for aquaculture, vertical farming, and biorefineries. Seaweed processing efficiency is a key focus, with advancements in phycocolloid extraction and agar extraction technology streamlining production processes. Seaweed cultivation techniques continue to evolve, with vertical farming and offshore cultivation methods gaining traction. Pharmaceutical applications of seaweed are also on the rise, with research into seaweed-derived biomolecules and seaweed pharmaceuticals advancing.
Seaweed biomass processing for bioplastics, cosmetics, biofuel, and hydrolysates is another growing area of interest. Sustainable harvesting practices and quality assessment methods are essential to ensure the long-term viability of the seaweed industry. The potential for seaweed methane production and polysaccharide applications adds to the market's dynamic nature. The continuous unfolding of market activities and evolving patterns underscores the importance of staying informed and adaptable in the seaweed sector.
How is this Seaweed Industry segmented?
The seaweed industry research report provides comprehensive data (region-wise segment analysis), with forecasts and estimates in "USD million" for the period 2024-2028, as well as historical data from 2018-2022 for the following segments.
- Product
- Red seaweed
- Brown seaweed
- Green seaweed
- Application
- Agriculture
- Animal feed
- Human food
- Form
- Whole
- Flakes
- Powder
- Extracts (Hydrocolloids: Agar, Alginate, Carrageenan)
- Oil
- Cultivation Method
- Aquaculture/Cultivated Seaweed
- Wild Harvested Seaweed
- End-use Industry
- Food Industry
- Feed Industry
- Pharmaceutical Industry
- Cosmetic Industry
- Agriculture Industry
- Other Industries
- Geography
- North America
- Europe
- Middle East and Africa
- APAC
- South America
- Rest of World (ROW)
By Product Insights
The red seaweed segment is estimated to witness significant growth during the forecast period.
The market encompasses various segments, including food products, processing equipment, farming practices, market analysis, fertilizers, genomics, integrated farming, carrageenan production methods, quality assessment, multi-trophic aquaculture, value chain, feedstock, vertical farming, processing efficiency, phycocolloid extraction, cultivation techniques, agar extraction technology, pharmaceuticals, biomolecules, biomass processing, biomass yield, cosmetics, biofuel, aquaculture systems, breeding programs, hydrolysates, composition analysis, sustainable harvesting, offshore cultivation, biorefinery, bioplastics, alginate extraction process, methane production, and polysaccharide applications. Red seaweed, a significant segment, is experiencing consistent growth due to its increasing application in food and hydrocolloid production. The health benefits associated with seaweed consumption and the global popularity of Southeast Asian cuisages, which heavily utilize seaweed, are driving market expansion.
Red seaweed varieties, such as petrocladis, gracilaria, and gelidium, offer numerous benefits for human consumption and industrial applications, including use as a bacterial substrate and food binding agent. Seaweed processing equipment, an essential component of the market, is continually evolving to improve efficiency and productivity. Innovations in drying methods, phycocolloid extraction techniques, and carrageenan production processes are crucial in maintaining the competitiveness of market players. Additionally, the integration of multi-trophic aquaculture systems and sustainable harvesting practices ensures a steady supply of seaweed feedstock while minimizing environmental impact. Seaweed-derived biomolecules, such as agar, carrageenan, alginate, and fucoidan, have significant applications in various industries, including food, pharmaceuticals, cosmetics, and bioplastics.
The development of seaweed biorefineries and the exploration of new applications for seaweed biomass are expected to further boost market growth. In conclusion, the market is a dynamic and evolving industry, driven by the increasing demand for seaweed food products and the exploration of new applications for seaweed-derived biomolecules. The market's growth is underpinned by advancements in processing technology, sustainable farming practices, and the integration of multi-trophic aquaculture systems.

Request Free Sample
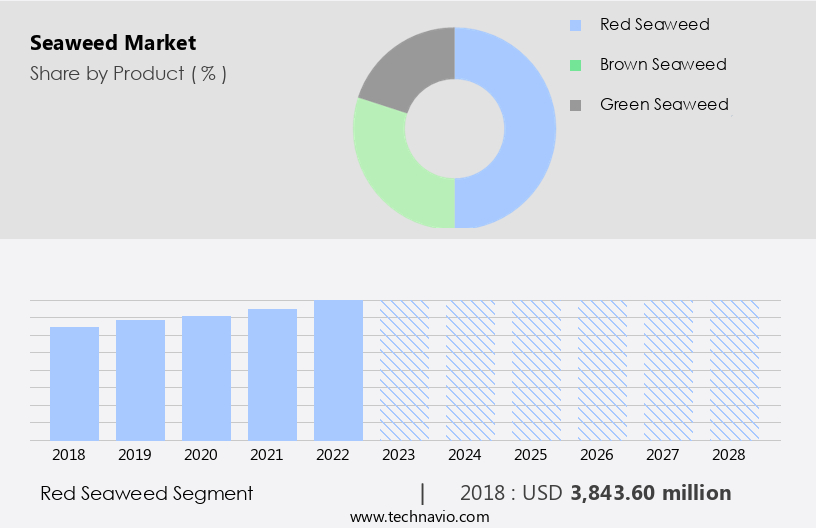
The Red seaweed segment was valued at USD 3.84 billion in 2018 and showed a gradual increase during the forecast period.
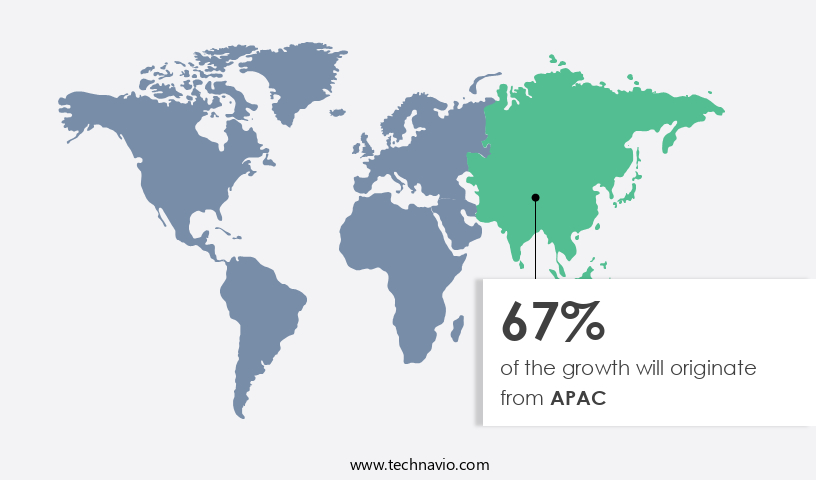
Regional Analysis
APAC is estimated to contribute 67% to the growth of the global market during the forecast period.Technavio's analysts have elaborately explained the regional trends and drivers that shape the market during the forecast period.

Request Free Sample
The market in the Asia Pacific region is experiencing moderate growth, driven by the increasing consumption of seaweed in human food and animal feed. Seaweed is a staple ingredient in Asian cuisines, particularly in Chinese, Japanese, and Korean dishes, leading to a surge in demand for both raw and processed seaweed. The Asia Pacific is the world's largest producer and processor of seaweed, with China, Indonesia, and the Philippines being the dominant players. Indonesia's the market expansion has been noteworthy, driven by advanced kelp farming practices, seaweed-based fertilizers, and integrated farming systems. Carrageenan production methods and phycocolloid extraction are also key processes in the seaweed industry.
Seaweed cultivation techniques, such as vertical farming and offshore cultivation, are being adopted to increase biomass yield. Agar extraction technology and seaweed biomass processing are essential components of the seaweed value chain. Seaweed is also being explored for various applications, including pharmaceuticals, cosmetics, biofuel, and bioplastics, further expanding the market's potential. Sustainable harvesting practices and integrated multi-trophic aquaculture are crucial for maintaining the long-term viability of the seaweed industry. The market's evolution is shaped by advancements in seaweed genomics, breeding programs, hydrolysates, and composition analysis, among other factors.
Market Dynamics
The Seaweed Market is thriving, driven by demand for sustainable, versatile products like seaweed supplements and seaweed snacks, which cater to health-conscious consumers seeking seaweed health benefits. Innovations such as seaweed biodegradable packaging and seaweed-based bioplastics are revolutionizing eco-friendly solutions, while seaweed biofuel and seaweed carbon capture address environmental concerns. Seaweed skincare and seaweed nutraceuticals are gaining traction in the seaweed cosmetic industry, emphasizing natural wellness. Seaweed fertilizer and seaweed animal feed support sustainable agriculture, and advancements in seaweed farming technology and seaweed harvesting equipment enhance production efficiency. Organic seaweed products and seaweed protein source appeal to vegan diets, solidifying seaweed's role in the seaweed sustainable farming and seaweed aquaculture sectors, meeting diverse consumer needs.
Our researchers analyzed the data with 2023 as the base year, along with the key drivers, trends, and challenges. A holistic analysis of drivers will help companies refine their marketing strategies to gain a competitive advantage.
What are the key market drivers leading to the rise in the adoption of Seaweed Industry?
- The implementation of advanced marketing strategies is the primary catalyst for market growth.
- The market encompasses the production and sale of seaweed food products and processing equipment. Kelp farming practices play a crucial role in meeting the increasing demand for these items. Market analysis indicates continuous growth in the seaweed industry, driven by the expanding use of seaweed-based fertilizers and carrageenan production methods. Furthermore, the integration of seaweed farming with other agricultural practices is gaining traction. Seaweed genomics is a burgeoning field that offers potential for innovation in this industry. Quality assessment is essential to ensure the safety and consistency of seaweed products. companies employ various techniques to meet these standards.
- Digital marketing is a primary strategy for promoting seaweed food products to consumers. Social media platforms, such as Facebook, Instagram, and X, are popular channels for reaching the millennial demographic. Quick-service restaurants and other commercial companies leverage these sites to increase brand awareness and engage customers through promotional offers and visual content.
What are the market trends shaping the Seaweed Industry?
- The increasing popularity of the paleo diet is driving a significant market trend towards seaweed. This nutrient-rich sea vegetable is gaining recognition for its health benefits and is becoming a preferred food choice for those following the paleo diet.
- The market is experiencing significant growth due to the increasing adoption of integrated multi-trophic aquaculture and the expanding seaweed value chain. Seaweed serves as an essential feedstock in this sustainable farming method, which enhances the productivity of aquaculture systems while reducing environmental impact. Seaweed processing efficiency is a critical factor driving market growth, with advancements in phycocolloid extraction technology and seaweed cultivation techniques. Agar extraction technology, in particular, has gained prominence due to its application in various industries, including food, pharmaceuticals, and cosmetics. Seaweed pharmaceuticals represent a significant market segment, with seaweeds exhibiting various health benefits. Red, green, and brown seaweeds are the primary types used in the industry, each offering unique properties.
- For instance, red seaweeds like dulse are popular for their savory taste and nutritional value, making them suitable for use as a snack or food flavoring. In conclusion, the market is poised for growth due to its role in sustainable aquaculture, increasing demand for seaweed-derived products, and advancements in processing technology. These factors are expected to drive market expansion in the coming years.
What challenges does the Seaweed Industry face during its growth?
- The growth of the seaweed industry faces significant challenges due to the potential health risks linked to its consumption. It is crucial to address and mitigate these risks to ensure consumer safety and confidence in the market.
- Seaweed, a rich source of biomolecules, offers significant potential for various industries, including cosmetics and biofuels. The processing of seaweed biomass is crucial for maximizing yield and extracting valuable components. Seaweed composition analysis is essential to understand the unique properties of different species. However, it's important to note that excessive consumption of seaweed can pose health risks. High concentrations of certain nutrients, such as iodine, vitamin K, and potassium, can interfere with medications or cause problems for specific health conditions. For instance, iodine, which is beneficial for thyroid health, can have the opposite effect when consumed in excess.
- Similarly, high potassium content in red seaweeds like dulse can be problematic for individuals with kidney disease. Therefore, while the benefits of seaweed are undeniable, it's crucial to consume it in moderation to avoid potential side effects. Seaweed-derived biomolecules, such as hydrolysates, are gaining popularity in various industries due to their unique properties. Seaweed biomass processing, seaweed breeding programs, and cosmetics are some of the key areas where seaweed biomass is being explored for its potential applications. Additionally, seaweed biofuel is an emerging area of research, offering a sustainable alternative to fossil fuels.
Exclusive Customer Landscape
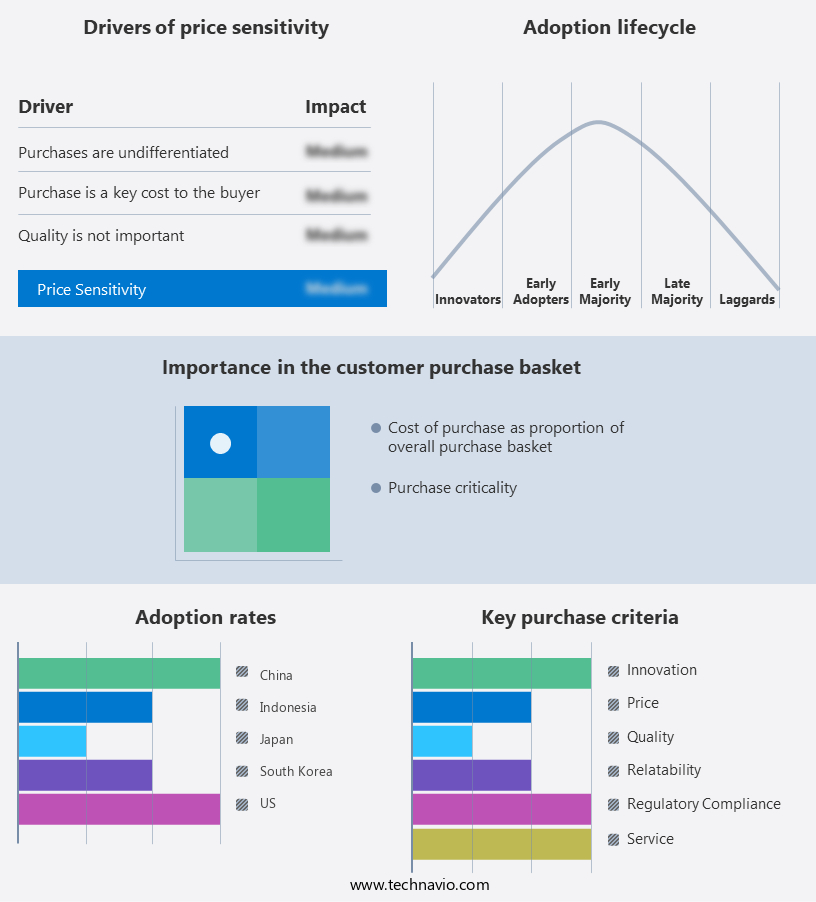
The seaweed market forecasting report includes the adoption lifecycle of the market, covering from the innovator's stage to the laggard's stage. It focuses on adoption rates in different regions based on penetration. Furthermore, the seaweed market report also includes key purchase criteria and drivers of price sensitivity to help companies evaluate and develop their market growth analysis strategies.

Customer Landscape
Key Companies & Market Insights
Companies are implementing various strategies, such as strategic alliances, seaweed market forecast, partnerships, mergers and acquisitions, geographical expansion, and product/service launches, to enhance their presence in the industry.
Acadian Seaplants Ltd. - The company specializes in seaweed-derived products, including Hana Tsunomata, Acadian SeaPlus, Tasco, and Acadian Kelp. These offerings enhance animal and soil health through natural nutrients and minerals, contributing to sustainable agriculture and animal nutrition solutions.
The industry research and growth report includes detailed analyses of the competitive landscape of the market and information about key companies, including:
- Acadian Seaplants Ltd.
- Beijing Leili Agricultural Co. Ltd
- Biostadt India Ltd.
- Branded Garden Products Ltd.
- BRANDT Inc.
- Cargill Inc.
- Compagnie Financiere et de Participations Roullier
- COMPO EXPERT GmbH
- Corbion nv
- De Smaakspecialist
- DuluxGroup Australia Pty Ltd.
- DuPont de Nemours Inc.
- Gelymar SA
- gimMe Health Foods Inc.
- Indigrow Ltd.
- Irish Seaweeds
- J M Huber Corp.
- Maine Coast Sea Vegetables Inc.
- Ocean Harvest Technology Ltd.
- West Coast Marine Bio Processing Corp.
Qualitative and quantitative analysis of companies has been conducted to help clients understand the wider business environment as well as the strengths and weaknesses of key industry players. Data is qualitatively analyzed to categorize companies as pure play, category-focused, industry-focused, and diversified; it is quantitatively analyzed to categorize companies as dominant, leading, strong, tentative, and weak.
Recent Development and News in Seaweed Market
- In January 2024, Marinus Pharmaceuticals, a leading biotech company, announced the FDA approval of its innovative seaweed-derived drug, Kahalalide F, for the treatment of advanced solid tumors (Business Wire). This regulatory milestone marked a significant breakthrough in the application of seaweed extracts in pharmaceuticals.
- In March 2024, Cargill, a global food and agriculture company, entered into a strategic partnership with Ocean Rainforest, a Norwegian seaweed farming company, to expand its algae-based ingredients business (Cargill Press Release). This collaboration aimed to explore the production and commercialization of sustainable seaweed-derived ingredients for the food and beverage industry.
- In May 2024, The Seaboard Corporation, a global agribusiness and food processing company, completed the acquisition of OceanGrow, a US-based seaweed farming and processing company, for USD120 million (SEC Filing). This acquisition was a part of Seaboard's efforts to diversify its business portfolio and capitalize on the growing demand for seaweed-based products.
- In February 2025, Fuqing King Dinghaien Biotech Co. Ltd., a leading seaweed producer in China, announced the successful commissioning of its new 10,000-ton seaweed processing facility in Fujian Province (Xinhua News Agency). This expansion significantly increased the company's production capacity and strengthened its position as a major player in The market.
Research Analyst Overview
- The market encompasses various sectors, including sustainability metrics, carbon sequestration, pre-treatment, biodiversity, waste utilization, bioenergy, pest control, biomaterials, bioremediation, enzymatic hydrolysis, fertilizer efficacy, harvesting technology, functional properties, genetic resources, carrageenan functionalities, kelp forest restoration, extraction yields, nutritional value, alginate properties, cultivation optimization, agar gel strength, phytoremediation, and economic impacts. Seaweed sustainability metrics and carbon sequestration are crucial aspects of the industry, with companies focusing on reducing environmental footprints and enhancing carbon capture. Pre-treatment techniques optimize the extraction of valuable compounds, while biodiversity conservation is essential for long-term growth. Waste utilization and bioenergy applications offer potential revenue streams, with seaweed-derived biomaterials gaining traction in various industries.
- Pest control and disease management strategies are essential to maintain healthy cultivation sites. Seaweed genetic resources and enzymatic hydrolysis are key to improving cultivation efficiencies and optimizing yields. Functional properties, such as carrageenan and alginate, offer numerous applications in food, pharmaceuticals, and industrial sectors. Cultivation economics and phytoremediation are critical factors in the industry's expansion, with seaweed's economic impacts extending beyond direct sales and into various industries. Agar gel strength and seaweed biomass composition are essential considerations for product development and market differentiation. Kelp forest restoration and fertilizer efficacy contribute to the industry's environmental sustainability, while harvesting technology and disease management ensure efficient and sustainable production.
- Seaweed bioremediation and phytoremediation offer potential solutions to environmental challenges, further highlighting the market's versatility and importance.
Dive into Technavio's robust research methodology, blending expert interviews, extensive data synthesis, and validated models for unparalleled Seaweed Market insights. See full methodology.
|
Market Scope
|
|
Report Coverage
|
Details
|
|
Page number
|
171
|
|
Base year
|
2023
|
|
Historic period
|
2018-2022 |
|
Forecast period
|
2024-2028
|
|
Growth momentum & CAGR
|
Accelerate at a CAGR of 7.22%
|
|
Market growth 2024-2028
|
USD 5562.4 million
|
|
Market structure
|
Fragmented
|
|
YoY growth 2023-2024(%)
|
6.6
|
|
Key countries
|
US, Canada, Germany, UK, Italy, France, China, India, Japan, Brazil, Egypt, UAE, Oman, Argentina, KSA, UAE, Brazil, and Rest of World (ROW)
|
|
Competitive landscape
|
Leading Companies, Market Positioning of Companies, Competitive Strategies, and Industry Risks
|
Request Free Sample
What are the Key Data Covered in this Seaweed Market Research and Growth Report?
- CAGR of the Seaweed industry during the forecast period
- Detailed information on factors that will drive the growth and forecasting between 2024 and 2028
- Precise estimation of the size of the market and its contribution of the industry in focus to the parent market
- Accurate predictions about upcoming growth and trends and changes in consumer behaviour
- Growth of the market across APAC, Europe, North America, South America, and Middle East and Africa
- Thorough analysis of the market's competitive landscape and detailed information about companies
- Comprehensive analysis of factors that will challenge the seaweed market growth of industry companies
We can help! Our analysts can customize this seaweed market research report to meet your requirements.
Get in touch
1 Executive Summary
- 1.1 Market overview
- Executive Summary - Chart on Market Overview
- Executive Summary - Data Table on Market Overview
- Executive Summary - Chart on Global Market Characteristics
- Executive Summary - Chart on Market by Geography
- Executive Summary - Chart on Market Segmentation by Product
- Executive Summary - Chart on Market Segmentation by Application
- Executive Summary - Chart on Incremental Growth
- Executive Summary - Data Table on Incremental Growth
- Executive Summary - Chart on Company Market Positioning
2 Market Landscape
- 2.1 Market ecosystem
- Parent Market
- Data Table on - Parent Market
- 2.2 Market characteristics
- Market characteristics analysis
3 Market Sizing
- 3.1 Market definition
- Offerings of companies included in the market definition
- 3.2 Market segment analysis
- 3.4 Market outlook: Forecast for 2023-2028
- Chart on Global - Market size and forecast 2023-2028 ($ million)
- Data Table on Global - Market size and forecast 2023-2028 ($ million)
- Chart on Global Market: Year-over-year growth 2023-2028 (%)
- Data Table on Global Market: Year-over-year growth 2023-2028 (%)
4 Historic Market Size
- 4.1 Global Seaweed Market 2018 - 2022
- Historic Market Size - Data Table on Global Seaweed Market 2018 - 2022 ($ million)
- 4.2 Product segment analysis 2018 - 2022
- Historic Market Size - Product Segment 2018 - 2022 ($ million)
- 4.3 Application segment analysis 2018 - 2022
- Historic Market Size - Application Segment 2018 - 2022 ($ million)
- 4.4 Geography segment analysis 2018 - 2022
- Historic Market Size - Geography Segment 2018 - 2022 ($ million)
- 4.5 Country segment analysis 2018 - 2022
- Historic Market Size - Country Segment 2018 - 2022 ($ million)
5 Five Forces Analysis
- 5.1 Five forces summary
- Five forces analysis - Comparison between 2023 and 2028
- 5.2 Bargaining power of buyers
- Bargaining power of buyers - Impact of key factors 2023 and 2028
- 5.3 Bargaining power of suppliers
- Bargaining power of suppliers - Impact of key factors in 2023 and 2028
- 5.4 Threat of new entrants
- Threat of new entrants - Impact of key factors in 2023 and 2028
- 5.5 Threat of substitutes
- Threat of substitutes - Impact of key factors in 2023 and 2028
- 5.6 Threat of rivalry
- Threat of rivalry - Impact of key factors in 2023 and 2028
- 5.7 Market condition
- Chart on Market condition - Five forces 2023 and 2028
6 Market Segmentation by Product
- 6.1 Market segments
- Chart on Product - Market share (2023-2028) (%)
- Data Table on Product - Market share (2023-2028) (%)
- 6.2 Comparison by Product
- Chart on Comparison by Product
- Data Table on Comparison by Product
- 6.3 Red seaweed - Market size and forecast (2023-2028)
- Chart on Red seaweed - Market size and forecast (2023-2028) ($ million)
- Data Table on Red seaweed - Market size and forecast (2023-2028) ($ million)
- Chart on Red seaweed - Year-over-year growth (2023-2028) (%)
- Data Table on Red seaweed - Year-over-year growth (2023-2028) (%)
- 6.4 Brown seaweed - Market size and forecast (2023-2028)
- Chart on Brown seaweed - Market size and forecast (2023-2028) ($ million)
- Data Table on Brown seaweed - Market size and forecast (2023-2028) ($ million)
- Chart on Brown seaweed - Year-over-year growth (2023-2028) (%)
- Data Table on Brown seaweed - Year-over-year growth (2023-2028) (%)
- 6.5 Green seaweed - Market size and forecast (2023-2028)
- Chart on Green seaweed - Market size and forecast (2023-2028) ($ million)
- Data Table on Green seaweed - Market size and forecast (2023-2028) ($ million)
- Chart on Green seaweed - Year-over-year growth (2023-2028) (%)
- Data Table on Green seaweed - Year-over-year growth (2023-2028) (%)
- 6.6 Market opportunity by Product
- Market opportunity by Product ($ million)
- Data Table on Market opportunity by Product ($ million)
7 Market Segmentation by Application
- 7.1 Market segments
- Chart on Application - Market share (2023-2028) (%)
- Data Table on Application - Market share (2023-2028) (%)
- 7.2 Comparison by Application
- Chart on Comparison by Application
- Data Table on Comparison by Application
- 7.3 Agriculture - Market size and forecast (2023-2028)
- Chart on Agriculture - Market size and forecast (2023-2028) ($ million)
- Data Table on Agriculture - Market size and forecast (2023-2028) ($ million)
- Chart on Agriculture - Year-over-year growth (2023-2028) (%)
- Data Table on Agriculture - Year-over-year growth (2023-2028) (%)
- 7.4 Animal feed - Market size and forecast (2023-2028)
- Chart on Animal feed - Market size and forecast (2023-2028) ($ million)
- Data Table on Animal feed - Market size and forecast (2023-2028) ($ million)
- Chart on Animal feed - Year-over-year growth (2023-2028) (%)
- Data Table on Animal feed - Year-over-year growth (2023-2028) (%)
- 7.5 Human food - Market size and forecast (2023-2028)
- Chart on Human food - Market size and forecast (2023-2028) ($ million)
- Data Table on Human food - Market size and forecast (2023-2028) ($ million)
- Chart on Human food - Year-over-year growth (2023-2028) (%)
- Data Table on Human food - Year-over-year growth (2023-2028) (%)
- 7.6 Market opportunity by Application
- Market opportunity by Application ($ million)
- Data Table on Market opportunity by Application ($ million)
8 Market Segmentation by Form
- 8.1 Market segments
- Chart on Form - Market share (2023-2028) (%)
- Data Table on Form - Market share (2023-2028) (%)
- 8.2 Comparison by Form
- Chart on Comparison by Form
- Data Table on Comparison by Form
- 8.3 Whole - Market size and forecast (2023-2028)
- Chart on Whole - Market size and forecast (2023-2028) ($ million)
- Data Table on Whole - Market size and forecast (2023-2028) ($ million)
- Chart on Whole - Year-over-year growth (2023-2028) (%)
- Data Table on Whole - Year-over-year growth (2023-2028) (%)
- 8.4 Flakes - Market size and forecast (2023-2028)
- Chart on Flakes - Market size and forecast (2023-2028) ($ million)
- Data Table on Flakes - Market size and forecast (2023-2028) ($ million)
- Chart on Flakes - Year-over-year growth (2023-2028) (%)
- Data Table on Flakes - Year-over-year growth (2023-2028) (%)
- 8.5 Powder - Market size and forecast (2023-2028)
- Chart on Powder - Market size and forecast (2023-2028) ($ million)
- Data Table on Powder - Market size and forecast (2023-2028) ($ million)
- Chart on Powder - Year-over-year growth (2023-2028) (%)
- Data Table on Powder - Year-over-year growth (2023-2028) (%)
- 8.6 Extracts (Hydrocolloids: Agar, Alginate, Carrageenan) - Market size and forecast (2023-2028)
- Chart on Extracts (Hydrocolloids: Agar, Alginate, Carrageenan) - Market size and forecast (2023-2028) ($ million)
- Data Table on Extracts (Hydrocolloids: Agar, Alginate, Carrageenan) - Market size and forecast (2023-2028) ($ million)
- Chart on Extracts (Hydrocolloids: Agar, Alginate, Carrageenan) - Year-over-year growth (2023-2028) (%)
- Data Table on Extracts (Hydrocolloids: Agar, Alginate, Carrageenan) - Year-over-year growth (2023-2028) (%)
- 8.7 Oil - Market size and forecast (2023-2028)
- Chart on Oil - Market size and forecast (2023-2028) ($ million)
- Data Table on Oil - Market size and forecast (2023-2028) ($ million)
- Chart on Oil - Year-over-year growth (2023-2028) (%)
- Data Table on Oil - Year-over-year growth (2023-2028) (%)
- 8.8 Market opportunity by Form
- Market opportunity by Form ($ million)
- Data Table on Market opportunity by Form ($ million)
9 Market Segmentation by Cultivation Method
- 9.1 Market segments
- Chart on Cultivation Method - Market share (2023-2028) (%)
- Data Table on Cultivation Method - Market share (2023-2028) (%)
- 9.2 Comparison by Cultivation Method
- Chart on Comparison by Cultivation Method
- Data Table on Comparison by Cultivation Method
- 9.3 Aquaculture/Cultivated Seaweed - Market size and forecast (2023-2028)
- Chart on Aquaculture/Cultivated Seaweed - Market size and forecast (2023-2028) ($ million)
- Data Table on Aquaculture/Cultivated Seaweed - Market size and forecast (2023-2028) ($ million)
- Chart on Aquaculture/Cultivated Seaweed - Year-over-year growth (2023-2028) (%)
- Data Table on Aquaculture/Cultivated Seaweed - Year-over-year growth (2023-2028) (%)
- 9.4 Wild Harvested Seaweed - Market size and forecast (2023-2028)
- Chart on Wild Harvested Seaweed - Market size and forecast (2023-2028) ($ million)
- Data Table on Wild Harvested Seaweed - Market size and forecast (2023-2028) ($ million)
- Chart on Wild Harvested Seaweed - Year-over-year growth (2023-2028) (%)
- Data Table on Wild Harvested Seaweed - Year-over-year growth (2023-2028) (%)
- 9.5 Market opportunity by Cultivation Method
- Market opportunity by Cultivation Method ($ million)
- Data Table on Market opportunity by Cultivation Method ($ million)
10 Market Segmentation by End-use Industry
- 10.1 Market segments
- Chart on End-use Industry - Market share (2023-2028) (%)
- Data Table on End-use Industry - Market share (2023-2028) (%)
- 10.2 Comparison by End-use Industry
- Chart on Comparison by End-use Industry
- Data Table on Comparison by End-use Industry
- 10.3 Food Industry - Market size and forecast (2023-2028)
- Chart on Food Industry - Market size and forecast (2023-2028) ($ million)
- Data Table on Food Industry - Market size and forecast (2023-2028) ($ million)
- Chart on Food Industry - Year-over-year growth (2023-2028) (%)
- Data Table on Food Industry - Year-over-year growth (2023-2028) (%)
- 10.4 Feed Industry - Market size and forecast (2023-2028)
- Chart on Feed Industry - Market size and forecast (2023-2028) ($ million)
- Data Table on Feed Industry - Market size and forecast (2023-2028) ($ million)
- Chart on Feed Industry - Year-over-year growth (2023-2028) (%)
- Data Table on Feed Industry - Year-over-year growth (2023-2028) (%)
- 10.5 Pharmaceutical Industry - Market size and forecast (2023-2028)
- Chart on Pharmaceutical Industry - Market size and forecast (2023-2028) ($ million)
- Data Table on Pharmaceutical Industry - Market size and forecast (2023-2028) ($ million)
- Chart on Pharmaceutical Industry - Year-over-year growth (2023-2028) (%)
- Data Table on Pharmaceutical Industry - Year-over-year growth (2023-2028) (%)
- 10.6 Cosmetic Industry - Market size and forecast (2023-2028)
- Chart on Cosmetic Industry - Market size and forecast (2023-2028) ($ million)
- Data Table on Cosmetic Industry - Market size and forecast (2023-2028) ($ million)
- Chart on Cosmetic Industry - Year-over-year growth (2023-2028) (%)
- Data Table on Cosmetic Industry - Year-over-year growth (2023-2028) (%)
- 10.7 Agriculture Industry - Market size and forecast (2023-2028)
- Chart on Agriculture Industry - Market size and forecast (2023-2028) ($ million)
- Data Table on Agriculture Industry - Market size and forecast (2023-2028) ($ million)
- Chart on Agriculture Industry - Year-over-year growth (2023-2028) (%)
- Data Table on Agriculture Industry - Year-over-year growth (2023-2028) (%)
- 10.8 Other Industries - Market size and forecast (2023-2028)
- Chart on Other Industries - Market size and forecast (2023-2028) ($ million)
- Data Table on Other Industries - Market size and forecast (2023-2028) ($ million)
- Chart on Other Industries - Year-over-year growth (2023-2028) (%)
- Data Table on Other Industries - Year-over-year growth (2023-2028) (%)
- 10.9 Market opportunity by End-use Industry
- Market opportunity by End-use Industry ($ million)
- Data Table on Market opportunity by End-use Industry ($ million)
11 Customer Landscape
- 11.1 Customer landscape overview
- Analysis of price sensitivity, lifecycle, customer purchase basket, adoption rates, and purchase criteria
12 Geographic Landscape
- 12.1 Geographic segmentation
- Chart on Market share by geography 2023-2028 (%)
- Data Table on Market share by geography 2023-2028 (%)
- 12.2 Geographic comparison
- Chart on Geographic comparison
- Data Table on Geographic comparison
- 12.3 APAC - Market size and forecast 2023-2028
- Chart on APAC - Market size and forecast 2023-2028 ($ million)
- Data Table on APAC - Market size and forecast 2023-2028 ($ million)
- Chart on APAC - Year-over-year growth 2023-2028 (%)
- Data Table on APAC - Year-over-year growth 2023-2028 (%)
- 12.4 Europe - Market size and forecast 2023-2028
- Chart on Europe - Market size and forecast 2023-2028 ($ million)
- Data Table on Europe - Market size and forecast 2023-2028 ($ million)
- Chart on Europe - Year-over-year growth 2023-2028 (%)
- Data Table on Europe - Year-over-year growth 2023-2028 (%)
- 12.5 North America - Market size and forecast 2023-2028
- Chart on North America - Market size and forecast 2023-2028 ($ million)
- Data Table on North America - Market size and forecast 2023-2028 ($ million)
- Chart on North America - Year-over-year growth 2023-2028 (%)
- Data Table on North America - Year-over-year growth 2023-2028 (%)
- 12.6 South America - Market size and forecast 2023-2028
- Chart on South America - Market size and forecast 2023-2028 ($ million)
- Data Table on South America - Market size and forecast 2023-2028 ($ million)
- Chart on South America - Year-over-year growth 2023-2028 (%)
- Data Table on South America - Year-over-year growth 2023-2028 (%)
- 12.7 Middle East and Africa - Market size and forecast 2023-2028
- Chart on Middle East and Africa - Market size and forecast 2023-2028 ($ million)
- Data Table on Middle East and Africa - Market size and forecast 2023-2028 ($ million)
- Chart on Middle East and Africa - Year-over-year growth 2023-2028 (%)
- Data Table on Middle East and Africa - Year-over-year growth 2023-2028 (%)
- 12.8 China - Market size and forecast 2023-2028
- Chart on China - Market size and forecast 2023-2028 ($ million)
- Data Table on China - Market size and forecast 2023-2028 ($ million)
- Chart on China - Year-over-year growth 2023-2028 (%)
- Data Table on China - Year-over-year growth 2023-2028 (%)
- 12.9 Indonesia - Market size and forecast 2023-2028
- Chart on Indonesia - Market size and forecast 2023-2028 ($ million)
- Data Table on Indonesia - Market size and forecast 2023-2028 ($ million)
- Chart on Indonesia - Year-over-year growth 2023-2028 (%)
- Data Table on Indonesia - Year-over-year growth 2023-2028 (%)
- 12.10 Japan - Market size and forecast 2023-2028
- Chart on Japan - Market size and forecast 2023-2028 ($ million)
- Data Table on Japan - Market size and forecast 2023-2028 ($ million)
- Chart on Japan - Year-over-year growth 2023-2028 (%)
- Data Table on Japan - Year-over-year growth 2023-2028 (%)
- 12.11 US - Market size and forecast 2023-2028
- Chart on US - Market size and forecast 2023-2028 ($ million)
- Data Table on US - Market size and forecast 2023-2028 ($ million)
- Chart on US - Year-over-year growth 2023-2028 (%)
- Data Table on US - Year-over-year growth 2023-2028 (%)
- 12.12 South Korea - Market size and forecast 2023-2028
- Chart on South Korea - Market size and forecast 2023-2028 ($ million)
- Data Table on South Korea - Market size and forecast 2023-2028 ($ million)
- Chart on South Korea - Year-over-year growth 2023-2028 (%)
- Data Table on South Korea - Year-over-year growth 2023-2028 (%)
- 12.13 Market opportunity by geography
- Market opportunity by geography ($ million)
- Data Tables on Market opportunity by geography ($ million)
- 12.14 Canada - Market size and forecast (2023-2028)
- Chart on Canada - Market size and forecast (2023-2028) ($ million)
- Data Table on Canada - Market size and forecast (2023-2028) ($ million)
- Chart on Canada - Year-over-year growth (2023-2028) (%)
- Data Table on Canada - Year-over-year growth (2023-2028) (%)
- 12.15 Germany - Market size and forecast (2023-2028)
- Chart on Germany - Market size and forecast (2023-2028) ($ million)
- Data Table on Germany - Market size and forecast (2023-2028) ($ million)
- Chart on Germany - Year-over-year growth (2023-2028) (%)
- Data Table on Germany - Year-over-year growth (2023-2028) (%)
- 12.16 UK - Market size and forecast (2023-2028)
- Chart on UK - Market size and forecast (2023-2028) ($ million)
- Data Table on UK - Market size and forecast (2023-2028) ($ million)
- Chart on UK - Year-over-year growth (2023-2028) (%)
- Data Table on UK - Year-over-year growth (2023-2028) (%)
- 12.17 Italy - Market size and forecast (2023-2028)
- Chart on Italy - Market size and forecast (2023-2028) ($ million)
- Data Table on Italy - Market size and forecast (2023-2028) ($ million)
- Chart on Italy - Year-over-year growth (2023-2028) (%)
- Data Table on Italy - Year-over-year growth (2023-2028) (%)
- 12.18 France - Market size and forecast (2023-2028)
- Chart on France - Market size and forecast (2023-2028) ($ million)
- Data Table on France - Market size and forecast (2023-2028) ($ million)
- Chart on France - Year-over-year growth (2023-2028) (%)
- Data Table on France - Year-over-year growth (2023-2028) (%)
- 12.19 India - Market size and forecast (2023-2028)
- Chart on India - Market size and forecast (2023-2028) ($ million)
- Data Table on India - Market size and forecast (2023-2028) ($ million)
- Chart on India - Year-over-year growth (2023-2028) (%)
- Data Table on India - Year-over-year growth (2023-2028) (%)
- 12.20 Brazil - Market size and forecast (2023-2028)
- Chart on Brazil - Market size and forecast (2023-2028) ($ million)
- Data Table on Brazil - Market size and forecast (2023-2028) ($ million)
- Chart on Brazil - Year-over-year growth (2023-2028) (%)
- Data Table on Brazil - Year-over-year growth (2023-2028) (%)
- 12.21 Egypt - Market size and forecast (2023-2028)
- Chart on Egypt - Market size and forecast (2023-2028) ($ million)
- Data Table on Egypt - Market size and forecast (2023-2028) ($ million)
- Chart on Egypt - Year-over-year growth (2023-2028) (%)
- Data Table on Egypt - Year-over-year growth (2023-2028) (%)
- 12.22 UAE - Market size and forecast (2023-2028)
- Chart on UAE - Market size and forecast (2023-2028) ($ million)
- Data Table on UAE - Market size and forecast (2023-2028) ($ million)
- Chart on UAE - Year-over-year growth (2023-2028) (%)
- Data Table on UAE - Year-over-year growth (2023-2028) (%)
- 12.23 Oman - Market size and forecast (2023-2028)
- Chart on Oman - Market size and forecast (2023-2028) ($ million)
- Data Table on Oman - Market size and forecast (2023-2028) ($ million)
- Chart on Oman - Year-over-year growth (2023-2028) (%)
- Data Table on Oman - Year-over-year growth (2023-2028) (%)
- 12.24 Argentina - Market size and forecast (2023-2028)
- Chart on Argentina - Market size and forecast (2023-2028) ($ million)
- Data Table on Argentina - Market size and forecast (2023-2028) ($ million)
- Chart on Argentina - Year-over-year growth (2023-2028) (%)
- Data Table on Argentina - Year-over-year growth (2023-2028) (%)
- 12.25 KSA - Market size and forecast (2023-2028)
- Chart on KSA - Market size and forecast (2023-2028) ($ million)
- Data Table on KSA - Market size and forecast (2023-2028) ($ million)
- Chart on KSA - Year-over-year growth (2023-2028) (%)
- Data Table on KSA - Year-over-year growth (2023-2028) (%)
- 12.26 Rest of World (ROW) - Market size and forecast (2023-2028)
- Chart on Rest of World (ROW) - Market size and forecast (2023-2028) ($ million)
- Data Table on Rest of World (ROW) - Market size and forecast (2023-2028) ($ million)
- Chart on Rest of World (ROW) - Year-over-year growth (2023-2028) (%)
- Data Table on Rest of World (ROW) - Year-over-year growth (2023-2028) (%)
13 Drivers, Challenges, and Opportunity/Restraints
- 13.3 Impact of drivers and challenges
- Impact of drivers and challenges in 2023 and 2028
- 13.4 Market opportunities/restraints
14 Competitive Landscape
- 14.2 Competitive Landscape
- Overview on criticality of inputs and factors of differentiation
- 14.3 Landscape disruption
- Overview on factors of disruption
- 14.4 Industry risks
- Impact of key risks on business
15 Competitive Analysis
- 15.2 Market positioning of companies
- Matrix on companies position and classification
- 15.3 Acadian Seaplants Ltd.
- Acadian Seaplants Ltd. - Overview
- Acadian Seaplants Ltd. - Product / Service
- Acadian Seaplants Ltd. - Key news
- Acadian Seaplants Ltd. - Key offerings
- 15.4 Beijing Leili Agricultural Co. Ltd
- Beijing Leili Agricultural Co. Ltd - Overview
- Beijing Leili Agricultural Co. Ltd - Product / Service
- Beijing Leili Agricultural Co. Ltd - Key offerings
- 15.5 Biostadt India Ltd.
- Biostadt India Ltd. - Overview
- Biostadt India Ltd. - Product / Service
- Biostadt India Ltd. - Key offerings
- 15.6 Branded Garden Products Ltd.
- Branded Garden Products Ltd. - Overview
- Branded Garden Products Ltd. - Product / Service
- Branded Garden Products Ltd. - Key offerings
- 15.7 BRANDT Inc.
- BRANDT Inc. - Overview
- BRANDT Inc. - Product / Service
- BRANDT Inc. - Key offerings
- 15.8 Cargill Inc.
- Cargill Inc. - Overview
- Cargill Inc. - Product / Service
- Cargill Inc. - Key news
- Cargill Inc. - Key offerings
- 15.9 Compagnie Financiere et de Participations Roullier
- Compagnie Financiere et de Participations Roullier - Overview
- Compagnie Financiere et de Participations Roullier - Product / Service
- Compagnie Financiere et de Participations Roullier - Key news
- Compagnie Financiere et de Participations Roullier - Key offerings
- 15.10 COMPO EXPERT GmbH
- COMPO EXPERT GmbH - Overview
- COMPO EXPERT GmbH - Product / Service
- COMPO EXPERT GmbH - Key offerings
- 15.11 Corbion nv
- Corbion nv - Overview
- Corbion nv - Business segments
- Corbion nv - Key news
- Corbion nv - Key offerings
- Corbion nv - Segment focus
- 15.12 DuluxGroup Australia Pty Ltd.
- DuluxGroup Australia Pty Ltd. - Overview
- DuluxGroup Australia Pty Ltd. - Product / Service
- DuluxGroup Australia Pty Ltd. - Key offerings
- 15.13 DuPont de Nemours Inc.
- DuPont de Nemours Inc. - Overview
- DuPont de Nemours Inc. - Business segments
- DuPont de Nemours Inc. - Key news
- DuPont de Nemours Inc. - Key offerings
- DuPont de Nemours Inc. - Segment focus
- 15.14 Gelymar SA
- Gelymar SA - Overview
- Gelymar SA - Product / Service
- Gelymar SA - Key offerings
- 15.15 Irish Seaweeds
- Irish Seaweeds - Overview
- Irish Seaweeds - Product / Service
- Irish Seaweeds - Key offerings
- 15.16 J M Huber Corp.
- J M Huber Corp. - Overview
- J M Huber Corp. - Product / Service
- J M Huber Corp. - Key news
- J M Huber Corp. - Key offerings
- 15.17 Ocean Harvest Technology Ltd.
- Ocean Harvest Technology Ltd. - Overview
- Ocean Harvest Technology Ltd. - Product / Service
- Ocean Harvest Technology Ltd. - Key offerings
16 Appendix
- 16.2 Inclusions and exclusions checklist
- Inclusions checklist
- Exclusions checklist
- 16.3 Currency conversion rates for US$
- Currency conversion rates for US$
- 16.4 Research methodology
- 16.7 Validation techniques employed for market sizing
- Validation techniques employed for market sizing
- 16.9 360 degree market analysis
- 360 degree market analysis
- 16.10 List of abbreviations