Marine Biopolymer Market Analysis APAC, North America, Europe, South America, Middle East and Africa - US, China, Japan, Germany, UK - Size and Forecast 2024-2028

Marine Biopolymer Market Analysis APAC, North America, Europe, South America, Middle East and Africa - US, China, Japan, Germany, UK - Size and Forecast 2024-2028

Published: Aug 2024 189 Pages SKU: IRTNTR76303

Market Overview at a Glance

$1.90 B
Market Opportunity
10.87%
CAGR
9.53
YoY growth 2023-2024(%)

Marine Biopolymer Market Size 2024-2028 

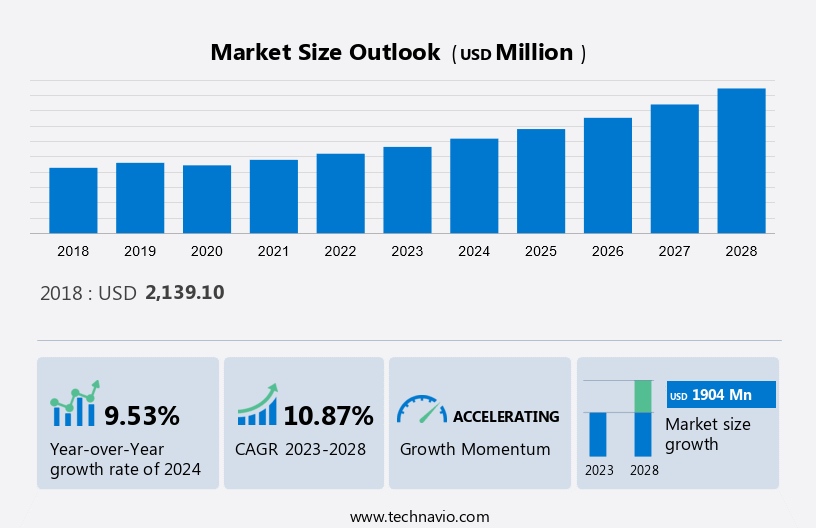
The marine biopolymer market size is forecast to increase by USD 1.90 billion, at a CAGR of 10.87% between 2023 and 2028.  The market is experiencing significant growth, driven by several key factors. Firstly, the emergence of new applications in various end-user industries is fueling market expansion. Secondly, the increasing demand for sustainable bioplastic packaging solutions, particularly from the food and beverage sector, is a major growth catalyst. Lastly, the growing focus on eco-friendly and renewable polymer solutions is propelling the market forward. These trends are expected to continue, making the Marine Biopolymer Market an attractive investment opportunity for businesses seeking to reduce their carbon footprint and meet the demands of environmentally-conscious consumers.

What will be the size of the Marine Biopolymer Market During the Forecast Period?

Marine Biopolymer Market Size

To learn more about this report, View Report Sample

Market Dynamics

 In the realm of sustainable and eco-friendly materials, plant-based resources have emerged as a promising alternative to traditional petroleum-derived products. These materials, sourced from Agriculture, include Wood and Lumber, Sugar Cane, Maize, and Rubbers. The agricultural sector provides a wealth of raw materials for the production of Bio-based Polyesters, such as Polylactic Acid (PLA), Polyhydroxy butyrate (PHB), and Polybutylene succinate. PLA, derived from Corn and Sugar Cane, is a popular biodegradable polyester used in various industries, including Foods and Nutraceuticals, due to its biocompatibility and edibility. Melanin and Cutin, natural pigments and protective coatings found in plants, have gained attention for their potential use in Medicine and Research Tools. Moreover, plant-based materials offer opportunities in New Energy Sources, such as the production of Bio-based Polyesters like Polyesters and Polyhydroxy alkanoate (PHA) derivatives, which can replace fossil fuel-based polymers in various applications. Agriculture, as a whole, plays a crucial role in the production and utilization of these plant-derived materials, providing a sustainable and renewable source for a wide range of industries.

Key Marine Biopolymer Market Driver

Increasing demand for bioplastic packaging from the food and beverage industry is the key factor driving the growth of the market.  The two most important aspects of food packaging are to preserve its quality and to ensure that it is bacteriologically safe. In terms of biodegradability, recycling ability, biocompatibility, and reusability, plastic packaging has limitations, which has led to a rise in the popularity of biodegradable packaging.

Moreover, bioplastics can be made from biocompatible, renewable, and sometimes cheaper biopolymers. Furthermore, much research is underway trying to meet consumer demand for such packaging, which, together with global environmental legislation, is driving the creation of new and sustainable food packaging materials. Hence, the growing demand for bioplastic packaging from the food and beverage industry will boost the growth of the market during the forecast period.

Significant Marine Biopolymer Market Trends

Increasing application of marine biopolymers in theranostic applications is the primary trend in the market. Theranostics is a combination of terms used to describe medicines and diagnostics. Recently, marine biopolymers have been extensively applied in the production of nanomaterials for biomedical applications as a result of their significant properties such as biodegradability and biocompatibility. For example, polymeric nano particles have been helpful in the detection and treatment of numerous types of cancer because they are biocompatible with medicinal products as well as immunotherapies.

Furthermore, new nanoparticles are being developed coated with marine biopolymers to combine therapeutic and diagnostic (therapeutic) applications due to their highly improved absorption and scattering properties in the NIR regions. Hence, the rising use of marine biopolymers in therapeutic applications will fuel the growth of the global marine biopolymers market during the forecast period.

Major Marine Biopolymer Market Challenge

Difficulties related to the production of marine biopolymers is a challenge that affects the growth of the market. Acid and alkali treatments are chemical steps in the production of marine biopolymers, which are hazardous to the environment. To address these limitations, ultrasonic and microwave technology should be used instead of traditional chemical and enzymatic processes, which further increases the cost of producing marine biopolymers.

Furthermore, one of the main problems with the production of biopolymers is the non-standardized nature of the production technology, which is still in its development stage. Hence, such difficulties in the production of marine biopolymers will impede the growth of the mentioned market during the forecast period. 

Marine Biopolymer Market Customer Landscape

The market research report includes the adoption lifecycle of the market, covering from the innovator’s stage to the laggard’s stage. It focuses on adoption rates in different regions based on penetration. Furthermore, the report also includes key purchase criteria and drivers of price sensitivity to help companies evaluate and develop their growth strategies.

Marine Biopolymer Market Share by Geography

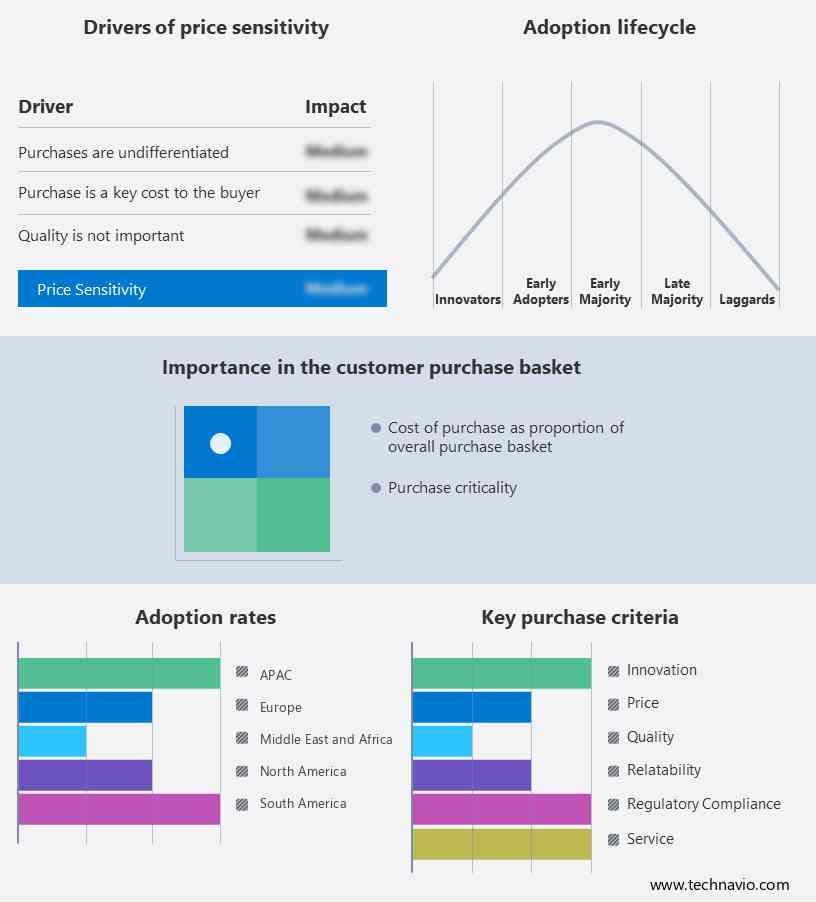
Global Marine Biopolymer Market Customer Landscape

Who are the Major Marine Biopolymer Market Companies?

Companies are implementing various strategies, such as strategic alliances, partnerships, mergers and acquisitions, geographical expansion, and product/service launches, to enhance their presence in the market.

Acadian Seaplants Ltd.: The company offers marine biopolymer for use in the nutraceutical and medical markets.

The research report also includes detailed analyses of the competitive landscape of the market and information about 20 market companies, including:

  • Arkema Group
  • BASF SE
  • Bio on SpA
  • Biome Bioplastics Ltd.
  • Cargill Inc.
  • Corbion nv
  • Danimer Scientific Inc.
  • Givaudan SA
  • Ingredion Inc.
  • J M Huber Corp.
  • Koninklijke DSM NV
  • Marinova Pty Ltd.
  • Mitsubishi Chemical Corp.
  • Novamont S.p.A.
  • Oceanium Ltd.
  • Rodenburg Biopolymers B.V.
  • Seagarden AS
  • Seaweed Solutions AS
  • Tate and Lyle PLC

Qualitative and quantitative analysis of companies has been conducted to help clients understand the wider business environment as well as the strengths and weaknesses of key market players. Data is qualitatively analyzed to categorize companies as pure play, category-focused, industry-focused, and diversified; it is quantitatively analyzed to categorize companies as dominant, leading, strong, tentative, and weak.

What are the Largest-Growing Segments in the Marine Biopolymer Market?

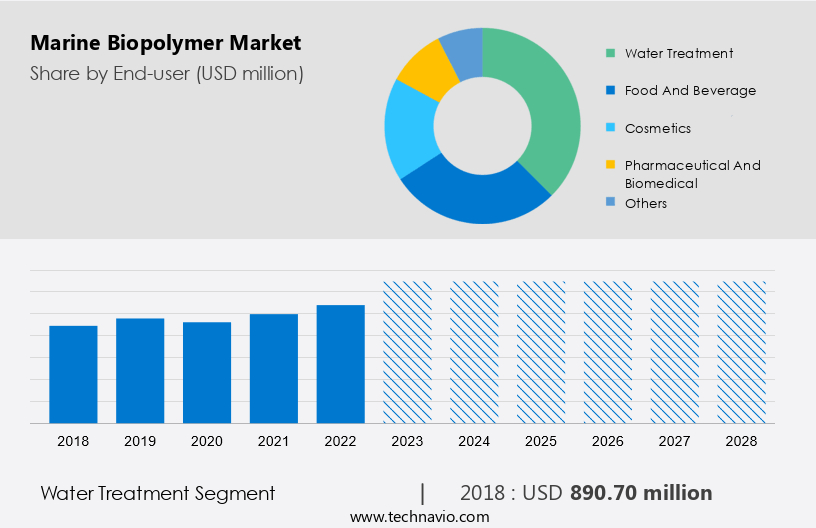
The water treatment segment is estimated to witness significant growth during the forecast period. For the removal of metal ions, organic dyes, and oils from industrial wastewater it is advisable to use biological biopolymers and their derivatives. These materials are capable of providing a possible replacement for petroleum-derived materials in the treatment of wastewater. The biopolymers of the sea have a number of characteristics, including excellent biodegradability, hydrophilicity, biocompatibility, and nontoxicity.

Marine Biopolymer Market Size

Get a glance at the market contribution of various segments View the PDF Sample

The water treatment segment was the largest segment and was valued at USD 890.70 million in 2018With the growing concern about toxic chemical discharge and toxic metal pollution due to rapid industrialization and modernization, the demand for biopolymers, such as marine biopolymers is increasing to treat wastewater. Marine biopolymers also remove high concentrations of zinc and copper from wastewater. The production of water treatment methods is increasing from end-use industries, such as pulp and paper, dairy, metals and chemicals, dyes and pigments, and textiles, as well as the need to treatment os wastewater will drive demand for marine biopolymers during the forecast period.

Which are the Key Regions for the Marine Biopolymer Market?

Marine Biopolymer Market Share by Geography

For more insights on the market share of various regions Download PDF Sample now!

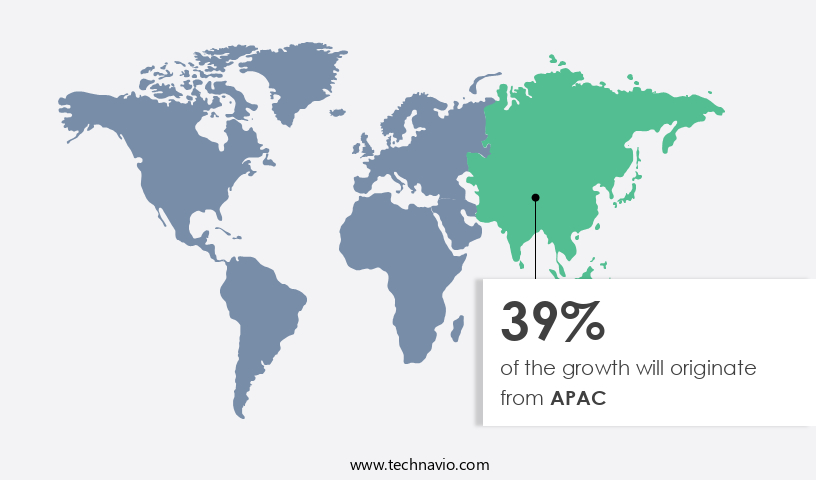
APAC is estimated to contribute 39% to the growth of the global market during the forecast period. Technavio’s analysts have elaborately explained the regional trends and drivers that shape the market during the forecast period. Growing demand for food and beverage products, pharmaceuticals and biomedicines, and cosmetics is driving the growth of the market in the region. APAC is the largest producer of marine biopolymers and derivatives due to the abundant availability of raw materials such as shrimp and crab in China, Vietnam, Japan, and Thailand.

Moreover, the high acceptance rate of marine biopolymers, especially in the wastewater treatment and cosmetics industries, is the main reason for the increasing demand for marine biopolymers in APAC. Furthermore, due to low-cost labor and favorable government policies and investments, the APAC region has become the largest producer of food and beverages such as fresh meat. Therefore, such investments in the food and beverage sector will further increase the demand for bio-based packaging solutions in the region, driving the growth of the APAC marine biopolymer market during the forecast period.

Segment Overview

The market research report provides comprehensive data (region wise segment analysis), with forecasts and estimates in "USD Million" for the period 2024 to 2028, as well as historical data from 2018 to 2022 for the following segments.

  • End-user Outlook
    • Water treatment
    • Food and beverage
    • Cosmetics
    • Pharmaceutical and biomedical
    • Others
  • Source Outlook
    • Shrimps
    • Prawns
    • Crabs
    • Others
  • Region Outlook
    • North America
      • The U.S.
      • Canada
    • Europe
      • U.K.
      • Germany
      • France
      • Rest of Europe
    • APAC
      • China
      • India
    • South America
      • Chile 
      • Brazil 
      • Argentina
    • Middle East & Africa
      • Saudi Arabia
      • South Africa
      • Rest of the Middle East & Africa

You may also interested in below market reports:

1. Marine Biotechnology Market Analysis North America, Europe, Asia, Rest of World (ROW) - US, China, UK, Germany, Japan - Size and Forecast

2. Biopolymers Market by End-user, Type, and Geography - Forecast and Analysis

3. Polyhydroxyalkanoate Market Analysis APAC, Europe, North America, South America, Middle East and Africa - US, China, Japan, India, Germany - Size and Forecast

Market Analyst Overview

 In the ever-evolving world of materials science, the agricultural sector is making significant strides in the production of renewable raw materials for various industries. These raw materials, including Cutan, Suberin, Lignin, and plant materials, are increasingly being utilized as waste products from Animal waste and Human waste, as well as from the processing of Agricultural products. Lawmakers and Automakers are recognizing the potential of these biodegradable polymers, derived from agricultural sources, as a sustainable alternative to petroleum-based polymers. Thermoplastics made from Kelp, Starch, Polysaccharides, and other plant-derived sources are being used in the manufacturing of Films, Bottles, Fibers, Seed Coatings, and Vehicle Components. Moreover, the use of biodegradable polymers in Medical Implants, Consumer Goods, and Automotive & Transportation sectors is on the rise. Bio-based polymers are not only eco-friendly but also offer improved Mechanical and optical properties, Shelf-life, and Food safety.

Moreover, the processing technologies for these polymers include Extrusion, Injection, Melt compounding, and Molding process. The end-use industries range from Fresh Food, Bakery, and Frozen Food to Dairy Products, Confectionery, Alcoholic Beverages, and Non-alcoholic Beverages. In the Medical & Healthcare sector, these polymers are used in Wound dressings, Hydrogels, and Chitosan, Alginate, Gelatin, and Pectin. The shift towards green initiatives and consumer lifestyle changes has led to a reduction in Greenhouse gas emissions and Environmental restrictions in traditional plastics industries. The future of Polysaccharide Polymers lies in their potential applications in Circuit Boards, Insulators, Laminates, End-use Industry, and even in Replacement joints and Heart valves. In conclusion, the Agriculture & Horticulture sector is playing a crucial role in the production of renewable raw materials, which are being utilized in various industries to reduce reliance on petroleum-based polymers, minimize Greenhouse gas emissions, and meet the demands of a sustainable future.

Market Scope

Report Coverage

Details

Page number

189

Base year

2023

Historic period

2018 - 2022

Forecast period

2024-2028

Growth momentum & CAGR

Accelerate at a CAGR of 10.87%

Market growth 2024-2028

USD 1.90 billion

Market structure

Fragmented

YoY growth 2023-2024(%)

9.53

Regional analysis

APAC, North America, Europe, South America, and Middle East and Africa

Performing market contribution

APAC at 39%

Key countries

US, China, Japan, Germany, and UK

Competitive landscape

Leading Companies, Market Positioning of Companies, Competitive Strategies, and Industry Risks

Key companies profiled

Acadian Seaplants Ltd., Arkema SA, BASF SE, Bio on SpA, Biome Bioplastics Ltd., Cargill Inc., Corbion nv, Danimer Scientific Inc., Givaudan SA, Ingredion Inc., J M Huber Corp., Koninklijke DSM NV, Marinova Pty Ltd., Mitsubishi Chemical Corp., Novamont S.p.A., Oceanium Ltd., Rodenburg Biopolymers B.V., Seagarden AS, Seaweed Solutions AS, and Tate and Lyle PLC

Market dynamics

Parent market analysis, Market forecasting growth inducers and obstacles, Fast-growing and slow-growing segment analysis, Market growth and Forecasting, COVID 19 impact and recovery analysis and future consumer dynamics, Market condition analysis for forecast period

Customization purview

If our market report has not included the data that you are looking for, you can reach out to our analysts and get segments customized.

View PDF Sample

What are the Key Data Covered in this Market Forecast Report?

  • CAGR of the market during the forecast period
  • Detailed information on factors that will drive the market growth and forecasting of the market between 2024 and 2028
  • Precise estimation of the market size and its contribution to the parent market
  • Accurate predictions about upcoming market trends and analysis and changes in consumer behavior
  • Growth of the market across Europe, North America, APAC, South America, and Middle East and Africa
  • Thorough market growth analysis of the market’s competitive landscape and detailed information about companies
  • Comprehensive market analysis and report on the factors that will challenge the market research and growth of market companies

We can help! Our analysts can customize this market research report to meet your requirements. 

Get in touch

1 Executive Summary

  • 1.1 Market overview
    • Executive Summary - Chart on Market Overview
    • Executive Summary - Data Table on Market Overview
    • Executive Summary - Chart on Global Market Characteristics
    • Executive Summary - Chart on Market by Geography
    • Executive Summary - Chart on Market Segmentation by End-user
    • Executive Summary - Chart on Market Segmentation by Source
    • Executive Summary - Chart on Incremental Growth
    • Executive Summary - Data Table on Incremental Growth
    • Executive Summary - Chart on Company Market Positioning

2 Market Landscape

  • 2.1 Market ecosystem
    • Parent Market
    • Data Table on - Parent Market
  • 2.2 Market characteristics
    • Market characteristics analysis
  • 2.3 Value chain analysis
    • Value Chain Analysis

3 Market Sizing

  • 3.1 Market definition
    • Offerings of companies included in the market definition
  • 3.2 Market segment analysis
    • Market segments
  • 3.3 Market size 2023
    • 3.4 Market outlook: Forecast for 2023-2028
      • Chart on Global - Market size and forecast 2023-2028 ($ million)
      • Data Table on Global - Market size and forecast 2023-2028 ($ million)
      • Chart on Global Market: Year-over-year growth 2023-2028 (%)
      • Data Table on Global Market: Year-over-year growth 2023-2028 (%)

    4 Historic Market Size

    • 4.1 Global Marine Biopolymer Market 2018 - 2022
      • Historic Market Size - Data Table on Global Marine Biopolymer Market 2018 - 2022 ($ million)
    • 4.2 End-user segment analysis 2018 - 2022
      • Historic Market Size - End-user Segment 2018 - 2022 ($ million)
    • 4.3 Source segment analysis 2018 - 2022
      • Historic Market Size - Source Segment 2018 - 2022 ($ million)
    • 4.4 Geography segment analysis 2018 - 2022
      • Historic Market Size - Geography Segment 2018 - 2022 ($ million)
    • 4.5 Country segment analysis 2018 - 2022
      • Historic Market Size - Country Segment 2018 - 2022 ($ million)

    5 Five Forces Analysis

    • 5.1 Five forces summary
      • Five forces analysis - Comparison between 2023 and 2028
    • 5.2 Bargaining power of buyers
      • Bargaining power of buyers - Impact of key factors 2023 and 2028
    • 5.3 Bargaining power of suppliers
      • Bargaining power of suppliers - Impact of key factors in 2023 and 2028
    • 5.4 Threat of new entrants
      • Threat of new entrants - Impact of key factors in 2023 and 2028
    • 5.5 Threat of substitutes
      • Threat of substitutes - Impact of key factors in 2023 and 2028
    • 5.6 Threat of rivalry
      • Threat of rivalry - Impact of key factors in 2023 and 2028
    • 5.7 Market condition
      • Chart on Market condition - Five forces 2023 and 2028

    6 Market Segmentation by End-user

    • 6.1 Market segments
      • Chart on End-user - Market share 2023-2028 (%)
      • Data Table on End-user - Market share 2023-2028 (%)
    • 6.2 Comparison by End-user
      • Chart on Comparison by End-user
      • Data Table on Comparison by End-user
    • 6.3 Water treatment - Market size and forecast 2023-2028
      • Chart on Water treatment - Market size and forecast 2023-2028 ($ million)
      • Data Table on Water treatment - Market size and forecast 2023-2028 ($ million)
      • Chart on Water treatment - Year-over-year growth 2023-2028 (%)
      • Data Table on Water treatment - Year-over-year growth 2023-2028 (%)
    • 6.4 Food and beverage - Market size and forecast 2023-2028
      • Chart on Food and beverage - Market size and forecast 2023-2028 ($ million)
      • Data Table on Food and beverage - Market size and forecast 2023-2028 ($ million)
      • Chart on Food and beverage - Year-over-year growth 2023-2028 (%)
      • Data Table on Food and beverage - Year-over-year growth 2023-2028 (%)
    • 6.5 Cosmetics - Market size and forecast 2023-2028
      • Chart on Cosmetics - Market size and forecast 2023-2028 ($ million)
      • Data Table on Cosmetics - Market size and forecast 2023-2028 ($ million)
      • Chart on Cosmetics - Year-over-year growth 2023-2028 (%)
      • Data Table on Cosmetics - Year-over-year growth 2023-2028 (%)
    • 6.6 Pharmaceutical and biomedical - Market size and forecast 2023-2028
      • Chart on Pharmaceutical and biomedical - Market size and forecast 2023-2028 ($ million)
      • Data Table on Pharmaceutical and biomedical - Market size and forecast 2023-2028 ($ million)
      • Chart on Pharmaceutical and biomedical - Year-over-year growth 2023-2028 (%)
      • Data Table on Pharmaceutical and biomedical - Year-over-year growth 2023-2028 (%)
    • 6.7 Others - Market size and forecast 2023-2028
      • Chart on Others - Market size and forecast 2023-2028 ($ million)
      • Data Table on Others - Market size and forecast 2023-2028 ($ million)
      • Chart on Others - Year-over-year growth 2023-2028 (%)
      • Data Table on Others - Year-over-year growth 2023-2028 (%)
    • 6.8 Market opportunity by End-user
      • Market opportunity by End-user ($ million)
      • Data Table on Market opportunity by End-user ($ million)

    7 Market Segmentation by Source

    • 7.1 Market segments
      • Chart on Source - Market share 2023-2028 (%)
      • Data Table on Source - Market share 2023-2028 (%)
    • 7.2 Comparison by Source
      • Chart on Comparison by Source
      • Data Table on Comparison by Source
    • 7.3 Shrimps - Market size and forecast 2023-2028
      • Chart on Shrimps - Market size and forecast 2023-2028 ($ million)
      • Data Table on Shrimps - Market size and forecast 2023-2028 ($ million)
      • Chart on Shrimps - Year-over-year growth 2023-2028 (%)
      • Data Table on Shrimps - Year-over-year growth 2023-2028 (%)
    • 7.4 Prawns - Market size and forecast 2023-2028
      • Chart on Prawns - Market size and forecast 2023-2028 ($ million)
      • Data Table on Prawns - Market size and forecast 2023-2028 ($ million)
      • Chart on Prawns - Year-over-year growth 2023-2028 (%)
      • Data Table on Prawns - Year-over-year growth 2023-2028 (%)
    • 7.5 Crabs - Market size and forecast 2023-2028
      • Chart on Crabs - Market size and forecast 2023-2028 ($ million)
      • Data Table on Crabs - Market size and forecast 2023-2028 ($ million)
      • Chart on Crabs - Year-over-year growth 2023-2028 (%)
      • Data Table on Crabs - Year-over-year growth 2023-2028 (%)
    • 7.6 Others - Market size and forecast 2023-2028
      • Chart on Others - Market size and forecast 2023-2028 ($ million)
      • Data Table on Others - Market size and forecast 2023-2028 ($ million)
      • Chart on Others - Year-over-year growth 2023-2028 (%)
      • Data Table on Others - Year-over-year growth 2023-2028 (%)
    • 7.7 Market opportunity by Source
      • Market opportunity by Source ($ million)
      • Data Table on Market opportunity by Source ($ million)

    8 Customer Landscape

    • 8.1 Customer landscape overview
      • Analysis of price sensitivity, lifecycle, customer purchase basket, adoption rates, and purchase criteria

    9 Geographic Landscape

    • 9.1 Geographic segmentation
      • Chart on Market share by geography 2023-2028 (%)
      • Data Table on Market share by geography 2023-2028 (%)
    • 9.2 Geographic comparison
      • Chart on Geographic comparison
      • Data Table on Geographic comparison
    • 9.3 APAC - Market size and forecast 2023-2028
      • Chart on APAC - Market size and forecast 2023-2028 ($ million)
      • Data Table on APAC - Market size and forecast 2023-2028 ($ million)
      • Chart on APAC - Year-over-year growth 2023-2028 (%)
      • Data Table on APAC - Year-over-year growth 2023-2028 (%)
    • 9.4 North America - Market size and forecast 2023-2028
      • Chart on North America - Market size and forecast 2023-2028 ($ million)
      • Data Table on North America - Market size and forecast 2023-2028 ($ million)
      • Chart on North America - Year-over-year growth 2023-2028 (%)
      • Data Table on North America - Year-over-year growth 2023-2028 (%)
    • 9.5 Europe - Market size and forecast 2023-2028
      • Chart on Europe - Market size and forecast 2023-2028 ($ million)
      • Data Table on Europe - Market size and forecast 2023-2028 ($ million)
      • Chart on Europe - Year-over-year growth 2023-2028 (%)
      • Data Table on Europe - Year-over-year growth 2023-2028 (%)
    • 9.6 South America - Market size and forecast 2023-2028
      • Chart on South America - Market size and forecast 2023-2028 ($ million)
      • Data Table on South America - Market size and forecast 2023-2028 ($ million)
      • Chart on South America - Year-over-year growth 2023-2028 (%)
      • Data Table on South America - Year-over-year growth 2023-2028 (%)
    • 9.7 Middle East and Africa - Market size and forecast 2023-2028
      • Chart on Middle East and Africa - Market size and forecast 2023-2028 ($ million)
      • Data Table on Middle East and Africa - Market size and forecast 2023-2028 ($ million)
      • Chart on Middle East and Africa - Year-over-year growth 2023-2028 (%)
      • Data Table on Middle East and Africa - Year-over-year growth 2023-2028 (%)
    • 9.8 US - Market size and forecast 2023-2028
      • Chart on US - Market size and forecast 2023-2028 ($ million)
      • Data Table on US - Market size and forecast 2023-2028 ($ million)
      • Chart on US - Year-over-year growth 2023-2028 (%)
      • Data Table on US - Year-over-year growth 2023-2028 (%)
    • 9.9 China - Market size and forecast 2023-2028
      • Chart on China - Market size and forecast 2023-2028 ($ million)
      • Data Table on China - Market size and forecast 2023-2028 ($ million)
      • Chart on China - Year-over-year growth 2023-2028 (%)
      • Data Table on China - Year-over-year growth 2023-2028 (%)
    • 9.10 Japan - Market size and forecast 2023-2028
      • Chart on Japan - Market size and forecast 2023-2028 ($ million)
      • Data Table on Japan - Market size and forecast 2023-2028 ($ million)
      • Chart on Japan - Year-over-year growth 2023-2028 (%)
      • Data Table on Japan - Year-over-year growth 2023-2028 (%)
    • 9.11 Germany - Market size and forecast 2023-2028
      • Chart on Germany - Market size and forecast 2023-2028 ($ million)
      • Data Table on Germany - Market size and forecast 2023-2028 ($ million)
      • Chart on Germany - Year-over-year growth 2023-2028 (%)
      • Data Table on Germany - Year-over-year growth 2023-2028 (%)
    • 9.12 UK - Market size and forecast 2023-2028
      • Chart on UK - Market size and forecast 2023-2028 ($ million)
      • Data Table on UK - Market size and forecast 2023-2028 ($ million)
      • Chart on UK - Year-over-year growth 2023-2028 (%)
      • Data Table on UK - Year-over-year growth 2023-2028 (%)
    • 9.13 Market opportunity by geography
      • Market opportunity by geography ($ million)
      • Data Tables on Market opportunity by geography ($ million)

    10 Drivers, Challenges, and Opportunity/Restraints

    • 10.1 Market drivers
      • 10.2 Market challenges
        • 10.3 Impact of drivers and challenges
          • Impact of drivers and challenges in 2023 and 2028
        • 10.4 Market opportunities/restraints

          11 Competitive Landscape

          • 11.1 Overview
            • 11.2 Competitive Landscape
              • Overview on criticality of inputs and factors of differentiation
            • 11.3 Landscape disruption
              • Overview on factors of disruption
            • 11.4 Industry risks
              • Impact of key risks on business

            12 Competitive Analysis

            • 12.1 Companies profiled
              • Companies covered
            • 12.2 Market positioning of companies
              • Matrix on companies position and classification
            • 12.3 BASF SE
              • BASF SE - Overview
              • BASF SE - Business segments
              • BASF SE - Key news
              • BASF SE - Key offerings
              • BASF SE - Segment focus
            • 12.4 Bio on SpA
              • Bio on SpA - Overview
              • Bio on SpA - Product / Service
              • Bio on SpA - Key offerings
            • 12.5 Biome Bioplastics Ltd.
              • Biome Bioplastics Ltd. - Overview
              • Biome Bioplastics Ltd. - Product / Service
              • Biome Bioplastics Ltd. - Key offerings
            • 12.6 Cargill Inc.
              • Cargill Inc. - Overview
              • Cargill Inc. - Product / Service
              • Cargill Inc. - Key news
              • Cargill Inc. - Key offerings
            • 12.7 Corbion nv
              • Corbion nv - Overview
              • Corbion nv - Business segments
              • Corbion nv - Key news
              • Corbion nv - Key offerings
              • Corbion nv - Segment focus
            • 12.8 Danimer Scientific Inc.
              • Danimer Scientific Inc. - Overview
              • Danimer Scientific Inc. - Product / Service
              • Danimer Scientific Inc. - Key offerings
            • 12.9 Givaudan SA
              • Givaudan SA - Overview
              • Givaudan SA - Business segments
              • Givaudan SA - Key news
              • Givaudan SA - Key offerings
              • Givaudan SA - Segment focus
            • 12.10 Ingredion Inc.
              • Ingredion Inc. - Overview
              • Ingredion Inc. - Business segments
              • Ingredion Inc. - Key news
              • Ingredion Inc. - Key offerings
              • Ingredion Inc. - Segment focus
            • 12.11 J M Huber Corp.
              • J M Huber Corp. - Overview
              • J M Huber Corp. - Product / Service
              • J M Huber Corp. - Key news
              • J M Huber Corp. - Key offerings
            • 12.12 Koninklijke DSM NV
              • Koninklijke DSM NV - Overview
              • Koninklijke DSM NV - Business segments
              • Koninklijke DSM NV - Key news
              • Koninklijke DSM NV - Key offerings
              • Koninklijke DSM NV - Segment focus
            • 12.13 Marinova Pty Ltd.
              • Marinova Pty Ltd. - Overview
              • Marinova Pty Ltd. - Product / Service
              • Marinova Pty Ltd. - Key offerings
            • 12.14 Novamont S.p.A.
              • Novamont S.p.A. - Overview
              • Novamont S.p.A. - Product / Service
              • Novamont S.p.A. - Key offerings
            • 12.15 Seagarden AS
              • Seagarden AS - Overview
              • Seagarden AS - Product / Service
              • Seagarden AS - Key offerings
            • 12.16 Seaweed Solutions AS
              • Seaweed Solutions AS - Overview
              • Seaweed Solutions AS - Product / Service
              • Seaweed Solutions AS - Key offerings
            • 12.17 Tate and Lyle PLC
              • Tate and Lyle PLC - Overview
              • Tate and Lyle PLC - Business segments
              • Tate and Lyle PLC - Key news
              • Tate and Lyle PLC - Key offerings
              • Tate and Lyle PLC - Segment focus

            13 Appendix

            • 13.1 Scope of the report
              • 13.2 Inclusions and exclusions checklist
                • Inclusions checklist
                • Exclusions checklist
              • 13.3 Currency conversion rates for US$
                • Currency conversion rates for US$
              • 13.4 Research methodology
                • Research methodology
              • 13.5 Data procurement
                • Information sources
              • 13.6 Data validation
                • Data validation
              • 13.7 Validation techniques employed for market sizing
                • Validation techniques employed for market sizing
              • 13.8 Data synthesis
                • Data synthesis
              • 360 degree market analysis
                • 360 degree market analysis
              • 13.10 List of abbreviations
                • List of abbreviations

              Research Methodology

              Technavio presents a detailed picture of the market by way of study, synthesis, and summation of data from multiple sources. The analysts have presented the various facets of the market with a particular focus on identifying the key industry influencers. The data thus presented is comprehensive, reliable, and the result of extensive research, both primary and secondary.

              INFORMATION SOURCES

              Primary sources

              • Manufacturers and suppliers
              • Channel partners
              • Industry experts
              • Strategic decision makers

              Secondary sources

              • Industry journals and periodicals
              • Government data
              • Financial reports of key industry players
              • Historical data
              • Press releases

              DATA ANALYSIS

              Data Synthesis

              • Collation of data
              • Estimation of key figures
              • Analysis of derived insights

              Data Validation

              • Triangulation with data models
              • Reference against proprietary databases
              • Corroboration with industry experts

              REPORT WRITING

              Qualitative

              • Market drivers
              • Market challenges
              • Market trends
              • Five forces analysis

              Quantitative

              • Market size and forecast
              • Market segmentation
              • Geographical insights
              • Competitive landscape

              Interested in this report?

              Get your sample now to see our research methodology and insights!

              Download Now

              Frequently Asked Questions

              Marine Biopolymer market growth will increase by $ 1904 mn during 2024-2028.

              The Marine Biopolymer market is expected to grow at a CAGR of 10.87% during 2024-2028.

              Marine Biopolymer market is segmented by End-user( Water treatment, Food and beverage, Cosmetics, Pharmaceutical and biomedical, Others) Source( Shrimps, Prawns, Crabs, Others)

              Acadian Seaplants Ltd., Arkema SA, BASF SE, Bio on SpA, Biome Bioplastics Ltd., Cargill Inc., Corbion nv, Danimer Scientific Inc., Givaudan SA, Ingredion Inc., J M Huber Corp., Koninklijke DSM NV, Marinova Pty Ltd., Mitsubishi Chemical Corp., Novamont S.p.A., Oceanium Ltd., Rodenburg Biopolymers B.V., Seagarden AS, Seaweed Solutions AS, Tate and Lyle PLC are a few of the key vendors in the Marine Biopolymer market.

              APAC will register the highest growth rate of 39% among the other regions. Therefore, the Marine Biopolymer market in APAC is expected to garner significant business opportunities for the vendors during the forecast period.

              US, China, Japan, Germany, UK

              • Emerging applications from end-user industriesThe growing use of marine biopolymers in newly emerging applications such as agrochemicals is the driving factor this market.
              • fuel cells is the driving factor this market.
              • photographic products is the driving factor this market.
              • cardiovascular disease treatments is the driving factor this market.
              • textiles is the driving factor this market.
              • ophthalmology is the driving factor this market.
              • and paper and pulp is fostering the demand for marine biopolymers. The increase in R and D for its use in niche applications can be witnessed with the increasing demand for marine biopolymers. Also is the driving factor this market.
              • the low cost and abundant availability of marine biopolymers from crustacean shells is the driving factor this market.
              • shrimps is the driving factor this market.
              • crabs is the driving factor this market.
              • and krill are gaining importance in various applications. For instance is the driving factor this market.
              • in ophthalmology is the driving factor this market.
              • marine biopolymers are used to develop ocular drug delivery systems due to their non-toxicity is the driving factor this market.
              • good ocular tolerance is the driving factor this market.
              • and biological behavior. Bio-adhesion is the driving factor this market.
              • optical clarity is the driving factor this market.
              • mechanical strength is the driving factor this market.
              • wettability is the driving factor this market.
              • and gas permeability of marine biopolymer makes it an ideal material for making contact lens. Its antimicrobial ability is the driving factor this market.
              • healing ability is the driving factor this market.
              • and excellent film-forming capability make it suitable for ocular bandage lenses. In the paper and pulp industry is the driving factor this market.
              • marine biopolymer is used as a crosslinking agent between fibers to increase the strength of the paper. In fuel cells is the driving factor this market.
              • cost-effective and eco-friendly marine biopolymers are replacing expensive polymer-based electrolyte membranes. Marine biopolymer is used to make membrane materials for lithium batteries is the driving factor this market.
              • as well as for use in ultrafiltration and reverse osmosis applications. Marine biopolymer-based membranes show good hydrophilicity is the driving factor this market.
              • good proton conductivity is the driving factor this market.
              • and good thermal and chemical stability. Marine biopolymer is gaining importance as a bio-based material not only for electrolyte membranes but also for electrodes in various types of fuel cells is the driving factor this market.
              • such as biofuel cells and alkaline polymer electrolyte fuel cells. In the textile industry is the driving factor this market.
              • marine biopolymer is used as an anti-shrinking agent. It also increases dye uptake in wool-based textiles. Owing to its cat-ionic nature is the driving factor this market.
              • marine biopolymer has a high affinity for oppositely charged molecules. It is also used in making textiles used in hospitals and other healthcare facilities because of its antimicrobial properties. Thus is the driving factor this market.
              • emerging applications of marine biopolymers in end-user industries are expected to fuel the growth of the global marine biopolymer market during the forecast period. is the driving factor this market.

              The Marine Biopolymer market vendors should focus on grabbing business opportunities from the Water treatment segment as it accounted for the largest market share in the base year.
              RIA - Research AI Assistant
              Ask RIA