Biopolymers Market Analysis Europe, North America, APAC, Middle East and Africa, South America - US, Germany, UK, China, Japan - Size and Forecast 2024-2028

Biopolymers Market Analysis Europe, North America, APAC, Middle East and Africa, South America - US, Germany, UK, China, Japan - Size and Forecast 2024-2028

Published: Aug 2024 199 Pages SKU: IRTNTR45591

Market Overview at a Glance

$17114.6 B
Market Opportunity
10.52%
CAGR
9.78
YoY growth 2023-2024(%)

Biopolymers Market Size 2024-2028

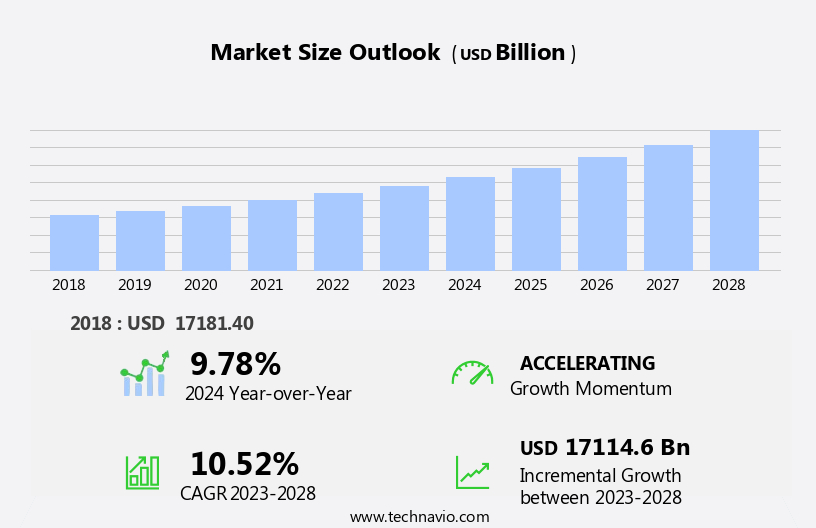
The biopolymers market size is forecast to increase by USD 17,114.6 billion at a CAGR of 10.52% between 2023 and 2028.

  • The market is experiencing significant growth, driven by various factors. One key trend is the volatility in prices of crude oil, leading to an increased focus on alternative materials. Another factor is the growing preference for eco-friendly packaging solutions, as consumers become more conscious of their environmental impact. 
  • However, the cost-effectiveness of conventional plastics remains a challenge for biopolymers, limiting their widespread adoption. Despite this, the market is expected to grow steadily due to the increasing demand for sustainable and biodegradable materials. Biopolymers offer a viable solution to the environmental concerns associated with traditional plastics, making them an attractive option for industries seeking to reduce their carbon footprint. The market analysis report provides a comprehensive overview of these trends and challenges, offering insights into the future growth prospects of the market.

What will be the Size of the Biopolymers Market During the Forecast Period?

Biopolymers Market Size

 Request Free Sample

  • The market encompasses a range of eco-friendly, biodegradable materials derived from renewable resources, including sugarcane, corn, wood, and standing timber. These biodegradable polymers offer a sustainable alternative to petroleum-based plastics, reducing carbon footprint and environmental impact. The market spans various sectors, including biomedical, food, and recycling, with significant growth In the automotive sector, particularly In the bottle segment. 
  • Biocompatibility is a critical factor In the medical sector, where biodegradable polyesters like polylactic acid (PLA), bio-PE, bio-PET, and PHA are used in medical implants and pharmaceutical applications. In cosmetics, rice-derived biopolymers are gaining popularity as matte agents and skin care ingredients.
  • Methanova (methylcellulose) and other biodegradable polymers contribute to the production of moldable plastics, further expanding the market's reach. Overall, the market continues to evolve, driven by consumer demand for eco-friendly products and advancements in raw material sourcing and processing technologies.

How is this Biopolymers Industry segmented and which is the largest segment?

The biopolymers industry research report provides comprehensive data (region-wise segment analysis), with forecasts and estimates in "USD billion" for the period 2024-2028, as well as historical data from 2018-2022 for the following segments.

  • Type
    • PLA
    • Bio-PE
    • Bio-PET
    • PHA
    • Others
  • End-user
    • Packaging and food services sector
    • Agriculture and horticulture
    • Consumer goods
    • Automotive
    • Others
  • Geography
    • Europe
      • Germany
      • UK
    • North America
      • US
    • APAC
      • China
      • Japan
    • Middle East and Africa
    • South America

By Type Insights

  • The pla segment is estimated to witness significant growth during the forecast period.

Biopolymers, also known as bioplastics, are a type of sustainable material derived from renewable resources, such as corn, sugarcane, and lactic acid. One of the most commonly used biodegradable polyesters is Polylactic Acid (PLA), which is synthesized from lactic acid, a naturally occurring substance found in blood and muscle tissues. PLA can be produced using both renewable and non-renewable sources. The chemical polymerization of lactic acid results In the formation of PLA copolymer. PLA is a versatile biopolymer with various applications, including packaging, textiles, hygiene products, agriculture, insulation, and automotive components. In the packaging sector, PLA is used to produce bottles, films, and fibers.

It is a preferred choice due to its water-resistant properties and biodegradability. In the medical sector, PLA is used to manufacture medical implants, pharmaceutical containers, and surgical sutures. It is also used In the production of eco-friendly skin care products, such as matte finishers and rice-derived biopolymers. PLA's environmental benefits include a reduced carbon footprint compared to petroleum-based plastics and alignment with the circular economy. The use of biopolymers in single-use plastic packaging and other applications contributes to increased recycling rates and a reduction in environmental impact. Other biodegradable polyesters, such as polyhydroxyalkanoate, biodegradable polyesters (Bio PE, Bio PET, Mater Bi, Origo Bi), and methanova (methylcellulose), also offer similar benefits and are used in various applications, including bottles, films, fibers, seed coating, vehicle components, agriculture, construction, medical equipment, consumer goods, textiles, orthopedic devices, wound management, and drug delivery systems.

Biopolymers Market Size

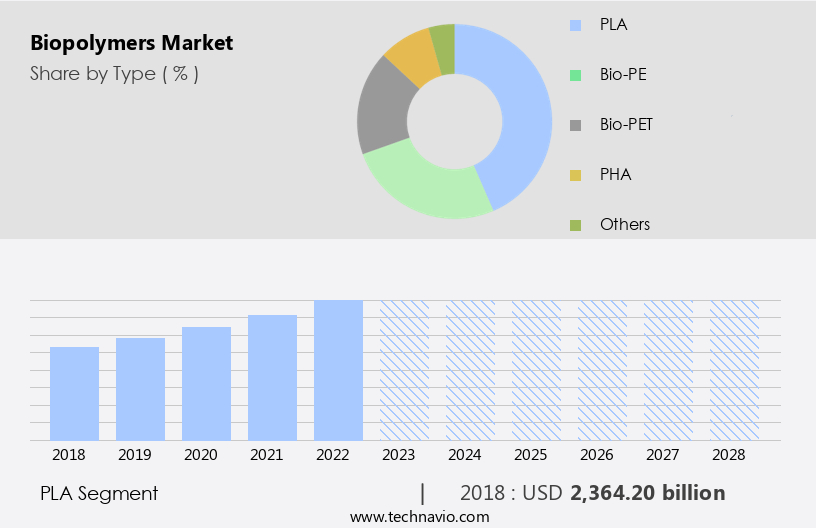
Get a glance at the  Biopolymers Industry report of share of various segments Request Free Sample

The PLA segment was valued at USD 2,364.20 billion in 2018 and showed a gradual increase during the forecast period.

Regional Analysis

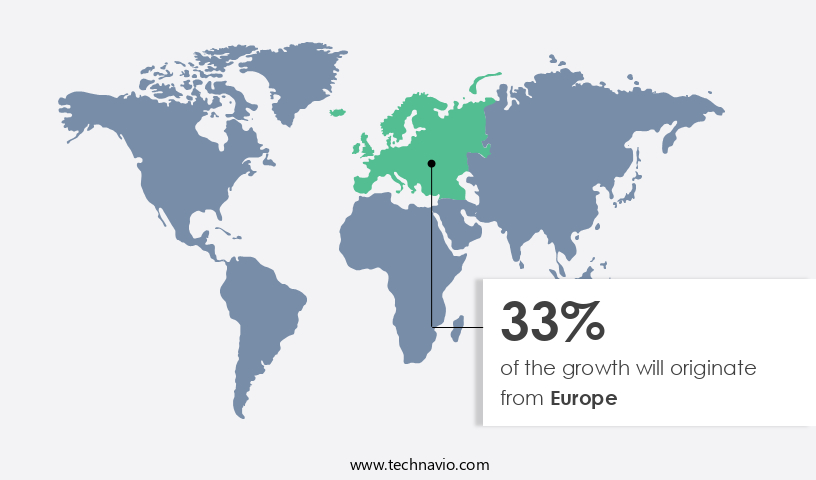
  • Europe is estimated to contribute 33% to the growth of the global market during the forecast period.

Technavio's analysts have elaborately explained the regional trends and drivers that shape the market during the forecast period.

Biopolymers Market Share by Geography

For more insights on the market share of various regions, Request Free Sample

Biopolymers are essential components in various industries, including medical, food, and automotive. In the medical sector, biopolymers are utilized in producing biodegradable implants, pharmaceuticals, and medical equipment. Biodegradable plastics derived from PHAs are gaining popularity due to their eco-friendly nature and minimal carbon footprint. The European market is a significant contributor to the global biopolymers industry, driven by the medical sector's increasing demand. The aging population in Europe, particularly in countries like Germany, France, and Italy, is fueling this growth. According to The World Bank Group, the EU's population aged 65 and above grew by 21% in 2022. This demographic trend is expected to continue, leading to increased demand for medical devices and, consequently, biopolymers.

The market is further expanding into sectors like agriculture, construction, and consumer goods, promoting a circular economy and reducing reliance on petroleum-based plastics. Biopolymers, including Methanova (methylcellulose), Polylactic acid (PLA), Polyhydroxyalkanoate (PHA), and Biodegradable Polyesters, are replacing non-biodegradable materials in various applications. The use of biopolymers in skin care products, rice derived biopolymers, and wood-based biopolymers is also on the rise. The automotive sector is adopting biopolymers for vehicle components, further expanding their applications. The market is expected to continue growing as more industries recognize the benefits of sustainable materials and the need to reduce environmental impact.

Market Dynamics

Our  researchers analyzed the data with 2023 as the base year, along with the key drivers, trends, and challenges. A holistic analysis of drivers will help companies refine their marketing strategies to gain a competitive advantage.

What are the key market drivers leading to the rise In the adoption of Biopolymers Industry?

Volatility in crude oil prices is the key driver of the market.

  • Biopolymers, also known as bioplastics, are gaining popularity as eco-friendly alternatives to traditional petroleum-based plastics. PHA-based environmental plastics are one type of biopolymers that are biodegradable and have applications in various sectors, including food, medical, and automotive. In the food industry, biodegradable plastics are used for single-use packaging to reduce environmental impact. In the medical sector, biodegradable products find use in medical implants, pharmaceuticals, and wound management. The circular economy is driving the demand for biodegradable plastics as they have a lower carbon footprint compared to petroleum-based plastics. Biodegradable polyesters, such as Polyhydroxyalkanoate (PHA), Mater Bi, Origo Bi, Bio PE, Bio PET, and Polylactic acid (PLA), are commonly used In the production of biodegradable plastics.
  • Rice derived biopolymers, such as Methanova (methylcellulose), are also gaining traction In the market due to their sustainability and biodegradability. These biopolymers are used in various applications, including skin care products, matte finishing agents, and adhesives. The automotive sector is another significant market for biopolymers, particularly In the bottle segment, where biodegradable plastics are used for manufacturing vehicle components. In the agriculture sector, biodegradable plastics are used for seed coating and in construction for insulation and roofing materials. Despite their benefits, biodegradable plastics face challenges in terms of recycling rates and cost competitiveness with petroleum-based plastics. However, as environmental concerns continue to mount, the demand for sustainable materials is expected to grow.
  • Biopolymers are used in various industries, including medical equipment, consumer goods, textiles, orthopedic devices, and drug delivery systems. The market for biopolymers is expected to grow as more companies adopt circular economy principles and prioritize eco-friendly products. In conclusion, biopolymers offer a sustainable alternative to traditional petroleum-based plastics. PHA-based environmental plastics, biodegradable polyesters, and rice derived biopolymers are some of the types of biopolymers that are gaining popularity due to their biodegradability, lower carbon footprint, and versatility. The market for biopolymers is expected to grow as more companies prioritize sustainable materials and adopt circular economy principles.

What are the market trends shaping the Biopolymers Industry?

Increasing preference for eco-friendly packaging is the upcoming market trend.

  • The market is experiencing significant growth due to the increasing demand for eco-friendly and biodegradable alternatives to traditional petroleum-based plastics. PHA-based environmental plastics, derived from renewable sources such as rice and wood, are gaining popularity in various industries. These biopolymers are used in producing biodegradable products, including medical implants, pharmaceuticals, and skin care products. The circular economy concept is driving the market, with an emphasis on reducing waste and carbon footprint. Biodegradable plastics, such as biodegradable polyesters like Polyhydroxyalkanoate (PHA), Bio PE, Bio PET, Mater Bi, Origo Bi, and others, are replacing single-use plastic packaging in sectors like food, automotive, agriculture, construction, medical equipment, consumer goods, textiles, and orthopedic devices.
  • The European Commission's recent proposal to regulate ten single-use plastic products is an example of governments' efforts to address environmental concerns. The automotive sector, bottle segment, and medical sector are significant contributors to the market's growth. The use of eco-friendly materials like methanova (methylcellulose) and polylactic acid (PLA) in vehicle components, bottles, films, fibers, seed coating, and wound management products is increasing. In conclusion, the market is expanding due to the rising demand for sustainable materials, stringent regulations, and increasing consumer awareness. Biodegradable plastics offer a carbon-neutral alternative to traditional plastics, reducing the environmental impact of plastic waste.
  • The market is expected to continue growing as more industries adopt biodegradable plastics In their production processes.

What challenges does the Biopolymers Industry face during its growth?

Cost-effectiveness of conventional plastics over biopolymers is a key challenge affecting the industry growth.

  • The market faces a significant hurdle in its expansion due to the cost-effective nature of traditional plastics. Biopolymers, including PHA-based environmental plastics, have a price range of USD3,500 to USD5,200 per ton, which is notably higher than conventional plastics. This price disparity is primarily due to the high polymerization costs of biopolymers, as the production processes are not yet industrialized. Inefficient technologies and the scarcity of feedstocks, such as glucose, further increase the production expenses of biopolymers. Biodegradable products, such as bioplastics derived from renewable resources like corn starch, rice, wood, and methanova (methylcellulose), offer eco-friendly alternatives to single-use plastic packaging, textiles, medical implants, pharmaceuticals, and various industrial applications.
  • Biodegradable polyesters, including polylactic acid (PLA), Polyhydroxyalkanoate (PHA), Bio PE, Bio PET, Mater Bi, Origo Bi, and others, are gaining traction in sectors like automotive, bottles, films, fibers, seed coating, vehicle components, agriculture, construction, medical equipment, consumer goods, textiles, orthopedic devices, wound management, surgical sutures, drug delivery systems, and sustainable materials. Despite their numerous advantages, biopolymers face challenges in terms of cost competitiveness. The high carbon footprint of petroleum-based plastics and the environmental impact of their disposal are significant concerns, leading to the growing demand for eco-friendly alternatives. The circular economy, which emphasizes the reuse, repair, and recycling of materials, is a promising approach to reducing the reliance on non-biodegradable plastics.
  • As the world transitions towards more sustainable materials, the market is expected to grow, offering opportunities for innovation and growth.

Exclusive Customer Landscape

The biopolymers market forecasting report includes the adoption lifecycle of the market, covering from the innovator's stage to the laggard's stage. It focuses on adoption rates in different regions based on penetration. Furthermore, the biopolymers market report also includes key purchase criteria and drivers of price sensitivity to help companies evaluate and develop their market growth analysis strategies.

Biopolymers Market Share by Geography

 Customer Landscape

Key Companies & Market Insights

Companies are implementing various strategies, such as strategic alliances, biopolymers market forecast, partnerships, mergers and acquisitions, geographical expansion, and product/service launches, to enhance their presence In the industry.

Archer Daniels Midland Co. - The company collaborates with LG Chem to provide biopolymers and bioplastics, contributing to the global market growth through sustainable solutions.

The industry research and growth report includes detailed analyses of the competitive landscape of the market and information about key companies, including:

  • Archer Daniels Midland Co.
  • Arkema Group.
  • BASF SE
  • Biome Technologies plc
  • Braskem SA
  • Danimer Scientific Inc.
  • DuPont de Nemours Inc.
  • Eastman Chemical Co.
  • Evonik Industries AG
  • Galatea Bio Tech Srl
  • KURARAY Co. Ltd.
  • Merck KGaA
  • Mitsubishi Chemical Corp.
  • NatureWorks LLC
  • Novamont S.p.A.
  • Rodenburg Biopolymers B.V.
  • Solanyl Biopolymers Inc.
  • Toray Industries Inc.
  • TotalEnergies Corbion bv
  • Yield10 Bioscience Inc.

Qualitative and quantitative analysis of companies has been conducted to help clients understand the wider business environment as well as the strengths and weaknesses of key industry players. Data is qualitatively analyzed to categorize companies as pure play, category-focused, industry-focused, and diversified; it is quantitatively analyzed to categorize companies as dominant, leading, strong, tentative, and weak.

Research Analyst Overview

Biopolymers, also known as bioplastics, are a type of polymer derived from renewable biomass sources, such as plant-based materials, instead of fossil fuels. These eco-friendly alternatives to traditional petroleum-based plastics have gained significant attention due to their potential to reduce carbon footprint and minimize environmental impact. Biopolymers are finding applications in various sectors, including biomedical, food, and single-use plastic packaging. In the biomedical sector, they are used in medical implants, pharmaceuticals, and medical equipment, offering advantages such as biocompatibility and biodegradability. In the food industry, biopolymers are used in packaging and as additives, providing benefits like improved shelf life and reduced environmental impact.

The circular economy is a driving force behind the growth of the market. The focus on reducing waste and promoting sustainable materials has led to increased demand for biodegradable plastics in various applications. Biodegradable polyesters, such as polyhydroxyalkanoate (PHA) and polylactic acid (PLA), are popular choices due to their excellent properties and biodegradability. Methylcellulose, a type of methylated cellulose, is another biopolymer that has gained attention due to its versatility. It is used in various applications, including food, pharmaceuticals, and cosmetics. In cosmetics, it is used as a binder, thickener, and film former in skin care products, providing benefits like improved texture and matte finish.

Wood-derived biopolymers, such as lignin and cellulose nanofibrils, are also gaining popularity due to their sustainability and potential to replace non-biodegradable materials in various industries. These biopolymers can be used in automotive components, construction materials, and textiles, among others. Despite the advantages of biopolymers, there are challenges to their widespread adoption. Recycling rates for biodegradable plastics are still low, and the production of biopolymers requires significant amounts of raw materials and energy. Additionally, the production of some biopolymers, such as PHA, can be expensive. The automotive sector is a significant market for biopolymers, particularly In the bottle segment.

Biodegradable plastics are used in vehicle components, such as interior parts and packaging, to reduce carbon footprint and promote sustainability. In the medical sector, biopolymers are used in various applications, including wound management, surgical sutures, and drug delivery systems. The use of biopolymers in consumer goods, such as bottles, films, fibers, and seed coating, is also increasing due to growing consumer demand for eco-friendly products. In agriculture, biopolymers are used as seed coating and In the production of biodegradable mulch films, offering benefits like improved crop growth and reduced environmental impact. In conclusion, biopolymers are a promising alternative to traditional petroleum-based plastics, offering advantages like biodegradability, reduced carbon footprint, and sustainability. The market for biopolymers is expected to grow as the focus on reducing waste and promoting sustainable materials continues to increase. However, challenges such as low recycling rates and high production costs need to be addressed to fully realize the potential of biopolymers.

Market Scope

Report Coverage

Details

Page number

199

Base year

2023

Historic period

2018-2022

Forecast period

2024-2028

Growth momentum & CAGR

Accelerate at a CAGR of 10.52%

Market growth 2024-2028

USD 17,114.6 billion

Market structure

Fragmented

YoY growth 2023-2024(%)

9.78

Key countries

US, Germany, UK, China, and Japan

Competitive landscape

Leading Companies, Market Positioning of Companies, Competitive Strategies, and Industry Risks

Request Free Sample

What are the Key Data Covered in this Biopolymers Market Research and Growth Report?

  • CAGR of the Biopolymers industry during the forecast period
  • Detailed information on factors that will drive the growth and forecasting between 2024 and 2028
  • Precise estimation of the size of the market and its contribution of the industry in focus to the parent market
  • Accurate predictions about upcoming growth and trends and changes in consumer behaviour
  • Growth of the market across Europe, North America, APAC, Middle East and Africa, and South America
  • Thorough analysis of the market's competitive landscape and detailed information about companies
  • Comprehensive analysis of factors that will challenge the biopolymers market growth of industry companies

We can help! Our analysts can customize this biopolymers market research report to meet your requirements.

Get in touch

1 Executive Summary

  • 1.1 Market overview
    • Executive Summary - Chart on Market Overview
    • Executive Summary - Data Table on Market Overview
    • Executive Summary - Chart on Global Market Characteristics
    • Executive Summary - Chart on Market by Geography
    • Executive Summary - Chart on Market Segmentation by Type
    • Executive Summary - Chart on Market Segmentation by End-user
    • Executive Summary - Chart on Incremental Growth
    • Executive Summary - Data Table on Incremental Growth
    • Executive Summary - Chart on Company Market Positioning

2 Market Landscape

  • 2.1 Market ecosystem
    • Parent Market
    • Data Table on - Parent Market
  • 2.2 Market characteristics
    • Market characteristics analysis
  • 2.3 Value chain analysis
    • Value Chain Analysis

3 Market Sizing

  • 3.1 Market definition
    • Offerings of companies included in the market definition
  • 3.2 Market segment analysis
    • Market segments
  • 3.3 Market size 2023
    • 3.4 Market outlook: Forecast for 2023-2028
      • Chart on Global - Market size and forecast 2023-2028 ($ billion)
      • Data Table on Global - Market size and forecast 2023-2028 ($ billion)
      • Chart on Global Market: Year-over-year growth 2023-2028 (%)
      • Data Table on Global Market: Year-over-year growth 2023-2028 (%)

    4 Historic Market Size

    • 4.1 Global Biopolymers Market 2018 - 2022
      • Historic Market Size - Data Table on Global Biopolymers Market 2018 - 2022 ($ billion)
    • 4.2 Type segment analysis 2018 - 2022
      • Historic Market Size - Type Segment 2018 - 2022 ($ billion)
    • 4.3 End-user segment analysis 2018 - 2022
      • Historic Market Size - End-user Segment 2018 - 2022 ($ billion)
    • 4.4 Geography segment analysis 2018 - 2022
      • Historic Market Size - Geography Segment 2018 - 2022 ($ billion)
    • 4.5 Country segment analysis 2018 - 2022
      • Historic Market Size - Country Segment 2018 - 2022 ($ billion)

    5 Five Forces Analysis

    • 5.1 Five forces summary
      • Five forces analysis - Comparison between 2023 and 2028
    • 5.2 Bargaining power of buyers
      • Bargaining power of buyers - Impact of key factors 2023 and 2028
    • 5.3 Bargaining power of suppliers
      • Bargaining power of suppliers - Impact of key factors in 2023 and 2028
    • 5.4 Threat of new entrants
      • Threat of new entrants - Impact of key factors in 2023 and 2028
    • 5.5 Threat of substitutes
      • Threat of substitutes - Impact of key factors in 2023 and 2028
    • 5.6 Threat of rivalry
      • Threat of rivalry - Impact of key factors in 2023 and 2028
    • 5.7 Market condition
      • Chart on Market condition - Five forces 2023 and 2028

    6 Market Segmentation by Type

    • 6.1 Market segments
      • Chart on Type - Market share 2023-2028 (%)
      • Data Table on Type - Market share 2023-2028 (%)
    • 6.2 Comparison by Type
      • Chart on Comparison by Type
      • Data Table on Comparison by Type
    • 6.3 PLA - Market size and forecast 2023-2028
      • Chart on PLA - Market size and forecast 2023-2028 ($ billion)
      • Data Table on PLA - Market size and forecast 2023-2028 ($ billion)
      • Chart on PLA - Year-over-year growth 2023-2028 (%)
      • Data Table on PLA - Year-over-year growth 2023-2028 (%)
    • 6.4 Bio-PE - Market size and forecast 2023-2028
      • Chart on Bio-PE - Market size and forecast 2023-2028 ($ billion)
      • Data Table on Bio-PE - Market size and forecast 2023-2028 ($ billion)
      • Chart on Bio-PE - Year-over-year growth 2023-2028 (%)
      • Data Table on Bio-PE - Year-over-year growth 2023-2028 (%)
    • 6.5 Bio-PET - Market size and forecast 2023-2028
      • Chart on Bio-PET - Market size and forecast 2023-2028 ($ billion)
      • Data Table on Bio-PET - Market size and forecast 2023-2028 ($ billion)
      • Chart on Bio-PET - Year-over-year growth 2023-2028 (%)
      • Data Table on Bio-PET - Year-over-year growth 2023-2028 (%)
    • 6.6 PHA - Market size and forecast 2023-2028
      • Chart on PHA - Market size and forecast 2023-2028 ($ billion)
      • Data Table on PHA - Market size and forecast 2023-2028 ($ billion)
      • Chart on PHA - Year-over-year growth 2023-2028 (%)
      • Data Table on PHA - Year-over-year growth 2023-2028 (%)
    • 6.7 Others - Market size and forecast 2023-2028
      • Chart on Others - Market size and forecast 2023-2028 ($ billion)
      • Data Table on Others - Market size and forecast 2023-2028 ($ billion)
      • Chart on Others - Year-over-year growth 2023-2028 (%)
      • Data Table on Others - Year-over-year growth 2023-2028 (%)
    • 6.8 Market opportunity by Type
      • Market opportunity by Type ($ billion)
      • Data Table on Market opportunity by Type ($ billion)

    7 Market Segmentation by End-user

    • 7.1 Market segments
      • Chart on End-user - Market share 2023-2028 (%)
      • Data Table on End-user - Market share 2023-2028 (%)
    • 7.2 Comparison by End-user
      • Chart on Comparison by End-user
      • Data Table on Comparison by End-user
    • 7.3 Packaging and food services sector - Market size and forecast 2023-2028
      • Chart on Packaging and food services sector - Market size and forecast 2023-2028 ($ billion)
      • Data Table on Packaging and food services sector - Market size and forecast 2023-2028 ($ billion)
      • Chart on Packaging and food services sector - Year-over-year growth 2023-2028 (%)
      • Data Table on Packaging and food services sector - Year-over-year growth 2023-2028 (%)
    • 7.4 Agriculture and horticulture - Market size and forecast 2023-2028
      • Chart on Agriculture and horticulture - Market size and forecast 2023-2028 ($ billion)
      • Data Table on Agriculture and horticulture - Market size and forecast 2023-2028 ($ billion)
      • Chart on Agriculture and horticulture - Year-over-year growth 2023-2028 (%)
      • Data Table on Agriculture and horticulture - Year-over-year growth 2023-2028 (%)
    • 7.5 Consumer goods - Market size and forecast 2023-2028
      • Chart on Consumer goods - Market size and forecast 2023-2028 ($ billion)
      • Data Table on Consumer goods - Market size and forecast 2023-2028 ($ billion)
      • Chart on Consumer goods - Year-over-year growth 2023-2028 (%)
      • Data Table on Consumer goods - Year-over-year growth 2023-2028 (%)
    • 7.6 Automotive - Market size and forecast 2023-2028
      • Chart on Automotive - Market size and forecast 2023-2028 ($ billion)
      • Data Table on Automotive - Market size and forecast 2023-2028 ($ billion)
      • Chart on Automotive - Year-over-year growth 2023-2028 (%)
      • Data Table on Automotive - Year-over-year growth 2023-2028 (%)
    • 7.7 Others - Market size and forecast 2023-2028
      • Chart on Others - Market size and forecast 2023-2028 ($ billion)
      • Data Table on Others - Market size and forecast 2023-2028 ($ billion)
      • Chart on Others - Year-over-year growth 2023-2028 (%)
      • Data Table on Others - Year-over-year growth 2023-2028 (%)
    • 7.8 Market opportunity by End-user
      • Market opportunity by End-user ($ billion)
      • Data Table on Market opportunity by End-user ($ billion)

    8 Customer Landscape

    • 8.1 Customer landscape overview
      • Analysis of price sensitivity, lifecycle, customer purchase basket, adoption rates, and purchase criteria

    9 Geographic Landscape

    • 9.1 Geographic segmentation
      • Chart on Market share by geography 2023-2028 (%)
      • Data Table on Market share by geography 2023-2028 (%)
    • 9.2 Geographic comparison
      • Chart on Geographic comparison
      • Data Table on Geographic comparison
    • 9.3 Europe - Market size and forecast 2023-2028
      • Chart on Europe - Market size and forecast 2023-2028 ($ billion)
      • Data Table on Europe - Market size and forecast 2023-2028 ($ billion)
      • Chart on Europe - Year-over-year growth 2023-2028 (%)
      • Data Table on Europe - Year-over-year growth 2023-2028 (%)
    • 9.4 North America - Market size and forecast 2023-2028
      • Chart on North America - Market size and forecast 2023-2028 ($ billion)
      • Data Table on North America - Market size and forecast 2023-2028 ($ billion)
      • Chart on North America - Year-over-year growth 2023-2028 (%)
      • Data Table on North America - Year-over-year growth 2023-2028 (%)
    • 9.5 APAC - Market size and forecast 2023-2028
      • Chart on APAC - Market size and forecast 2023-2028 ($ billion)
      • Data Table on APAC - Market size and forecast 2023-2028 ($ billion)
      • Chart on APAC - Year-over-year growth 2023-2028 (%)
      • Data Table on APAC - Year-over-year growth 2023-2028 (%)
    • 9.6 Middle East and Africa - Market size and forecast 2023-2028
      • Chart on Middle East and Africa - Market size and forecast 2023-2028 ($ billion)
      • Data Table on Middle East and Africa - Market size and forecast 2023-2028 ($ billion)
      • Chart on Middle East and Africa - Year-over-year growth 2023-2028 (%)
      • Data Table on Middle East and Africa - Year-over-year growth 2023-2028 (%)
    • 9.7 South America - Market size and forecast 2023-2028
      • Chart on South America - Market size and forecast 2023-2028 ($ billion)
      • Data Table on South America - Market size and forecast 2023-2028 ($ billion)
      • Chart on South America - Year-over-year growth 2023-2028 (%)
      • Data Table on South America - Year-over-year growth 2023-2028 (%)
    • 9.8 US - Market size and forecast 2023-2028
      • Chart on US - Market size and forecast 2023-2028 ($ billion)
      • Data Table on US - Market size and forecast 2023-2028 ($ billion)
      • Chart on US - Year-over-year growth 2023-2028 (%)
      • Data Table on US - Year-over-year growth 2023-2028 (%)
    • 9.9 Germany - Market size and forecast 2023-2028
      • Chart on Germany - Market size and forecast 2023-2028 ($ billion)
      • Data Table on Germany - Market size and forecast 2023-2028 ($ billion)
      • Chart on Germany - Year-over-year growth 2023-2028 (%)
      • Data Table on Germany - Year-over-year growth 2023-2028 (%)
    • 9.10 China - Market size and forecast 2023-2028
      • Chart on China - Market size and forecast 2023-2028 ($ billion)
      • Data Table on China - Market size and forecast 2023-2028 ($ billion)
      • Chart on China - Year-over-year growth 2023-2028 (%)
      • Data Table on China - Year-over-year growth 2023-2028 (%)
    • 9.11 UK - Market size and forecast 2023-2028
      • Chart on UK - Market size and forecast 2023-2028 ($ billion)
      • Data Table on UK - Market size and forecast 2023-2028 ($ billion)
      • Chart on UK - Year-over-year growth 2023-2028 (%)
      • Data Table on UK - Year-over-year growth 2023-2028 (%)
    • 9.12 Japan - Market size and forecast 2023-2028
      • Chart on Japan - Market size and forecast 2023-2028 ($ billion)
      • Data Table on Japan - Market size and forecast 2023-2028 ($ billion)
      • Chart on Japan - Year-over-year growth 2023-2028 (%)
      • Data Table on Japan - Year-over-year growth 2023-2028 (%)
    • 9.13 Market opportunity by geography
      • Market opportunity by geography ($ billion)
      • Data Tables on Market opportunity by geography ($ billion)

    10 Drivers, Challenges, and Opportunity/Restraints

    • 10.1 Market drivers
      • 10.2 Market challenges
        • 10.3 Impact of drivers and challenges
          • Impact of drivers and challenges in 2023 and 2028
        • 10.4 Market opportunities/restraints

          11 Competitive Landscape

          • 11.1 Overview
            • 11.2 Competitive Landscape
              • Overview on criticality of inputs and factors of differentiation
            • 11.3 Landscape disruption
              • Overview on factors of disruption
            • 11.4 Industry risks
              • Impact of key risks on business

            12 Competitive Analysis

            • 12.1 Companies profiled
              • Companies covered
            • 12.2 Market positioning of companies
              • Matrix on companies position and classification
            • 12.3 Archer Daniels Midland Co.
              • Archer Daniels Midland Co. - Overview
              • Archer Daniels Midland Co. - Business segments
              • Archer Daniels Midland Co. - Key news
              • Archer Daniels Midland Co. - Key offerings
              • Archer Daniels Midland Co. - Segment focus
            • 12.4 Arkema Group.
              • Arkema Group. - Overview
              • Arkema Group. - Business segments
              • Arkema Group. - Key news
              • Arkema Group. - Key offerings
              • Arkema Group. - Segment focus
            • 12.5 BASF SE
              • BASF SE - Overview
              • BASF SE - Business segments
              • BASF SE - Key news
              • BASF SE - Key offerings
              • BASF SE - Segment focus
            • 12.6 Biome Technologies plc
              • Biome Technologies plc - Overview
              • Biome Technologies plc - Business segments
              • Biome Technologies plc - Key offerings
              • Biome Technologies plc - Segment focus
            • 12.7 Braskem SA
              • Braskem SA - Overview
              • Braskem SA - Business segments
              • Braskem SA - Key offerings
              • Braskem SA - Segment focus
            • 12.8 Danimer Scientific Inc.
              • Danimer Scientific Inc. - Overview
              • Danimer Scientific Inc. - Product / Service
              • Danimer Scientific Inc. - Key offerings
            • 12.9 DuPont de Nemours Inc.
              • DuPont de Nemours Inc. - Overview
              • DuPont de Nemours Inc. - Business segments
              • DuPont de Nemours Inc. - Key news
              • DuPont de Nemours Inc. - Key offerings
              • DuPont de Nemours Inc. - Segment focus
            • 12.10 Evonik Industries AG
              • Evonik Industries AG - Overview
              • Evonik Industries AG - Business segments
              • Evonik Industries AG - Key news
              • Evonik Industries AG - Key offerings
              • Evonik Industries AG - Segment focus
            • 12.11 Galatea Bio Tech Srl
              • Galatea Bio Tech Srl - Overview
              • Galatea Bio Tech Srl - Product / Service
              • Galatea Bio Tech Srl - Key offerings
            • 12.12 KURARAY Co. Ltd.
              • KURARAY Co. Ltd. - Overview
              • KURARAY Co. Ltd. - Business segments
              • KURARAY Co. Ltd. - Key news
              • KURARAY Co. Ltd. - Key offerings
              • KURARAY Co. Ltd. - Segment focus
            • 12.13 Merck KGaA
              • Merck KGaA - Overview
              • Merck KGaA - Business segments
              • Merck KGaA - Key news
              • Merck KGaA - Key offerings
              • Merck KGaA - Segment focus
            • 12.14 NatureWorks LLC
              • NatureWorks LLC - Overview
              • NatureWorks LLC - Product / Service
              • NatureWorks LLC - Key offerings
            • 12.15 Novamont S.p.A.
              • Novamont S.p.A. - Overview
              • Novamont S.p.A. - Product / Service
              • Novamont S.p.A. - Key offerings
            • 12.16 Toray Industries Inc.
              • Toray Industries Inc. - Overview
              • Toray Industries Inc. - Business segments
              • Toray Industries Inc. - Key news
              • Toray Industries Inc. - Key offerings
              • Toray Industries Inc. - Segment focus
            • 12.17 TotalEnergies Corbion bv
              • TotalEnergies Corbion bv - Overview
              • TotalEnergies Corbion bv - Product / Service
              • TotalEnergies Corbion bv - Key offerings

            13 Appendix

            • 13.1 Scope of the report
              • 13.2 Inclusions and exclusions checklist
                • Inclusions checklist
                • Exclusions checklist
              • 13.3 Currency conversion rates for US$
                • Currency conversion rates for US$
              • 13.4 Research methodology
                • Research methodology
              • 13.5 Data procurement
                • Information sources
              • 13.6 Data validation
                • Data validation
              • 13.7 Validation techniques employed for market sizing
                • Validation techniques employed for market sizing
              • 13.8 Data synthesis
                • Data synthesis
              • 13.9 360 degree market analysis
                • 360 degree market analysis
              • 13.10 List of abbreviations
                • List of abbreviations

              Research Methodology

              Technavio presents a detailed picture of the market by way of study, synthesis, and summation of data from multiple sources. The analysts have presented the various facets of the market with a particular focus on identifying the key industry influencers. The data thus presented is comprehensive, reliable, and the result of extensive research, both primary and secondary.

              INFORMATION SOURCES

              Primary sources

              • Manufacturers and suppliers
              • Channel partners
              • Industry experts
              • Strategic decision makers

              Secondary sources

              • Industry journals and periodicals
              • Government data
              • Financial reports of key industry players
              • Historical data
              • Press releases

              DATA ANALYSIS

              Data Synthesis

              • Collation of data
              • Estimation of key figures
              • Analysis of derived insights

              Data Validation

              • Triangulation with data models
              • Reference against proprietary databases
              • Corroboration with industry experts

              REPORT WRITING

              Qualitative

              • Market drivers
              • Market challenges
              • Market trends
              • Five forces analysis

              Quantitative

              • Market size and forecast
              • Market segmentation
              • Geographical insights
              • Competitive landscape

              Interested in this report?

              Get your sample now to see our research methodology and insights!

              Download Now

              Frequently Asked Questions

              Biopolymers market growth will increase by $ 17114.6 bn during 2024-2028.

              The Biopolymers market is expected to grow at a CAGR of 10.52% during 2024-2028.

              Biopolymers market is segmented by Type( PLA, Bio-PE, Bio-PET, PHA, Others) End-user( Packaging and food services sector, Agriculture and horticulture, Consumer goods, Automotive, Others)

              Archer Daniels Midland Co., Arkema Group., BASF SE, Biome Technologies plc, Braskem SA, Danimer Scientific Inc., DuPont de Nemours Inc., Eastman Chemical Co., Evonik Industries AG, Galatea Bio Tech Srl, KURARAY Co. Ltd., Merck KGaA, Mitsubishi Chemical Corp., NatureWorks LLC, Novamont S.p.A., Rodenburg Biopolymers B.V., Solanyl Biopolymers Inc., Toray Industries Inc., TotalEnergies Corbion bv, Yield10 Bioscience Inc. are a few of the key vendors in the Biopolymers market.

              Europe will register the highest growth rate of 33% among the other regions. Therefore, the Biopolymers market in Europe is expected to garner significant business opportunities for the vendors during the forecast period.

              US, Germany, UK, China, Japan

              • Volatility in crude oil pricesThe use of crude oil as a carbon feedstock for producing petrochemicals has dominated the chemical industry. The oil and gas industry is one of the major suppliers of raw materials to the global chemical market. Therefore is the driving factor this market.
              • any fluctuations in crude oil prices affect the prices of raw materials considerably is the driving factor this market.
              • thereby affecting the cost of chemicals. According to the US Energy Information Administration (EIA) is the driving factor this market.
              • in June 2021 is the driving factor this market.
              • the price of Brent crude oil was around $73 per barrel is the driving factor this market.
              • which was an increase of $3 per barrel from the previous year. The volatility in the prices of raw materials directly affects the revenue and profit margins of chemical manufacturers. Therefore is the driving factor this market.
              • vendors are compelled to reduce the use of petroleum-derived feedstock chemicals and seek alternative solutions to maintain their profit margins. The supply of raw materials can be negatively affected by adverse weather conditions is the driving factor this market.
              • national emergencies is the driving factor this market.
              • natural disasters is the driving factor this market.
              • supply shortages is the driving factor this market.
              • and other events. The price fluctuations and non-availability of raw materials can affect the cost of the products and operations of the vendors. Thus is the driving factor this market.
              • volatility in crude oil prices will boost the demand for biopolymers globally during the forecast period. is the driving factor this market.

              The Biopolymers market vendors should focus on grabbing business opportunities from the PLA segment as it accounted for the largest market share in the base year.
              RIA - Research AI Assistant
              Ask RIA