Polyhydroxyalkanoate Market Analysis APAC, Europe, North America, South America, Middle East and Africa - US, China, Japan, India, Germany - Size and Forecast 2024-2028

Polyhydroxyalkanoate Market Analysis APAC, Europe, North America, South America, Middle East and Africa - US, China, Japan, India, Germany - Size and Forecast 2024-2028

Published: Jan 2024 166 Pages SKU: IRTNTR44293

Market Overview at a Glance

$26.9 Mn
Market Opportunity
6.31%
CAGR
5.92
YoY growth 2023-2024(%)

Polyhydroxyalkanoate Market Size 2024-2028 

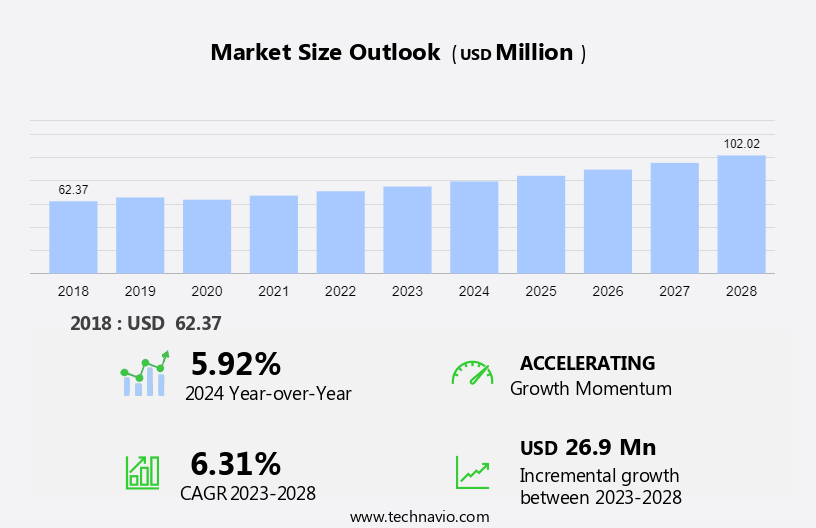
The polyhydroxyalkanoate market size is forecast to increase by USD 26.9 million at a CAGR of 6.31% between 2023 and 2028.

  • The market is experiencing significant growth due to the increasing demand for eco-friendly and biodegradable plastics. This trend is particularly noticeable in industries such as food processing and flexible packaging, where the use of PHAs in the production of bags, films, boxes, and sheets is becoming increasingly popular.
  • The shift towards sustainable production methods by manufacturers is another key driver for the market, as they seek to reduce their environmental footprint and meet consumer demand for more responsible business practices. However, the cost effectiveness of conventional plastics remains a challenge for the PHA market, limiting its widespread adoption. In the US, the e-retail business is also showing an interest in PHAs due to their potential to replace traditional plastic packaging materials, providing an opportunity for market growth.

What will be the Polyhydroxyalkanoate Market  Size During the Forecast Period?

Polyhydroxyalkanoate Market Size

 Request Free Sample

  • Polyhydroxyalkanoates (PHAs), a type of biopolymer, have gained significant attention in recent years as potential alternatives to traditional petroleum-based plastics. These environmentally friendly materials offer numerous advantages, making them suitable for various industries, including packaging and food services, biomedical, agriculture, and more. Non-degradable plastics, such as polyvinyl chloride (PVC), have been a major concern due to their negative impact on the environment. As environmental issues continue to rise, the demand for sustainable materials has become increasingly important. PHAs provide an attractive solution, as they are biodegradable and derived from renewable resources.
  • Moreover, PHAs are produced through microbial fermentation, using carbon sources like sugars, lipids, or gases. This production process involves genetic engineering and carbon chains synthesis, which results in the formation of PHA granules within the bacteria. The packaging industry is one of the primary markets for PHAs. Biodegradable mulch films made from PHAs can enhance crop growth and reduce the use of synthetic fertilizers and pesticides. Additionally, PHAs can be used as a carbon source for livestock feed, improving animal health and reducing greenhouse gas emissions. These materials can be used to create various products, such as plastic bags, films, boxes, and sheets, offering flexibility and durability while reducing the environmental footprint.

How is this market segmented and which is the largest segment?

The market research report provides comprehensive data (region-wise segment analysis), with forecasts and estimates in "USD million" for the period 2024-2028, as well as historical data from 2018-2022 for the following segments.

  • Application
    • Packaging
    • Biomedical
    • Food services
    • Agriculture
    • Others
  • Type
    • Copolymerized PHA
    • Linear PHA
  • Geography
    • APAC
      • China
      • India
      • Japan
    • Europe
      • Germany
    • North America
      • US
    • South America
    • Middle East and Africa

By Application Insights

The packaging segment is estimated to witness significant growth during the forecast period. In the global market, the demand for polyhydroxyalkanoate (PHA) is increasing due to regulatory pressures against conventional plastics, particularly in the packaging industry. PHAs are biodegradable polymers that are gaining popularity in the food and beverage (F&B) sector for producing containers and packaging materials. The packaging industry can be segmented into rigid and flexible packaging. Rigid packaging includes bottles, loose-fill, cups, pots, and bowls, while flexible packaging includes films and other products. Biodegradable polymers are used extensively in the F&B industry for packaging fresh food, dry snacks, candy, bakery goods, juice bottles, and meat trays. Additionally, they are used in coatings for beverage cups, films, and card stock.

Polyhydroxyalkanoate Market Size

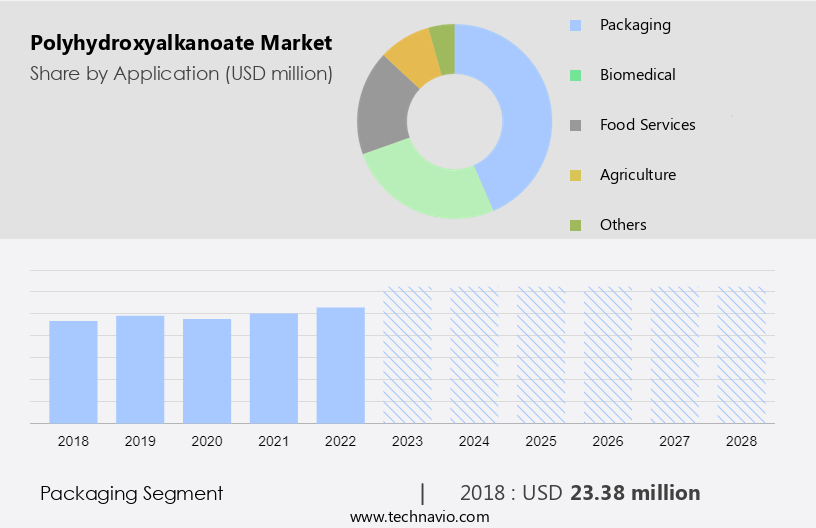
Get a glance at the share of various segments. Request Free Sample

The packaging segment was valued at USD 23.38 million in 2018 and showed a gradual increase during the forecast period.

Regional Analysis

APAC is estimated to contribute 48% to the growth of the global market during the forecast period. Technavio's analysts have elaborately explained the regional trends and drivers that shape the market during the forecast period.

Polyhydroxyalkanoate Market Share by Geography

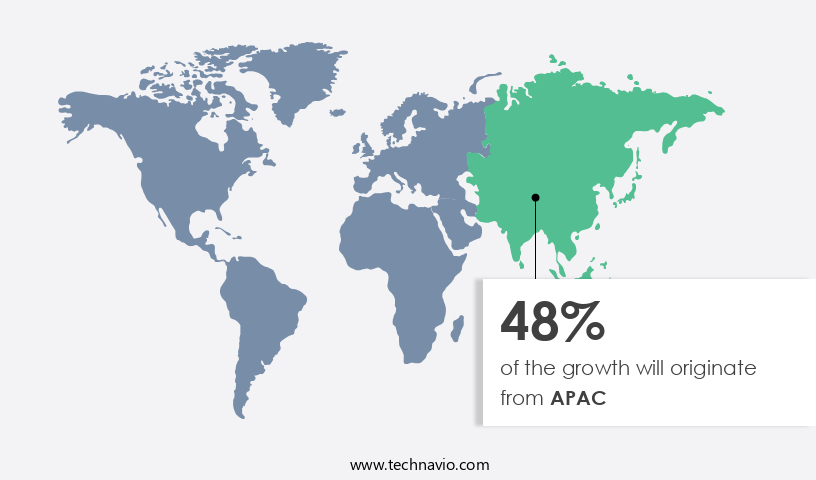
For more insights on the market share of various regions, Request Free Sample

The market in Asia Pacific is poised for substantial expansion over the forecast period. The burgeoning packaging industry and the rise in agricultural activities in this region are key factors fueling the growth of the PHA market. In the packaging sector, the increasing number of e-commerce companies is a significant driver, as these companies seek sustainable alternatives for their packaging needs. Notable e-commerce firms in Asia Pacific are adopting PHA-based plastics due to their biodegradable nature and high-impact strength. PHAs are produced through microbial fermentation and, in recent years, genetic engineering techniques have been employed to enhance the production process. As environmental concerns gain prominence, the demand for eco-friendly biopolymers like PHAs is expected to increase, particularly in industries such as medical, where biocompatibility and biodegradability are crucial. The PHA production technologies continue to evolve, offering opportunities for market expansion.

Market Dynamics

Our researchers analyzed the data with 2023 as the base year, along with the key drivers, trends, and challenges. A holistic analysis of drivers will help companies refine their marketing strategies to gain a competitive advantage.

What are the key market drivers leading to the rise in adoption of Polyhydroxyalkanoate Market?

Increasing demand for biodegradable plastics is the key driver of the market.

  • The shift towards sustainable and eco-friendly packaging solutions has led to a heightened focus on biodegradable materials within the plastics and packaging industries. In response to increasing consumer preferences and stringent government regulations, manufacturers are prioritizing the production of biodegradable plastics. For instance, the UK government's ban on single-use plastic items for businesses in October 2023 is expected to boost demand for PHA-based packaging products. This regulatory initiative may result in penalties for non-compliance, further incentivizing businesses to adopt biodegradable alternatives. Consequently, the global market for polyhydroxyalkanoate (PHA), which includes forms such as PHBH and PHBV, is poised for significant growth during the forecast period.
  • Moreover, these biodegradable plastics offer several advantages, including biodegradability, versatility, and potential for use in various applications, such as in the production of emulsifiers and biofuels. As carbon capture technology gains traction, the potential applications of PHAs expand, further fueling the market growth.

What are the market trends shaping the Polyhydroxyalkanoate Market?

Increasing adoption of sustainable production methods by manufacturers is the upcoming trend in the market.

  • The global market is experiencing significant growth opportunities due to increasing demand for sustainable production methods in the plastic industry. Regulatory pressure on manufacturers to adopt eco-friendly practices is driving this trend, with the packaging and medical industries leading the way. In particular, the use of PHA in packaging applications is anticipated to witness increased demand due to the rising popularity of biodegradable films, compostable waste bags, catering products, film packaging, and rigid packaging.
  • Moreover, the food and beverage sector, a major player in the global industry, is a significant application area for PHAs in packaging. Domestic e-commerce and foreign exports are expected to contribute to the market's expansion as consumers and businesses prioritize sustainability. The adoption of PHA is expected to bring about innovative solutions in the plastic industry while adhering to regulatory requirements.

What challenges does Polyhydroxyalkanoate Market face during the growth?

Cost-effectiveness of conventional plastics over PHAs is a key challenge affecting the market growth.

  • The market faces a significant hurdle in its competition with conventional plastics due to the higher cost of PHAs. The price range for PHAs is between USD 2,500 and USD 5,200 per ton, which is significantly more expensive than traditional plastics. The primary reason for this price disparity is the high polymerization cost of PHAs, as most production processes are still in their development stages. Consequently, the PHA industry has yet to reach the economies of scale necessary to lower production costs. Additionally, the lack of efficient production technologies and the scarcity of feedstock contribute to the increased production cost of PHAs.
  • Moreover, renewable raw materials, such as glucose, used in the manufacturing of PHAs, are becoming increasingly costly, further impeding the market's growth. Despite these challenges, the demand for eco-friendly alternatives to conventional plastics, such as PHAs, is growing, particularly in industries like food processing, flexible packaging, and e-retail businesses. As sustainability becomes a priority for consumers and governments, the market for PHAs is expected to expand. Incorporating PHAs into various applications, such as plastic bags, films, boxes, and sheets, offers numerous benefits, including biodegradability, renewability, and reduced carbon footprint. By investing in research and development, improving production technologies, and securing a steady supply of feedstock, the PHA industry can overcome its cost challenges and meet the growing demand for eco-friendly plastics.

Exclusive Customer Landscape

The market forecasting report includes the adoption lifecycle of the market, covering from the innovator's stage to the laggard's stage. It focuses on adoption rates in different regions based on penetration. Furthermore, the market report also includes key purchase criteria and drivers of price sensitivity to help companies evaluate and develop their market growth analysis strategies.
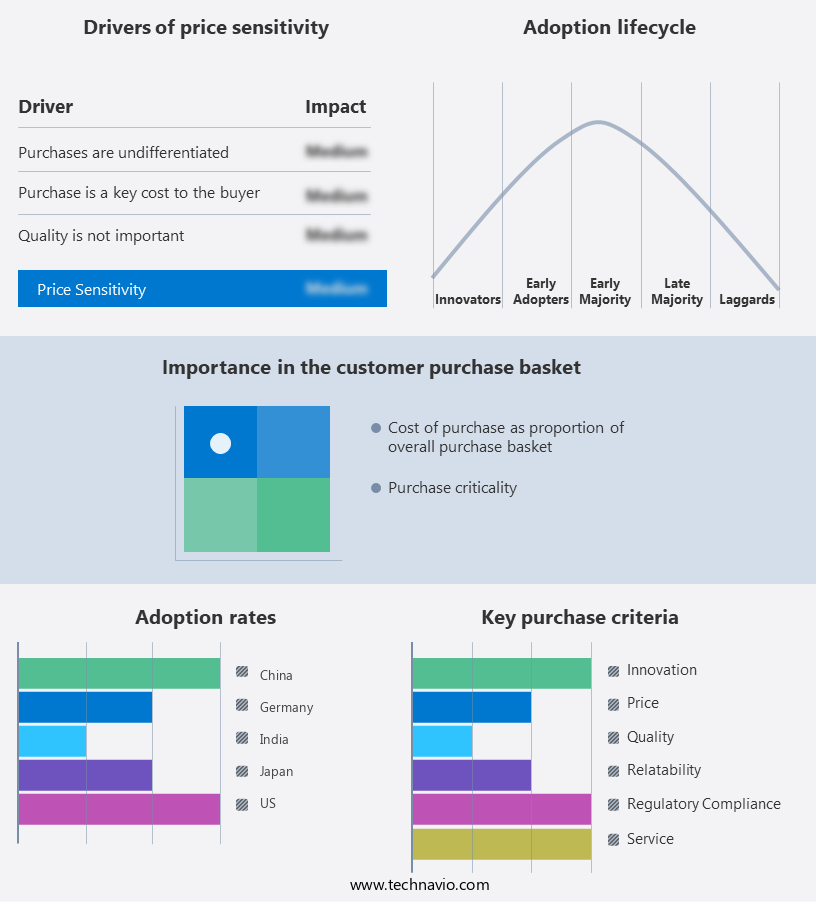
Polyhydroxyalkanoate Market Share by Geography

 Customer Landscape

Key Companies & Market Insights

Companies are implementing various strategies, such as strategic alliances, market forecast, partnerships, mergers and acquisitions, geographical expansion, and product/service launches, to enhance their presence in the market.

The market research and growth report includes detailed analyses of the competitive landscape of the market and information about key companies, including:

  • BASF SE
  • Becton Dickinson and Co.
  • BIO ON spa
  • Bluepha
  • BOSK Bioproducts
  • CJ CheilJedang Corp.
  • Danimer Scientific Inc.
  • Genecis
  • Kaneka Corp.
  • RWDC Industries Ltd.
  • Terraverdae Bioworks Inc.
  • TianAn Biologic Materials Co. Ltd.
  • WinCup
  • Yield10 Bioscience Inc.

Qualitative and quantitative analysis of companies has been conducted to help clients understand the wider business environment as well as the strengths and weaknesses of key market players. Data is qualitatively analyzed to categorize companies as pure play, category-focused, industry-focused, and diversified; it is quantitatively analyzed to categorize companies as dominant, leading, strong, tentative, and weak.

Research Analyst Overview

Polyhydroxyalkanoate (PHA) is a type of biopolymer, produced by microbial fermentation using raw materials like cereals, sugars, and organic waste. It is a promising alternative to non-degradable petroleum-based plastics, offering environmental benefits as it is biodegradable. PHA finds applications in various sectors, including packaging & food services, biomedical, and agriculture. In packaging, PHA is used to manufacture plastic bags, films, boxes, and sheets. In the biomedical industry, it is used to produce medical devices, implants, and pharmaceuticals to address genetic disorders such as ulcers, deafness, and vision impairment. PHA is also used in agriculture as a biofertilizer and in waste management practices to convert biomass, dead plants, and waste residues into valuable products.

Moreover, the production of PHA involves the polymerization process of monomers like PHB and PHV, which have different melting points and properties. PHA is also used in the production of biofuels and emulsifiers, and its commercialization is driven by consumer awareness and environmental concerns. PHA production technologies include microbial fermentation and genetic engineering, and the market is expected to grow due to the increasing demand for eco-friendly materials in various industries.

Market Scope

Report Coverage

Details

Page number

166

Base year

2023

Historic period

2018-2022

Forecast period

2024-2028

Growth momentum & CAGR

Accelerate at a CAGR of 6.31%

Market growth 2024-2028

USD 26.9 million

Market structure

Concentrated

YoY growth 2023-2024(%)

5.92

Key countries

US, China, Japan, India, and Germany

Competitive landscape

Leading Companies, Market Positioning of Companies, Competitive Strategies, and Industry Risks

Request Free Sample

What are the Key Data Covered in this Market Research and Growth Report?

  • CAGR of the market during the forecast period
  • Detailed information on factors that will drive the market growth and forecasting between 2024 and 2028
  • Precise estimation of the size of the market  and its contribution of the market in focus to the parent market
  • Accurate predictions about upcoming market growth and trends and changes in consumer behaviour
  • Growth of the market across APAC, Europe, North America, South America, and Middle East and Africa
  • Thorough analysis of the market's competitive landscape and detailed information about companies
  • Comprehensive analysis of factors that will challenge the growth of market companies

We can help! Our analysts can customize this market research report to meet your requirements. Get in touch

1 Executive Summary

  • 1.1 Market overview
    • Exhibit 01: Executive Summary – Chart on Market Overview
    • Exhibit 02: Executive Summary – Data Table on Market Overview
    • Exhibit 03: Executive Summary – Chart on Global Market Characteristics
    • Exhibit 04: Executive Summary – Chart on Market by Geography
    • Exhibit 05: Executive Summary – Chart on Market Segmentation by Application
    • Exhibit 06: Executive Summary – Chart on Market Segmentation by Type
    • Exhibit 07: Executive Summary – Chart on Incremental Growth
    • Exhibit 08: Executive Summary – Data Table on Incremental Growth
    • Exhibit 09: Executive Summary – Chart on Vendor Market Positioning

2 Market Landscape

  • 2.1 Market ecosystem
    • Exhibit 10: Parent market
    • Exhibit 11: Market Characteristics

3 Market Sizing

  • 3.1 Market definition
    • Exhibit 12: Offerings of vendors included in the market definition
  • 3.2 Market segment analysis
    • Exhibit 13: Market segments
  • 3.3 Market size 2023
    • 3.4 Market outlook: Forecast for 2023-2028
      • Exhibit 14: Chart on Global - Market size and forecast 2023-2028 ($ million)
      • Exhibit 15: Data Table on Global - Market size and forecast 2023-2028 ($ million)
      • Exhibit 16: Chart on Global Market: Year-over-year growth 2023-2028 (%)
      • Exhibit 17: Data Table on Global Market: Year-over-year growth 2023-2028 (%)

    4 Historic Market Size

    • 4.1 Global polyhydroxyalkanoate market 2018 - 2022
      • Exhibit 18: Historic Market Size – Data Table on global polyhydroxyalkanoate market 2018 - 2022 ($ million)
    • 4.2 Application Segment Analysis 2018 - 2022
      • Exhibit 19: Historic Market Size – Application Segment 2018 - 2022 ($ million)
    • 4.3 Type Segment Analysis 2018 - 2022
      • Exhibit 20: Historic Market Size – Type Segment 2018 - 2022 ($ million)
    • 4.4 Geography Segment Analysis 2018 - 2022
      • Exhibit 21: Historic Market Size – Geography Segment 2018 - 2022 ($ million)
    • 4.5 Country Segment Analysis 2018 - 2022
      • Exhibit 22: Historic Market Size – Country Segment 2018 - 2022 ($ million)

    5 Five Forces Analysis

    • 5.1 Five forces summary
      • Exhibit 23: Five forces analysis - Comparison between 2023 and 2028
    • 5.2 Bargaining power of buyers
      • Exhibit 24: Chart on Bargaining power of buyers – Impact of key factors 2023 and 2028
    • 5.3 Bargaining power of suppliers
      • Exhibit 25: Bargaining power of suppliers – Impact of key factors in 2023 and 2028
    • 5.4 Threat of new entrants
      • Exhibit 26: Threat of new entrants – Impact of key factors in 2023 and 2028
    • 5.5 Threat of substitutes
      • Exhibit 27: Threat of substitutes – Impact of key factors in 2023 and 2028
    • 5.6 Threat of rivalry
      • Exhibit 28: Threat of rivalry – Impact of key factors in 2023 and 2028
    • 5.7 Market condition
      • Exhibit 29: Chart on Market condition - Five forces 2023 and 2028

    6 Market Segmentation by Application

    • 6.1 Market segments
      • Exhibit 30: Chart on Application - Market share 2023-2028 (%)
      • Exhibit 31: Data Table on Application - Market share 2023-2028 (%)
    • 6.2 Comparison by Application
      • Exhibit 32: Chart on Comparison by Application
      • Exhibit 33: Data Table on Comparison by Application
    • 6.3 Packaging - Market size and forecast 2023-2028
      • Exhibit 34: Chart on Packaging - Market size and forecast 2023-2028 ($ million)
      • Exhibit 35: Data Table on Packaging - Market size and forecast 2023-2028 ($ million)
      • Exhibit 36: Chart on Packaging - Year-over-year growth 2023-2028 (%)
      • Exhibit 37: Data Table on Packaging - Year-over-year growth 2023-2028 (%)
    • 6.4 Biomedical - Market size and forecast 2023-2028
      • Exhibit 38: Chart on Biomedical - Market size and forecast 2023-2028 ($ million)
      • Exhibit 39: Data Table on Biomedical - Market size and forecast 2023-2028 ($ million)
      • Exhibit 40: Chart on Biomedical - Year-over-year growth 2023-2028 (%)
      • Exhibit 41: Data Table on Biomedical - Year-over-year growth 2023-2028 (%)
    • 6.5 Food services - Market size and forecast 2023-2028
      • Exhibit 42: Chart on Food services - Market size and forecast 2023-2028 ($ million)
      • Exhibit 43: Data Table on Food services - Market size and forecast 2023-2028 ($ million)
      • Exhibit 44: Chart on Food services - Year-over-year growth 2023-2028 (%)
      • Exhibit 45: Data Table on Food services - Year-over-year growth 2023-2028 (%)
    • 6.6 Agriculture - Market size and forecast 2023-2028
      • Exhibit 46: Chart on Agriculture - Market size and forecast 2023-2028 ($ million)
      • Exhibit 47: Data Table on Agriculture - Market size and forecast 2023-2028 ($ million)
      • Exhibit 48: Chart on Agriculture - Year-over-year growth 2023-2028 (%)
      • Exhibit 49: Data Table on Agriculture - Year-over-year growth 2023-2028 (%)
    • 6.7 Others - Market size and forecast 2023-2028
      • Exhibit 50: Chart on Others - Market size and forecast 2023-2028 ($ million)
      • Exhibit 51: Data Table on Others - Market size and forecast 2023-2028 ($ million)
      • Exhibit 52: Chart on Others - Year-over-year growth 2023-2028 (%)
      • Exhibit 53: Data Table on Others - Year-over-year growth 2023-2028 (%)
    • 6.8 Market opportunity by Application
      • Exhibit 54: Market opportunity by Application ($ million)
      • Exhibit 55: Data Table on Market opportunity by Application ($ million)

    7 Market Segmentation by Type

    • 7.1 Market segments
      • Exhibit 56: Chart on Type - Market share 2023-2028 (%)
      • Exhibit 57: Data Table on Type - Market share 2023-2028 (%)
    • 7.2 Comparison by Type
      • Exhibit 58: Chart on Comparison by Type
      • Exhibit 59: Data Table on Comparison by Type
    • 7.3 Copolymerized PHA - Market size and forecast 2023-2028
      • Exhibit 60: Chart on Copolymerized PHA - Market size and forecast 2023-2028 ($ million)
      • Exhibit 61: Data Table on Copolymerized PHA - Market size and forecast 2023-2028 ($ million)
      • Exhibit 62: Chart on Copolymerized PHA - Year-over-year growth 2023-2028 (%)
      • Exhibit 63: Data Table on Copolymerized PHA - Year-over-year growth 2023-2028 (%)
    • 7.4 Linear PHA - Market size and forecast 2023-2028
      • Exhibit 64: Chart on Linear PHA - Market size and forecast 2023-2028 ($ million)
      • Exhibit 65: Data Table on Linear PHA - Market size and forecast 2023-2028 ($ million)
      • Exhibit 66: Chart on Linear PHA - Year-over-year growth 2023-2028 (%)
      • Exhibit 67: Data Table on Linear PHA - Year-over-year growth 2023-2028 (%)
    • 7.5 Market opportunity by Type
      • Exhibit 68: Market opportunity by Type ($ million)
      • Exhibit 69: Data Table on Market opportunity by Type ($ million)

    8 Customer Landscape

    • 8.1 Customer landscape overview
      • Exhibit 70: Analysis of price sensitivity, lifecycle, customer purchase basket, adoption rates, and purchase criteria

    9 Geographic Landscape

    • 9.1 Geographic segmentation
      • Exhibit 71: Chart on Market share by geography 2023-2028 (%)
      • Exhibit 72: Data Table on Market share by geography 2023-2028 (%)
    • 9.2 Geographic comparison
      • Exhibit 73: Chart on Geographic comparison
      • Exhibit 74: Data Table on Geographic comparison
    • 9.3 APAC - Market size and forecast 2023-2028
      • Exhibit 75: Chart on APAC - Market size and forecast 2023-2028 ($ million)
      • Exhibit 76: Data Table on APAC - Market size and forecast 2023-2028 ($ million)
      • Exhibit 77: Chart on APAC - Year-over-year growth 2023-2028 (%)
      • Exhibit 78: Data Table on APAC - Year-over-year growth 2023-2028 (%)
    • 9.4 Europe - Market size and forecast 2023-2028
      • Exhibit 79: Chart on Europe - Market size and forecast 2023-2028 ($ million)
      • Exhibit 80: Data Table on Europe - Market size and forecast 2023-2028 ($ million)
      • Exhibit 81: Chart on Europe - Year-over-year growth 2023-2028 (%)
      • Exhibit 82: Data Table on Europe - Year-over-year growth 2023-2028 (%)
    • 9.5 North America - Market size and forecast 2023-2028
      • Exhibit 83: Chart on North America - Market size and forecast 2023-2028 ($ million)
      • Exhibit 84: Data Table on North America - Market size and forecast 2023-2028 ($ million)
      • Exhibit 85: Chart on North America - Year-over-year growth 2023-2028 (%)
      • Exhibit 86: Data Table on North America - Year-over-year growth 2023-2028 (%)
    • 9.6 South America - Market size and forecast 2023-2028
      • Exhibit 87: Chart on South America - Market size and forecast 2023-2028 ($ million)
      • Exhibit 88: Data Table on South America - Market size and forecast 2023-2028 ($ million)
      • Exhibit 89: Chart on South America - Year-over-year growth 2023-2028 (%)
      • Exhibit 90: Data Table on South America - Year-over-year growth 2023-2028 (%)
    • 9.7 Middle East and Africa - Market size and forecast 2023-2028
      • Exhibit 91: Chart on Middle East and Africa - Market size and forecast 2023-2028 ($ million)
      • Exhibit 92: Data Table on Middle East and Africa - Market size and forecast 2023-2028 ($ million)
      • Exhibit 93: Chart on Middle East and Africa - Year-over-year growth 2023-2028 (%)
      • Exhibit 94: Data Table on Middle East and Africa - Year-over-year growth 2023-2028 (%)
    • 9.8 China - Market size and forecast 2023-2028
      • Exhibit 95: Chart on China - Market size and forecast 2023-2028 ($ million)
      • Exhibit 96: Data Table on China - Market size and forecast 2023-2028 ($ million)
      • Exhibit 97: Chart on China - Year-over-year growth 2023-2028 (%)
      • Exhibit 98: Data Table on China - Year-over-year growth 2023-2028 (%)
    • 9.9 US - Market size and forecast 2023-2028
      • Exhibit 99: Chart on US - Market size and forecast 2023-2028 ($ million)
      • Exhibit 100: Data Table on US - Market size and forecast 2023-2028 ($ million)
      • Exhibit 101: Chart on US - Year-over-year growth 2023-2028 (%)
      • Exhibit 102: Data Table on US - Year-over-year growth 2023-2028 (%)
    • 9.10 Germany - Market size and forecast 2023-2028
      • Exhibit 103: Chart on Germany - Market size and forecast 2023-2028 ($ million)
      • Exhibit 104: Data Table on Germany - Market size and forecast 2023-2028 ($ million)
      • Exhibit 105: Chart on Germany - Year-over-year growth 2023-2028 (%)
      • Exhibit 106: Data Table on Germany - Year-over-year growth 2023-2028 (%)
    • 9.11 Japan - Market size and forecast 2023-2028
      • Exhibit 107: Chart on Japan - Market size and forecast 2023-2028 ($ million)
      • Exhibit 108: Data Table on Japan - Market size and forecast 2023-2028 ($ million)
      • Exhibit 109: Chart on Japan - Year-over-year growth 2023-2028 (%)
      • Exhibit 110: Data Table on Japan - Year-over-year growth 2023-2028 (%)
    • 9.12 India - Market size and forecast 2023-2028
      • Exhibit 111: Chart on India - Market size and forecast 2023-2028 ($ million)
      • Exhibit 112: Data Table on India - Market size and forecast 2023-2028 ($ million)
      • Exhibit 113: Chart on India - Year-over-year growth 2023-2028 (%)
      • Exhibit 114: Data Table on India - Year-over-year growth 2023-2028 (%)
    • 9.13 Market opportunity by geography
      • Exhibit 115: Market opportunity by geography ($ million)
      • Exhibit 116: Data Tables on Market opportunity by geography ($ million)

    10 Drivers, Challenges, and Trends

    • 10.1 Market drivers
      • 10.2 Market challenges
        • 10.3 Impact of drivers and challenges
          • Exhibit 117: Impact of drivers and challenges in 2023 and 2028
        • 10.4 Market trends

          11 Vendor Landscape

          • 11.1 Overview
            • 11.2 Vendor landscape
              • Exhibit 118: Overview on Criticality of inputs and Factors of differentiation
            • 11.3 Landscape disruption
              • Exhibit 119: Overview on factors of disruption
            • 11.4 Industry risks
              • Exhibit 120: Impact of key risks on business

            12 Vendor Analysis

            • 12.1 Vendors covered
              • Exhibit 121: Vendors covered
            • 12.2 Market positioning of vendors
              • Exhibit 122: Matrix on vendor position and classification
            • 12.3 BASF SE
              • Exhibit 123: BASF SE - Overview
              • Exhibit 124: BASF SE - Business segments
              • Exhibit 125: BASF SE - Key news
              • Exhibit 126: BASF SE - Key offerings
              • Exhibit 127: BASF SE - Segment focus
            • 12.4 Becton Dickinson and Co.
              • Exhibit 128: Becton Dickinson and Co. - Overview
              • Exhibit 129: Becton Dickinson and Co. - Business segments
              • Exhibit 130: Becton Dickinson and Co. - Key news
              • Exhibit 131: Becton Dickinson and Co. - Key offerings
              • Exhibit 132: Becton Dickinson and Co. - Segment focus
            • 12.5 BIO ON spa
              • Exhibit 133: BIO ON spa - Overview
              • Exhibit 134: BIO ON spa - Product / Service
              • Exhibit 135: BIO ON spa - Key offerings
            • 12.6 Bluepha
              • Exhibit 136: Bluepha - Overview
              • Exhibit 137: Bluepha - Product / Service
              • Exhibit 138: Bluepha - Key offerings
            • 12.7 BOSK Bioproducts
              • Exhibit 139: BOSK Bioproducts - Overview
              • Exhibit 140: BOSK Bioproducts - Product / Service
              • Exhibit 141: BOSK Bioproducts - Key offerings
            • 12.8 CJ CheilJedang Corp.
              • Exhibit 142: CJ CheilJedang Corp. - Overview
              • Exhibit 143: CJ CheilJedang Corp. - Business segments
              • Exhibit 144: CJ CheilJedang Corp. - Key offerings
              • Exhibit 145: CJ CheilJedang Corp. - Segment focus
            • 12.9 Danimer Scientific Inc.
              • Exhibit 146: Danimer Scientific Inc. - Overview
              • Exhibit 147: Danimer Scientific Inc. - Product / Service
              • Exhibit 148: Danimer Scientific Inc. - Key offerings
            • 12.10 Genecis
              • Exhibit 149: Genecis - Overview
              • Exhibit 150: Genecis - Product / Service
              • Exhibit 151: Genecis - Key offerings
            • 12.11 Kaneka Corp.
              • Exhibit 152: Kaneka Corp. - Overview
              • Exhibit 153: Kaneka Corp. - Business segments
              • Exhibit 154: Kaneka Corp. - Key offerings
              • Exhibit 155: Kaneka Corp. - Segment focus
            • 12.12 RWDC Industries Ltd.
              • Exhibit 156: RWDC Industries Ltd. - Overview
              • Exhibit 157: RWDC Industries Ltd. - Product / Service
              • Exhibit 158: RWDC Industries Ltd. - Key offerings
            • 12.13 Terraverdae Bioworks Inc.
              • Exhibit 159: Terraverdae Bioworks Inc. - Overview
              • Exhibit 160: Terraverdae Bioworks Inc. - Product / Service
              • Exhibit 161: Terraverdae Bioworks Inc. - Key offerings
            • 12.14 TianAn Biologic Materials Co. Ltd.
              • Exhibit 162: TianAn Biologic Materials Co. Ltd. - Overview
              • Exhibit 163: TianAn Biologic Materials Co. Ltd. - Product / Service
              • Exhibit 164: TianAn Biologic Materials Co. Ltd. - Key offerings
            • 12.15 WinCup
              • Exhibit 165: WinCup - Overview
              • Exhibit 166: WinCup - Product / Service
              • Exhibit 167: WinCup - Key offerings
            • 12.16 Yield10 Bioscience Inc.
              • Exhibit 168: Yield10 Bioscience Inc. - Overview
              • Exhibit 169: Yield10 Bioscience Inc. - Product / Service
              • Exhibit 170: Yield10 Bioscience Inc. - Key offerings

            13 Appendix

            • 13.1 Scope of the report
              • 13.2 Inclusions and exclusions checklist
                • Exhibit 171: Inclusions checklist
                • Exhibit 172: Exclusions checklist
              • 13.3 Currency conversion rates for US$
                • Exhibit 173: Currency conversion rates for US$
              • 13.4 Research methodology
                • Exhibit 174: Research methodology
                • Exhibit 175: Validation techniques employed for market sizing
                • Exhibit 176: Information sources
              • 13.5 List of abbreviations
                • Exhibit 177: List of abbreviations

              Research Methodology

              Technavio presents a detailed picture of the market by way of study, synthesis, and summation of data from multiple sources. The analysts have presented the various facets of the market with a particular focus on identifying the key industry influencers. The data thus presented is comprehensive, reliable, and the result of extensive research, both primary and secondary.

              INFORMATION SOURCES

              Primary sources

              • Manufacturers and suppliers
              • Channel partners
              • Industry experts
              • Strategic decision makers

              Secondary sources

              • Industry journals and periodicals
              • Government data
              • Financial reports of key industry players
              • Historical data
              • Press releases

              DATA ANALYSIS

              Data Synthesis

              • Collation of data
              • Estimation of key figures
              • Analysis of derived insights

              Data Validation

              • Triangulation with data models
              • Reference against proprietary databases
              • Corroboration with industry experts

              REPORT WRITING

              Qualitative

              • Market drivers
              • Market challenges
              • Market trends
              • Five forces analysis

              Quantitative

              • Market size and forecast
              • Market segmentation
              • Geographical insights
              • Competitive landscape

              Interested in this report?

              Get your sample now to see our research methodology and insights!

              Download Now

              Frequently Asked Questions

              Polyhydroxyalkanoate market growth will increase by $ 26.9 mn during 2024-2028.

              The Polyhydroxyalkanoate market is expected to grow at a CAGR of 6.31% during 2024-2028.

              Polyhydroxyalkanoate market is segmented by Application( Packaging, Biomedical, Food services, Agriculture, Others) Type( Copolymerized PHA, Linear PHA, Food service, Agriculture, Others)

              BASF SE, Becton Dickinson and Co., BIO ON spa, Bluepha, BOSK Bioproducts, CJ CheilJedang Corp., Danimer Scientific Inc., Genecis, Kaneka Corp., RWDC Industries Ltd., Terraverdae Bioworks Inc., TianAn Biologic Materials Co. Ltd., WinCup, Yield10 Bioscience Inc. are a few of the key vendors in the Polyhydroxyalkanoate market.

              APAC will register the highest growth rate of 48% among the other regions. Therefore, the Polyhydroxyalkanoate market in APAC is expected to garner significant business opportunities for the vendors during the forecast period.

              US, China, Japan, India, Germany

              • Increasing demand for biodegradable plasticsDue to the increasing demand for eco-friendly packaging from various consumers is the driving factor this market.
              • major plastics and packaging manufacturers are opting for biodegradable materials. Vendors are focusing more on manufacturing biodegradable plastics due to the rising government regulations regarding the use of plastic products. For instance is the driving factor this market.
              • in October 2023 is the driving factor this market.
              • the UK government banned the use of single-use plastic items for businesses such as shops is the driving factor this market.
              • restaurants and takeaways across England. The businesses could face fines and criminal charges if they dont comply with the new rules. Such an initiative by the government can increase demand for PHA based packaging products is the driving factor this market.
              • and hence is the driving factor this market.
              • is expected to drive the growth of the global polyhydroxyalkanoate market during the forecast period. The global biodegradable plastics market is driven by the emergence of renewable resources such as biomass and bio-based raw materials. Bio-based materials is the driving factor this market.
              • including starch and vegetable crop derivatives is the driving factor this market.
              • are used in the manufacturing of plastics. The use of biodegradable plastics in numerous applications is the driving factor this market.
              • such as packaging and domestic goods is the driving factor this market.
              • has encouraged plastic manufacturers to reduce their over-dependence on petroleum-based plastic products. Hence is the driving factor this market.
              • plastic manufacturers are using eco-friendly raw materials such as PHAs is the driving factor this market.
              • which are biodegradable and thermoplastic in nature. PHAs are thermoplastic materials manufactured from the bacterial fermentation of sugar or lipids. These thermoplastic materials are used in various applications across several sectors is the driving factor this market.
              • such as packaging is the driving factor this market.
              • medical is the driving factor this market.
              • and industrial. The use of PHAs in these applications has encouraged plastic manufacturers to use bio-based plastics. Raw materials used in biodegradable plastic production are renewable in origin is the driving factor this market.
              • and the supply is abundant as compared to petroleum and fossil raw materials across the globe. Therefore is the driving factor this market.
              • the global outlook for bio-based raw materials for plastics is significantly higher when it is compared to that of petroleum-based raw materials. The increasing demand for bioplastics will drive the demand for PHAs and thereby will accelerate the growth of the global polyhydroxyalkanoate market during the forecast period. is the driving factor this market.

              The Polyhydroxyalkanoate market vendors should focus on grabbing business opportunities from the Packaging segment as it accounted for the largest market share in the base year.
              RIA - Research AI Assistant
              Ask RIA