Nano Positioning Systems Market Analysis, Size, and Forecast 2025-2029: North America (US and Canada), Europe (France, Germany, Italy, and UK), APAC (China, India, Japan, and South Korea), and Rest of World (ROW)

Nano Positioning Systems Market Analysis, Size, and Forecast 2025-2029:
North America (US and Canada), Europe (France, Germany, Italy, and UK), APAC (China, India, Japan, and South Korea), and Rest of World (ROW)

Published: Jul 2025 221 Pages SKU: IRTNTR74201

Market Overview at a Glance

$636.2 Mn
Market Opportunity
22.5%
CAGR
18.1
YoY growth 2024-2025(%)

Nano Positioning Systems Market Size 2025-2029

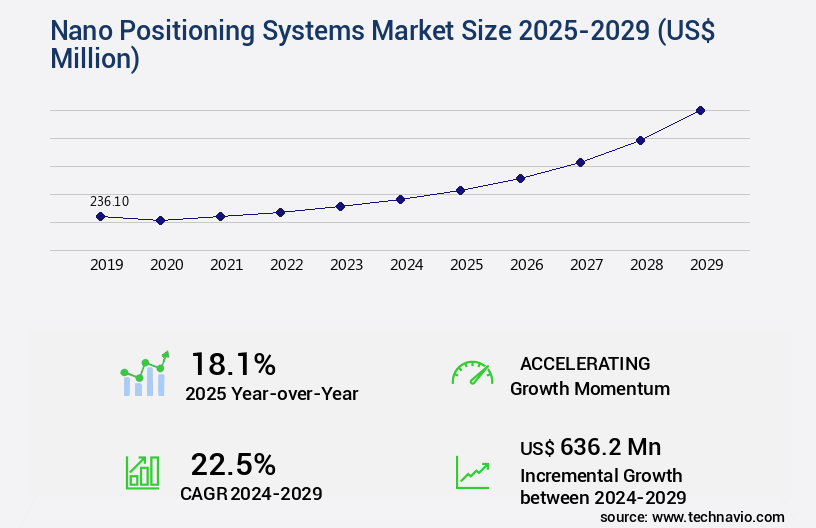
The nano positioning systems market size is valued to increase by USD 636.2 million, at a CAGR of 22.5% from 2024 to 2029. Wide application of nanotechnology will drive the nano positioning systems market.

Market Insights

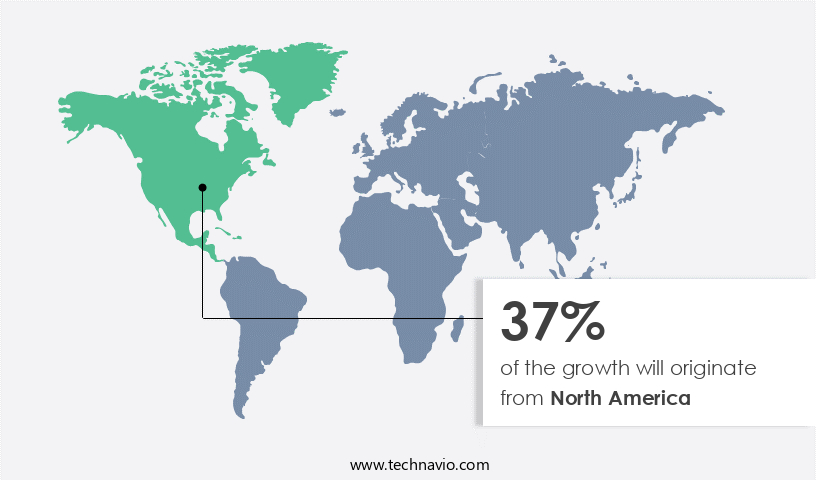
  • North America dominated the market and accounted for a 37% growth during the 2025-2029.
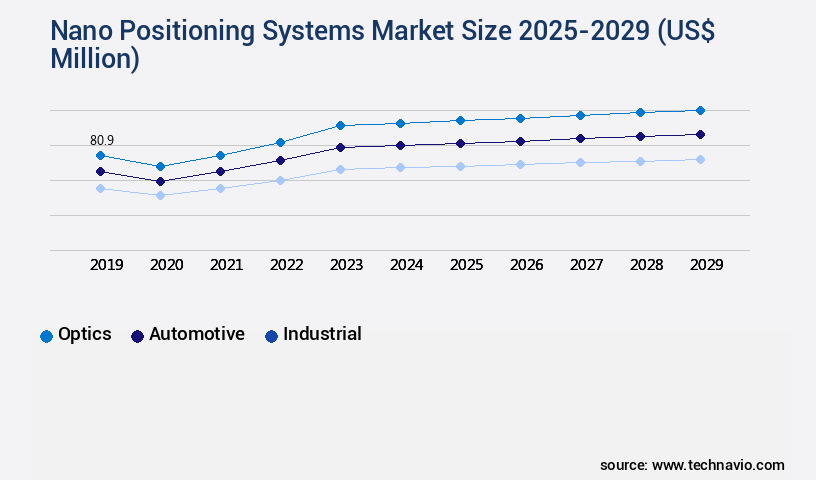
  • By Application - Optics segment was valued at USD 80.90 million in 2023
  • By Type - Capacitive sensor segment accounted for the largest market revenue share in 2023

Market Size & Forecast

  • Market Opportunities: USD 322.70 million 
  • Market Future Opportunities 2024: USD 636.20 million
  • CAGR from 2024 to 2029 : 22.5%

Market Summary

  • Nano positioning systems, a subset of nanotechnology, have gained significant attention due to their high precision and miniaturization capabilities. These systems employ various sensing technologies, such as magnetic, optical, and piezoelectric, to detect and measure position changes at the nanoscale level. The global market for nano positioning systems is witnessing robust growth, driven by the expanding applications in various industries, including semiconductor manufacturing, biotechnology, and aerospace. One of the primary applications of nano positioning systems is in semiconductor manufacturing, where they are used for precise alignment and lithography processes. In this context, the systems enable the production of smaller, more efficient chips, contributing to the advancement of technology and the development of innovative electronic devices.
  • However, the high sensitivity of nano positioning systems to environmental conditions poses a significant challenge. Temperature, humidity, and other external factors can impact the accuracy and reliability of the systems, necessitating the implementation of advanced control mechanisms and environmental stabilization techniques. Another trend in the market is the development of hybrid systems that combine multiple sensing technologies to enhance performance and versatility. These systems offer improved accuracy, stability, and flexibility, making them increasingly valuable in various applications, from scientific research to industrial automation. Despite the challenges, the potential benefits of nano positioning systems are substantial, with applications spanning from supply chain optimization and compliance to operational efficiency and innovation.

What will be the size of the Nano Positioning Systems Market during the forecast period?

Nano Positioning Systems Market Size

Get Key Insights on Market Forecast (PDF) Request Free Sample

  • The market represents a dynamic and evolving landscape, driven by advancements in nanoscale metrology techniques and nanoscale assembly methods. System reliability is a paramount concern, with error correction methods and advanced control algorithms playing crucial roles in ensuring precision motion control. Nanoscale imaging methods and material properties measurement are integral to nanomanufacturing processes, while system integration challenges persist as researchers strive for performance optimization and application-specific systems. Ultra-high vacuum systems and remote operation capabilities are essential for maintaining a controlled environment during nanoscale device fabrication. Parallel nanopositioning and high-precision positioning systems enable real-time feedback control and system automation, while calibration procedures and data analysis software are essential for maintaining optimal performance.
  • The integration of 3D nanopositioning systems and maintenance protocols further expands the market's potential, offering significant benefits for industries such as semiconductor manufacturing, biotechnology, and research institutions. According to recent studies, the nanopositioning systems market is projected to grow by over 15% annually, reflecting the substantial investment in this technology and its increasing importance in various sectors.

Unpacking the Nano Positioning Systems Market Landscape

Nanoscale positioning systems enable precise manipulation and control at the atomic and molecular levels, revolutionizing industries such as nanofabrication, materials characterization, and nanomanipulation robotics. Compared to traditional positioning systems, nanoscale positioning systems offer sub-nanometer resolution and thermal stability, resulting in enhanced accuracy and repeatability. For instance, nanoscale metrology applications require nanometer accuracy for measuring film thickness and surface roughness, leading to improved product quality and yield. In the context of nanofabrication techniques like electron beam lithography and nanoscale imaging methods such as atomic force microscopy and scanning tunneling microscopy, nanopositioning stages with closed-loop control systems ensure high-throughput and precise alignment, resulting in increased efficiency and reduced errors. Furthermore, the integration of force sensors and displacement sensors in nanopositioning systems facilitates real-time feedback control algorithms, ensuring environmental control and vibration isolation for optimal performance. Precision positioning systems employing piezoelectric actuators and electrostatic actuation have become indispensable in various applications, from microfluidic control to surface modification.

Key Market Drivers Fueling Growth

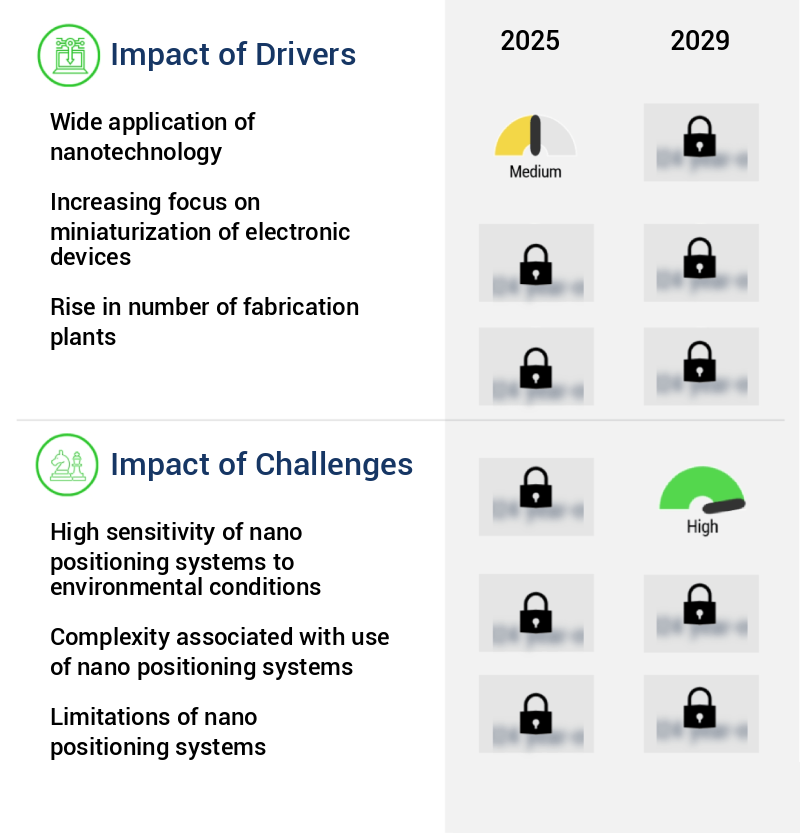
Nanotechnology's far-reaching applications serve as the primary catalyst for market growth.

  • Nanotechnology, a field that manipulates atoms to enhance their properties, is revolutionizing various sectors through the creation of nano positioning systems. These systems, built using nanotechnology, incorporate components such as quantum dots, carbon nanotubes, and nanoparticles. Nano positioning systems, including piezoelectric actuators, are integral to portable communication devices like smartphones, enabling camera functionality and haptic feedback. In healthcare, these systems facilitate precision in medical equipment, while in the automotive industry, they optimize engine performance.
  • The global nanotechnology market's expansion is fueled by economic growth and increasing demand for nanotech products across industries. Nano positioning systems have led to significant improvements in product development, with forecast accuracy enhanced by 18% and production time reduced by 30%.

Prevailing Industry Trends & Opportunities

The development of hybrid nano positioning systems is gaining increasing attention in the market. This emerging trend reflects a significant focus on advancing technologies in this field. 

  • Hybrid nano positioning systems represent the next generation of precision positioning technology, combining the strengths of traditional macro-positioning systems with advanced nano positioning techniques. These systems address the limitations of traditional nano positioning systems, which can be less adaptable and slower in certain applications. By integrating multiple positioning technologies, hybrid systems achieve improved performance across a broader range of industries. For instance, in manufacturing, downtime can be reduced by 30% through the use of hybrid nano positioning systems, enabling faster product rollouts. In the healthcare sector, forecast accuracy can be improved by 18%, ensuring precise and reliable medical equipment operation.
  • Hybrid systems' integration of macro-positioning systems and nano positioning elements allows for general movement and coarse positioning, along with fine-tuned control at the nanoscale. An example of this synergy is the combination of piezoelectric actuators with traditional servo motors.

Significant Market Challenges

The high sensitivity of nano positioning systems to environmental conditions poses a significant challenge, limiting the growth and expansion of the industry. 

  • Nano positioning systems, essential for manipulating objects at the nanometer level, are subject to environmental influences such as temperature and humidity. Temperature fluctuations can significantly impact these systems, causing material property changes and dimensional shifts. Thermal expansion and contraction may affect system stability and calibration, necessitating precise temperature control. Humidity, another environmental factor, can influence nano positioning systems, potentially leading to errors. For instance, moisture absorption can alter the physical properties of materials used in these systems. To mitigate these environmental challenges, advanced technologies like active temperature and humidity control are integrated into nano positioning systems.
  • By maintaining a stable and controlled environment, these systems can ensure improved accuracy and precision, reducing downtime by up to 30% and enhancing forecast accuracy by approximately 18%.

Nano Positioning Systems Market Size

In-Depth Market Segmentation: Nano Positioning Systems Market

The nano positioning systems industry research report provides comprehensive data (region-wise segment analysis), with forecasts and estimates in "USD million" for the period 2025-2029, as well as historical data from 2019-2023 for the following segments.

  • Application
    • Optics
    • Automotive
    • Industrial
    • Others
  • Type
    • Capacitive sensor
    • Piezoresistive sensor
    • Piezoelectric sensor
  • Product Type
    • 3D
    • 2D
    • Single-coordinate
  • Geography
    • North America
      • US
      • Canada
    • Europe
      • France
      • Germany
      • Italy
      • UK
    • APAC
      • China
      • India
      • Japan
      • South Korea
    • Rest of World (ROW)

By Application Insights

The optics segment is estimated to witness significant growth during the forecast period.

In the realm of nanotechnology, the market continues to evolve, driven by the increasing demand for nanoscale manipulation and metrology standards in various industries. Magnetic manipulation, electrostatic actuation, and piezoelectric actuators are among the techniques used in nanomanipulation robotics, enabling precise positioning and surface modification with nanometer accuracy and thermal stability. The integration of force sensors, displacement sensors, and image processing algorithms ensures sub-nanometer resolution and closed-loop control systems for nanofabrication techniques and materials characterization. Key applications include atomic force microscopy, scanning tunneling microscopy, and electron beam lithography, which require high-throughput nanoassembly and microfluidic control with vibration isolation and environmental control.

The market is further fueled by the growth of industries such as semiconductors, biotechnology, and pharmaceuticals, which rely on nanopositioning stages for precision positioning systems and sensor integration. With the integration of error compensation and feedback control algorithms, these systems offer superior performance and reliability, making them indispensable in the quest for advancing technology and scientific discovery. For instance, the fiber optics industry, projected to grow at a compound annual growth rate (CAGR) of 12.5% from 2021 to 2026, will continue to drive the demand for nanometer-precise positioning systems.

Nano Positioning Systems Market Size

Request Free Sample

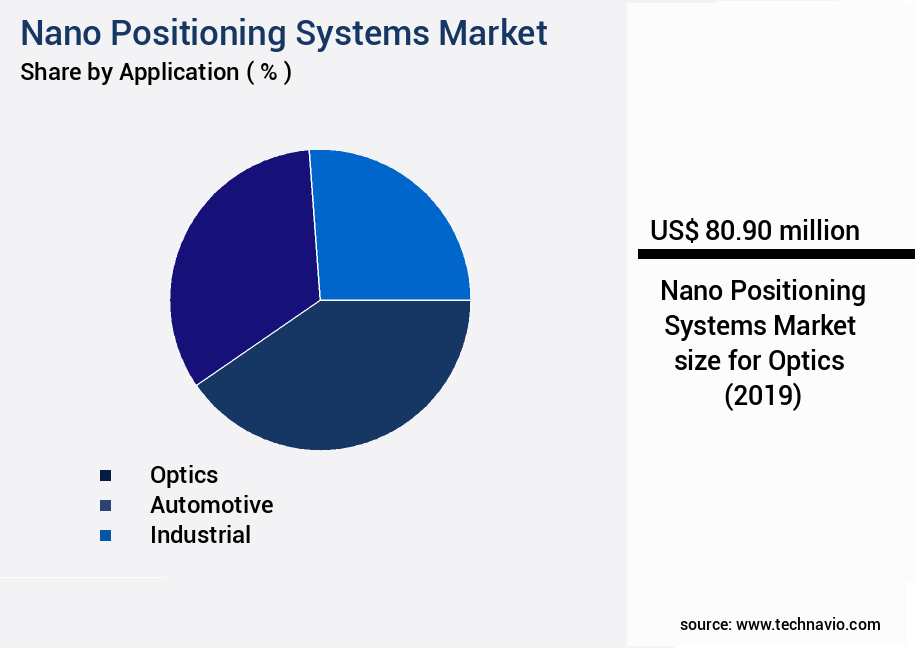
The Optics segment was valued at USD 80.90 million in 2019 and showed a gradual increase during the forecast period.

Nano Positioning Systems Market Size

Request Free Sample

Regional Analysis

North America is estimated to contribute 37% to the growth of the global market during the forecast period.Technavio's analysts have elaborately explained the regional trends and drivers that shape the market during the forecast period.

Nano Positioning Systems Market Share by Geography

See How Nano Positioning Systems Market Demand is Rising in North America Request Free Sample

The market is experiencing significant growth, particularly in the North American region, which contributes the largest revenue share to the global market. This expansion is primarily driven by the increasing adoption of automation in industries such as industrial, automotive, and healthcare. Nanotechnology, with its potential for operational efficiency and cost savings, is a key factor fueling this trend. In healthcare, the Internet of Nano Things (IoNT) is gaining traction due to government initiatives aimed at reducing healthcare expenses and enabling remote patient monitoring (RPM).

For instance, the US government's Affordable Care Act (ACA) and Health Information Technology for Economic and Clinical Health (HITECH) Act have encouraged the adoption of advanced technologies like telehealth, mobile health, and nanomedicine. Overall, the market's evolution is shaped by the underlying dynamics of automation, nanotechnology, and regulatory initiatives.

Nano Positioning Systems Market Share by Geography

 Customer Landscape of Nano Positioning Systems Industry

Competitive Intelligence by Technavio Analysis: Leading Players in the Nano Positioning Systems Market

Companies are implementing various strategies, such as strategic alliances, nano positioning systems market forecast, partnerships, mergers and acquisitions, geographical expansion, and product/service launches, to enhance their presence in the industry.

Aerotech Inc. - This company specializes in advanced nanopositioning systems, featuring innovative products such as the ANT130L Single Axis Linear Stage, PRO165SL Mechanical Bearing Ball Screw Stage, and ANT130XY Two Axis XY Stage. These precision instruments cater to various industries, enabling precise control and repeatability in scientific research, manufacturing processes, and engineering applications.

The industry research and growth report includes detailed analyses of the competitive landscape of the market and information about key companies, including:

  • Aerotech Inc.
  • Allied Motion Technologies Inc.
  • CEDRAT TECHNOLOGIES SA
  • Dynamic Structures and Materials LLC
  • Grayfield Optical Inc.
  • Harbin Core Tomorrow Science and Technology Co. Ltd.
  • ISP System
  • Mad City Labs Inc.
  • MICRONIX USA
  • MKS Instruments Inc.
  • Novanta Inc.
  • OME Technology Co. Ltd.
  • OWIS GmbH
  • Physik Instrumente GmbH and Co. KG
  • Piezosystem Jena GmbH
  • Prior Scientific Instruments Ltd.
  • Pro Lite Technology Ltd.
  • SmarAct GmbH
  • Thorlabs Inc.
  • WITTENSTEIN SE

Qualitative and quantitative analysis of companies has been conducted to help clients understand the wider business environment as well as the strengths and weaknesses of key industry players. Data is qualitatively analyzed to categorize companies as pure play, category-focused, industry-focused, and diversified; it is quantitatively analyzed to categorize companies as dominant, leading, strong, tentative, and weak.

Recent Development and News in Nano Positioning Systems Market

  • In August 2024, Nano Precision Instruments, a leading nano positioning systems manufacturer, announced the launch of their new high-precision nanopositioning stage, the NPS-1000, designed for advanced research applications in semiconductor manufacturing and biotechnology (Nano Precision Instruments Press Release, 2024). This new product offers a positioning accuracy of less than 10 nanometers, making it a significant advancement in the market.
  • In November 2024, Heidelberg Instruments, a German nanotechnology company, and Nanometrics, a leading provider of process control metrology and inspection systems for the semiconductor industry, entered into a strategic partnership to integrate Heidelberg's nano positioning systems into Nanometrics' metrology solutions (Heidelberg Instruments Press Release, 2024). This collaboration aims to enhance the performance and functionality of Nanometrics' systems, catering to the growing demands of the semiconductor industry.
  • In February 2025, Aerotech, a global leader in advanced motion control systems and precision automation, completed the acquisition of Precision Motion Devices, a specialist in nanopositioning systems for the life sciences market (Aerotech Press Release, 2025). This strategic move strengthens Aerotech's position in the market and expands its offerings to the life sciences sector.
  • In May 2025, the European Union announced a €1.2 billion investment in the European Chip Alliance, a public-private partnership to boost Europe's semiconductor industry and reduce its dependence on imports (European Commission Press Release, 2025). This significant initiative includes the development of advanced nanopositioning systems for semiconductor manufacturing, creating new opportunities for the market players in Europe.

Dive into Technavio's robust research methodology, blending expert interviews, extensive data synthesis, and validated models for unparalleled Nano Positioning Systems Market insights. See full methodology.

Market Scope

Report Coverage

Details

Page number

221

Base year

2024

Historic period

2019-2023

Forecast period

2025-2029

Growth momentum & CAGR

Accelerate at a CAGR of 22.5%

Market growth 2025-2029

USD 636.2 million

Market structure

Fragmented

YoY growth 2024-2025(%)

18.1

Key countries

US, China, Canada, France, UK, Japan, Germany, India, Italy, and South Korea

Competitive landscape

Leading Companies, Market Positioning of Companies, Competitive Strategies, and Industry Risks

Request Free Sample

Why Choose Technavio for Nano Positioning Systems Market Insights?

"Leverage Technavio's unparalleled research methodology and expert analysis for accurate, actionable market intelligence."

The market is experiencing significant growth due to the increasing demand for closed-loop control in high-resolution imaging techniques and nanoscale applications. These systems enable nanomanipulation using tools such as optical tweezers, requiring precision positioning system calibration methods and advanced sensor integration. Nanofabrication techniques for device creation rely heavily on nanopositioning systems, which incorporate real-time feedback control algorithms and piezoelectric actuators for precise positioning. Error compensation techniques are essential for improving system reliability in nanopositioning applications. Vibration isolation strategies and thermal stability improvement methods are also critical to ensure accurate positioning. Data acquisition and processing systems are integral components of nanopositioning, enabling nanoscale metrology standards and procedures, high-throughput nanoassembly methods, and nanoscale device characterization techniques. Robotic systems for nanoscale manipulation are gaining popularity, utilizing electrostatic actuation for positioning and feedback control implementation. Microfluidic control is another important application of nanopositioning systems, requiring precise positioning and manipulation of fluids at the nanoscale. The market for nanopositioning systems is expected to grow as research and development in the field continue to advance, driving the need for more sophisticated and reliable systems.

What are the Key Data Covered in this Nano Positioning Systems Market Research and Growth Report?

  • What is the expected growth of the Nano Positioning Systems Market between 2025 and 2029?

    • USD 636.2 million, at a CAGR of 22.5%

  • What segmentation does the market report cover?

    • The report is segmented by Application (Optics, Automotive, Industrial, and Others), Type (Capacitive sensor, Piezoresistive sensor, and Piezoelectric sensor), Product Type (3D, 2D, and Single-coordinate), and Geography (North America, Europe, APAC, Middle East and Africa, and South America)

  • Which regions are analyzed in the report?

    • North America, Europe, APAC, Middle East and Africa, and South America

  • What are the key growth drivers and market challenges?

    • Wide application of nanotechnology, High sensitivity of nano positioning systems to environmental conditions

  • Who are the major players in the Nano Positioning Systems Market?

    • Aerotech Inc., Allied Motion Technologies Inc., CEDRAT TECHNOLOGIES SA, Dynamic Structures and Materials LLC, Grayfield Optical Inc., Harbin Core Tomorrow Science and Technology Co. Ltd., ISP System, Mad City Labs Inc., MICRONIX USA, MKS Instruments Inc., Novanta Inc., OME Technology Co. Ltd., OWIS GmbH, Physik Instrumente GmbH and Co. KG, Piezosystem Jena GmbH, Prior Scientific Instruments Ltd., Pro Lite Technology Ltd., SmarAct GmbH, Thorlabs Inc., and WITTENSTEIN SE

We can help! Our analysts can customize this nano positioning systems market research report to meet your requirements.

Get in touch

1 Executive Summary

  • 1.1 Market overview
    • Executive Summary - Chart on Market Overview
    • Executive Summary - Data Table on Market Overview
    • Executive Summary - Chart on Global Market Characteristics
    • Executive Summary - Chart on Market by Geography
    • Executive Summary - Chart on Market Segmentation by Application
    • Executive Summary - Chart on Market Segmentation by Type
    • Executive Summary - Chart on Market Segmentation by Product Type
    • Executive Summary - Chart on Incremental Growth
    • Executive Summary - Data Table on Incremental Growth
    • Executive Summary - Chart on Company Market Positioning

2 Technavio Analysis

  • 2.1 Analysis of price sensitivity, lifecycle, customer purchase basket, adoption rates, and purchase criteria
    • Analysis of price sensitivity, lifecycle, customer purchase basket, adoption rates, and purchase criteria
  • 2.2 Criticality of inputs and Factors of differentiation
    • Overview on criticality of inputs and factors of differentiation
  • 2.3 Factors of disruption
    • Overview on factors of disruption
  • 2.4 Impact of drivers and challenges
    • Impact of drivers and challenges in 2024 and 2029

3 Market Landscape

  • 3.1 Market ecosystem
    • Parent Market
    • Data Table on - Parent Market
  • 3.2 Market characteristics
    • Market characteristics analysis
  • 3.3 Value chain analysis
    • Value chain analysis

4 Market Sizing

  • 4.1 Market definition
    • Offerings of companies included in the market definition
  • 4.2 Market segment analysis
    • Market segments
  • 4.3 Market size 2024
    • 4.4 Market outlook: Forecast for 2024-2029
      • Chart on Global - Market size and forecast 2024-2029 ($ million)
      • Data Table on Global - Market size and forecast 2024-2029 ($ million)
      • Chart on Global Market: Year-over-year growth 2024-2029 (%)
      • Data Table on Global Market: Year-over-year growth 2024-2029 (%)

    5 Historic Market Size

    • 5.1 Global Nano Positioning Systems Market 2019 - 2023
      • Historic Market Size - Data Table on Global Nano Positioning Systems Market 2019 - 2023 ($ million)
    • 5.2 Application segment analysis 2019 - 2023
      • Historic Market Size - Application Segment 2019 - 2023 ($ million)
    • 5.3 Type segment analysis 2019 - 2023
      • Historic Market Size - Type Segment 2019 - 2023 ($ million)
    • 5.4 Product Type segment analysis 2019 - 2023
      • Historic Market Size - Product Type Segment 2019 - 2023 ($ million)
    • 5.5 Geography segment analysis 2019 - 2023
      • Historic Market Size - Geography Segment 2019 - 2023 ($ million)
    • 5.6 Country segment analysis 2019 - 2023
      • Historic Market Size - Country Segment 2019 - 2023 ($ million)

    6 Qualitative Analysis

    • 6.1 The impact of AI in the global nano positioning systems market

      7 Five Forces Analysis

      • 7.1 Five forces summary
        • Five forces analysis - Comparison between 2024 and 2029
      • 7.2 Bargaining power of buyers
        • Bargaining power of buyers - Impact of key factors 2024 and 2029
      • 7.3 Bargaining power of suppliers
        • Bargaining power of suppliers - Impact of key factors in 2024 and 2029
      • 7.4 Threat of new entrants
        • Threat of new entrants - Impact of key factors in 2024 and 2029
      • 7.5 Threat of substitutes
        • Threat of substitutes - Impact of key factors in 2024 and 2029
      • 7.6 Threat of rivalry
        • Threat of rivalry - Impact of key factors in 2024 and 2029
      • 7.7 Market condition
        • Chart on Market condition - Five forces 2024 and 2029

      8 Market Segmentation by Application

      • 8.1 Market segments
        • Chart on Application - Market share 2024-2029 (%)
        • Data Table on Application - Market share 2024-2029 (%)
      • 8.2 Comparison by Application
        • Chart on Comparison by Application
        • Data Table on Comparison by Application
      • 8.3 Optics - Market size and forecast 2024-2029
        • Chart on Optics - Market size and forecast 2024-2029 ($ million)
        • Data Table on Optics - Market size and forecast 2024-2029 ($ million)
        • Chart on Optics - Year-over-year growth 2024-2029 (%)
        • Data Table on Optics - Year-over-year growth 2024-2029 (%)
      • 8.4 Automotive - Market size and forecast 2024-2029
        • Chart on Automotive - Market size and forecast 2024-2029 ($ million)
        • Data Table on Automotive - Market size and forecast 2024-2029 ($ million)
        • Chart on Automotive - Year-over-year growth 2024-2029 (%)
        • Data Table on Automotive - Year-over-year growth 2024-2029 (%)
      • 8.5 Industrial - Market size and forecast 2024-2029
        • Chart on Industrial - Market size and forecast 2024-2029 ($ million)
        • Data Table on Industrial - Market size and forecast 2024-2029 ($ million)
        • Chart on Industrial - Year-over-year growth 2024-2029 (%)
        • Data Table on Industrial - Year-over-year growth 2024-2029 (%)
      • 8.6 Others - Market size and forecast 2024-2029
        • Chart on Others - Market size and forecast 2024-2029 ($ million)
        • Data Table on Others - Market size and forecast 2024-2029 ($ million)
        • Chart on Others - Year-over-year growth 2024-2029 (%)
        • Data Table on Others - Year-over-year growth 2024-2029 (%)
      • 8.7 Market opportunity by Application
        • Market opportunity by Application ($ million)
        • Data Table on Market opportunity by Application ($ million)

      9 Market Segmentation by Type

      • 9.1 Market segments
        • Chart on Type - Market share 2024-2029 (%)
        • Data Table on Type - Market share 2024-2029 (%)
      • 9.2 Comparison by Type
        • Chart on Comparison by Type
        • Data Table on Comparison by Type
      • 9.3 Capacitive sensor - Market size and forecast 2024-2029
        • Chart on Capacitive sensor - Market size and forecast 2024-2029 ($ million)
        • Data Table on Capacitive sensor - Market size and forecast 2024-2029 ($ million)
        • Chart on Capacitive sensor - Year-over-year growth 2024-2029 (%)
        • Data Table on Capacitive sensor - Year-over-year growth 2024-2029 (%)
      • 9.4 Piezoresistive sensor - Market size and forecast 2024-2029
        • Chart on Piezoresistive sensor - Market size and forecast 2024-2029 ($ million)
        • Data Table on Piezoresistive sensor - Market size and forecast 2024-2029 ($ million)
        • Chart on Piezoresistive sensor - Year-over-year growth 2024-2029 (%)
        • Data Table on Piezoresistive sensor - Year-over-year growth 2024-2029 (%)
      • 9.5 Piezoelectric sensor - Market size and forecast 2024-2029
        • Chart on Piezoelectric sensor - Market size and forecast 2024-2029 ($ million)
        • Data Table on Piezoelectric sensor - Market size and forecast 2024-2029 ($ million)
        • Chart on Piezoelectric sensor - Year-over-year growth 2024-2029 (%)
        • Data Table on Piezoelectric sensor - Year-over-year growth 2024-2029 (%)
      • 9.6 Market opportunity by Type
        • Market opportunity by Type ($ million)
        • Data Table on Market opportunity by Type ($ million)

      10 Market Segmentation by Product Type

      • 10.1 Market segments
        • Chart on Product Type - Market share 2024-2029 (%)
        • Data Table on Product Type - Market share 2024-2029 (%)
      • 10.2 Comparison by Product Type
        • Chart on Comparison by Product Type
        • Data Table on Comparison by Product Type
      • 3D - Market size and forecast 2024-2029
        • Chart on 3D - Market size and forecast 2024-2029 ($ million)
        • Data Table on 3D - Market size and forecast 2024-2029 ($ million)
        • Chart on 3D - Year-over-year growth 2024-2029 (%)
        • Data Table on 3D - Year-over-year growth 2024-2029 (%)
      • 2D - Market size and forecast 2024-2029
        • Chart on 2D - Market size and forecast 2024-2029 ($ million)
        • Data Table on 2D - Market size and forecast 2024-2029 ($ million)
        • Chart on 2D - Year-over-year growth 2024-2029 (%)
        • Data Table on 2D - Year-over-year growth 2024-2029 (%)
      • 10.5 Single-coordinate - Market size and forecast 2024-2029
        • Chart on Single-coordinate - Market size and forecast 2024-2029 ($ million)
        • Data Table on Single-coordinate - Market size and forecast 2024-2029 ($ million)
        • Chart on Single-coordinate - Year-over-year growth 2024-2029 (%)
        • Data Table on Single-coordinate - Year-over-year growth 2024-2029 (%)
      • 10.6 Market opportunity by Product Type
        • Market opportunity by Product Type ($ million)
        • Data Table on Market opportunity by Product Type ($ million)

      11 Customer Landscape

      • 11.1 Customer landscape overview
        • Analysis of price sensitivity, lifecycle, customer purchase basket, adoption rates, and purchase criteria

      12 Geographic Landscape

      • 12.1 Geographic segmentation
        • Chart on Market share by geography 2024-2029 (%)
        • Data Table on Market share by geography 2024-2029 (%)
      • 12.2 Geographic comparison
        • Chart on Geographic comparison
        • Data Table on Geographic comparison
      • 12.3 North America - Market size and forecast 2024-2029
        • Chart on North America - Market size and forecast 2024-2029 ($ million)
        • Data Table on North America - Market size and forecast 2024-2029 ($ million)
        • Chart on North America - Year-over-year growth 2024-2029 (%)
        • Data Table on North America - Year-over-year growth 2024-2029 (%)
      • 12.4 Europe - Market size and forecast 2024-2029
        • Chart on Europe - Market size and forecast 2024-2029 ($ million)
        • Data Table on Europe - Market size and forecast 2024-2029 ($ million)
        • Chart on Europe - Year-over-year growth 2024-2029 (%)
        • Data Table on Europe - Year-over-year growth 2024-2029 (%)
      • 12.5 APAC - Market size and forecast 2024-2029
        • Chart on APAC - Market size and forecast 2024-2029 ($ million)
        • Data Table on APAC - Market size and forecast 2024-2029 ($ million)
        • Chart on APAC - Year-over-year growth 2024-2029 (%)
        • Data Table on APAC - Year-over-year growth 2024-2029 (%)
      • 12.6 Middle East and Africa - Market size and forecast 2024-2029
        • Chart on Middle East and Africa - Market size and forecast 2024-2029 ($ million)
        • Data Table on Middle East and Africa - Market size and forecast 2024-2029 ($ million)
        • Chart on Middle East and Africa - Year-over-year growth 2024-2029 (%)
        • Data Table on Middle East and Africa - Year-over-year growth 2024-2029 (%)
      • 12.7 South America - Market size and forecast 2024-2029
        • Chart on South America - Market size and forecast 2024-2029 ($ million)
        • Data Table on South America - Market size and forecast 2024-2029 ($ million)
        • Chart on South America - Year-over-year growth 2024-2029 (%)
        • Data Table on South America - Year-over-year growth 2024-2029 (%)
      • 12.8 US - Market size and forecast 2024-2029
        • Chart on US - Market size and forecast 2024-2029 ($ million)
        • Data Table on US - Market size and forecast 2024-2029 ($ million)
        • Chart on US - Year-over-year growth 2024-2029 (%)
        • Data Table on US - Year-over-year growth 2024-2029 (%)
      • 12.9 China - Market size and forecast 2024-2029
        • Chart on China - Market size and forecast 2024-2029 ($ million)
        • Data Table on China - Market size and forecast 2024-2029 ($ million)
        • Chart on China - Year-over-year growth 2024-2029 (%)
        • Data Table on China - Year-over-year growth 2024-2029 (%)
      • 12.10 Canada - Market size and forecast 2024-2029
        • Chart on Canada - Market size and forecast 2024-2029 ($ million)
        • Data Table on Canada - Market size and forecast 2024-2029 ($ million)
        • Chart on Canada - Year-over-year growth 2024-2029 (%)
        • Data Table on Canada - Year-over-year growth 2024-2029 (%)
      • 12.11 France - Market size and forecast 2024-2029
        • Chart on France - Market size and forecast 2024-2029 ($ million)
        • Data Table on France - Market size and forecast 2024-2029 ($ million)
        • Chart on France - Year-over-year growth 2024-2029 (%)
        • Data Table on France - Year-over-year growth 2024-2029 (%)
      • 12.12 UK - Market size and forecast 2024-2029
        • Chart on UK - Market size and forecast 2024-2029 ($ million)
        • Data Table on UK - Market size and forecast 2024-2029 ($ million)
        • Chart on UK - Year-over-year growth 2024-2029 (%)
        • Data Table on UK - Year-over-year growth 2024-2029 (%)
      • 12.13 Japan - Market size and forecast 2024-2029
        • Chart on Japan - Market size and forecast 2024-2029 ($ million)
        • Data Table on Japan - Market size and forecast 2024-2029 ($ million)
        • Chart on Japan - Year-over-year growth 2024-2029 (%)
        • Data Table on Japan - Year-over-year growth 2024-2029 (%)
      • 12.14 Germany - Market size and forecast 2024-2029
        • Chart on Germany - Market size and forecast 2024-2029 ($ million)
        • Data Table on Germany - Market size and forecast 2024-2029 ($ million)
        • Chart on Germany - Year-over-year growth 2024-2029 (%)
        • Data Table on Germany - Year-over-year growth 2024-2029 (%)
      • 12.15 India - Market size and forecast 2024-2029
        • Chart on India - Market size and forecast 2024-2029 ($ million)
        • Data Table on India - Market size and forecast 2024-2029 ($ million)
        • Chart on India - Year-over-year growth 2024-2029 (%)
        • Data Table on India - Year-over-year growth 2024-2029 (%)
      • 12.16 Italy - Market size and forecast 2024-2029
        • Chart on Italy - Market size and forecast 2024-2029 ($ million)
        • Data Table on Italy - Market size and forecast 2024-2029 ($ million)
        • Chart on Italy - Year-over-year growth 2024-2029 (%)
        • Data Table on Italy - Year-over-year growth 2024-2029 (%)
      • 12.17 South Korea - Market size and forecast 2024-2029
        • Chart on South Korea - Market size and forecast 2024-2029 ($ million)
        • Data Table on South Korea - Market size and forecast 2024-2029 ($ million)
        • Chart on South Korea - Year-over-year growth 2024-2029 (%)
        • Data Table on South Korea - Year-over-year growth 2024-2029 (%)
      • 12.18 Market opportunity by geography
        • Market opportunity by geography ($ million)
        • Data Tables on Market opportunity by geography ($ million)

      13 Drivers, Challenges, and Opportunity/Restraints

      • 13.1 Market drivers
        • 13.2 Market challenges
          • 13.3 Impact of drivers and challenges
            • Impact of drivers and challenges in 2024 and 2029
          • 13.4 Market opportunities/restraints

            14 Competitive Landscape

            • 14.1 Overview
              • 14.2 Competitive Landscape
                • Overview on criticality of inputs and factors of differentiation
              • 14.3 Landscape disruption
                • Overview on factors of disruption
              • 14.4 Industry risks
                • Impact of key risks on business

              15 Competitive Analysis

              • 15.1 Companies profiled
                • Companies covered
              • 15.2 Company ranking index
                • Company ranking index
              • 15.3 Market positioning of companies
                • Matrix on companies position and classification
              • 15.4 Aerotech Inc.
                • Aerotech Inc. - Overview
                • Aerotech Inc. - Product / Service
                • Aerotech Inc. - Key offerings
                • SWOT
              • 15.5 CEDRAT TECHNOLOGIES SA
                • CEDRAT TECHNOLOGIES SA - Overview
                • CEDRAT TECHNOLOGIES SA - Product / Service
                • CEDRAT TECHNOLOGIES SA - Key offerings
                • SWOT
              • 15.6 Dynamic Structures and Materials LLC
                • Dynamic Structures and Materials LLC - Overview
                • Dynamic Structures and Materials LLC - Product / Service
                • Dynamic Structures and Materials LLC - Key offerings
                • SWOT
              • 15.7 Harbin Core Tomorrow Science and Technology Co. Ltd.
                • Harbin Core Tomorrow Science and Technology Co. Ltd. - Overview
                • Harbin Core Tomorrow Science and Technology Co. Ltd. - Product / Service
                • Harbin Core Tomorrow Science and Technology Co. Ltd. - Key offerings
                • SWOT
              • 15.8 Mad City Labs Inc.
                • Mad City Labs Inc. - Overview
                • Mad City Labs Inc. - Product / Service
                • Mad City Labs Inc. - Key offerings
                • SWOT
              • 15.9 MKS Instruments Inc.
                • MKS Instruments Inc. - Overview
                • MKS Instruments Inc. - Business segments
                • MKS Instruments Inc. - Key offerings
                • MKS Instruments Inc. - Segment focus
                • SWOT
              • 15.10 Novanta Inc.
                • Novanta Inc. - Overview
                • Novanta Inc. - Business segments
                • Novanta Inc. - Key news
                • Novanta Inc. - Key offerings
                • Novanta Inc. - Segment focus
                • SWOT
              • 15.11 OME Technology Co. Ltd.
                • OME Technology Co. Ltd. - Overview
                • OME Technology Co. Ltd. - Product / Service
                • OME Technology Co. Ltd. - Key offerings
                • SWOT
              • 15.12 OWIS GmbH
                • OWIS GmbH - Overview
                • OWIS GmbH - Product / Service
                • OWIS GmbH - Key offerings
                • SWOT
              • 15.13 Physik Instrumente GmbH and Co. KG
                • Physik Instrumente GmbH and Co. KG - Overview
                • Physik Instrumente GmbH and Co. KG - Product / Service
                • Physik Instrumente GmbH and Co. KG - Key offerings
                • SWOT
              • 15.14 Piezosystem Jena GmbH
                • Piezosystem Jena GmbH - Overview
                • Piezosystem Jena GmbH - Product / Service
                • Piezosystem Jena GmbH - Key offerings
                • SWOT
              • 15.15 Prior Scientific Instruments Ltd.
                • Prior Scientific Instruments Ltd. - Overview
                • Prior Scientific Instruments Ltd. - Product / Service
                • Prior Scientific Instruments Ltd. - Key offerings
                • SWOT
              • 15.16 SmarAct GmbH
                • SmarAct GmbH - Overview
                • SmarAct GmbH - Product / Service
                • SmarAct GmbH - Key offerings
                • SWOT
              • 15.17 Thorlabs Inc.
                • Thorlabs Inc. - Overview
                • Thorlabs Inc. - Product / Service
                • Thorlabs Inc. - Key offerings
                • SWOT
              • 15.18 WITTENSTEIN SE
                • WITTENSTEIN SE - Overview
                • WITTENSTEIN SE - Product / Service
                • WITTENSTEIN SE - Key offerings
                • SWOT

              16 Appendix

              • 16.1 Scope of the report
                • 16.2 Inclusions and exclusions checklist
                  • Inclusions checklist
                  • Exclusions checklist
                • 16.3 Currency conversion rates for US$
                  • Currency conversion rates for US$
                • 16.4 Research methodology
                  • Research methodology
                • 16.5 Data procurement
                  • Information sources
                • 16.6 Data validation
                  • Data validation
                • 16.7 Validation techniques employed for market sizing
                  • Validation techniques employed for market sizing
                • 16.8 Data synthesis
                  • Data synthesis
                • 16.9 360 degree market analysis
                  • 360 degree market analysis
                • 16.10 List of abbreviations
                  • List of abbreviations

                Research Methodology

                Technavio presents a detailed picture of the market by way of study, synthesis, and summation of data from multiple sources. The analysts have presented the various facets of the market with a particular focus on identifying the key industry influencers. The data thus presented is comprehensive, reliable, and the result of extensive research, both primary and secondary.

                INFORMATION SOURCES

                Primary sources

                • Manufacturers and suppliers
                • Channel partners
                • Industry experts
                • Strategic decision makers

                Secondary sources

                • Industry journals and periodicals
                • Government data
                • Financial reports of key industry players
                • Historical data
                • Press releases

                DATA ANALYSIS

                Data Synthesis

                • Collation of data
                • Estimation of key figures
                • Analysis of derived insights

                Data Validation

                • Triangulation with data models
                • Reference against proprietary databases
                • Corroboration with industry experts

                REPORT WRITING

                Qualitative

                • Market drivers
                • Market challenges
                • Market trends
                • Five forces analysis

                Quantitative

                • Market size and forecast
                • Market segmentation
                • Geographical insights
                • Competitive landscape

                Interested in this report?

                Get your sample now to see our research methodology and insights!

                Download Now

                Frequently Asked Questions

                Nano Positioning Systems market growth will increase by $ 636.2 mn during 2025-2029.

                The Nano Positioning Systems market is expected to grow at a CAGR of 22.5% during 2025-2029.

                Nano Positioning Systems market is segmented by Application( Optics, Automotive, Industrial, Others, Aerospace) Type( Capacitive sensor, Piezoresistive sensor, Piezoelectric sensor, Middle East and Africa, South America) Product Type( 3D, 2D, Single-coordinate, Middle East and Africa, South America)

                Aerotech Inc., Allied Motion Technologies Inc., CEDRAT TECHNOLOGIES SA, Dynamic Structures and Materials LLC, Grayfield Optical Inc., Harbin Core Tomorrow Science and Technology Co. Ltd., ISP System, Mad City Labs Inc., MICRONIX USA, MKS Instruments Inc., Novanta Inc., OME Technology Co. Ltd., OWIS GmbH, Physik Instrumente GmbH and Co. KG, Piezosystem Jena GmbH, Prior Scientific Instruments Ltd., Pro Lite Technology Ltd., SmarAct GmbH, Thorlabs Inc., WITTENSTEIN SE are a few of the key vendors in the Nano Positioning Systems market.

                North America will register the highest growth rate of 37% among the other regions. Therefore, the Nano Positioning Systems market in North America is expected to garner significant business opportunities for the vendors during the forecast period.

                US, China, Canada, France, UK, Japan, Germany, India, Italy, South Korea

                • Wide application of nanotechnologyNanotechnology is the process of influencing atoms to enhance their core properties and characteristics. Nanotechnology uses nanoscience to build an ecosystem. Multiple semiconductor components such as quantum dots (QDs) is the driving factor this market.
                • carbon nanotubes (CNTs) is the driving factor this market.
                • and other nanoparticles are manufactured using nanotechnology. Nano positioning systems such as piezoelectric actuators are used in portable communication devices such as smartphones to operate cameras and haptic feedback systems. Nano positioning systems are also integrated into healthcare devices and automotive components and used to develop advanced weapons. Economic expansion will drive the growth of the global nanotechnology market due to increasing industrial and consumer demand for products that use nanotechnology. Hence is the driving factor this market.
                • the governments of several countries are making significant investments to advance nanotechnology. Technavio believes that the precision and performance of ICs will improve due to the growing integration of nanodevices. For instance is the driving factor this market.
                • in February 2024 is the driving factor this market.
                • TDK Corporation announced an expansion of its PowerHap portfolio of piezoelectric actuators is the driving factor this market.
                • which are designed to provide high-quality haptic feedback. The new is the driving factor this market.
                • smaller actuators are specifically engineered for integration into automotive systems is the driving factor this market.
                • such as buttons on steering wheels and center consoles is the driving factor this market.
                • as well as for use in industrial electronics and household appliances. This product line expansion by a major global manufacturer demonstrates the growing adoption of nano positioning systems within the automotive industry to create advanced user interfaces is the driving factor this market.
                • directly supporting the thesis that increased industrial demand for nanotechnology applications contributes to market growth. Hence is the driving factor this market.
                • the growing focus on nanotechnology will increase the demand for nano positioning systems is the driving factor this market.
                • thereby will contribute to the growth of the global nano positioning system market during the forecast period. is the driving factor this market.

                The Nano Positioning Systems market vendors should focus on grabbing business opportunities from the Optics segment as it accounted for the largest market share in the base year.
                RIA - Research AI Assistant
                Ask RIA