Quantum Dots (QD) Market Analysis North America, Europe, APAC, Middle East and Africa, South America - US, Canada, China, Germany, UK - Size and Forecast 2024-2028

Quantum Dots (QD) Market Analysis North America, Europe, APAC, Middle East and Africa, South America - US, Canada, China, Germany, UK - Size and Forecast 2024-2028

Published: Feb 2024 160 Pages SKU: IRTNTR74861

Market Overview at a Glance

$7.09 B
Market Opportunity
17.01%
CAGR
16.34
YoY growth 2023-2024(%)

Quantum Dots (QD) Market Size 2024-2028 

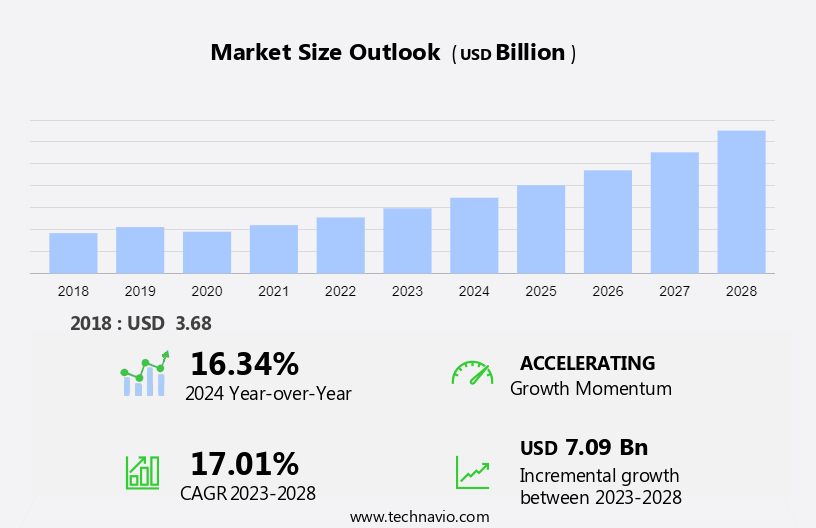
The Quantum Dots (QD) Market size is forecast to increase by USD 7.09 billion, at a CAGR of 17.01% between 2023 and 2028. Market growth is contingent upon various factors, notably the rising demand for devices optimized for superior performance and high resolution. Concurrently, consumer interest in cadmium-free quantum dots is burgeoning, driven by their environmental benefits. Additionally, there's a growing need for energy-efficient devices, aligning with sustainability trends. These factors collectively shape the trajectory of the market, reflecting evolving consumer preferences towards technologically advanced, eco-friendly products. As demand for optimized devices and eco-friendly solutions continues to rise, manufacturers are compelled to innovate, driving further growth in the market.

The market growth and forecasting report includes key player's detailed analyses of the competitive landscape of the market and information about 20 market companies, including American Elements, Indium Corp., LG Electronics Inc., Merck KGaA, Nanorh, Nanosys Inc., Nippon Chemical Industrial Co. Ltd., NNCrystal US Corp., Ocean NanoTech LLC, QD Laser Inc., Quantum Solutions UK, RANVOUS Inc., Samsung Electronics Co. Ltd., UbiQD Inc., Core Quantum Technologies, Crystalplex Corp., Strem Chemicals Inc., and XTPL S.A.. Additionally, ams OSRAM AG offers quantum dots that are used in a variety of applications, including as fluorescent materials, in displays, security features on banknotes, used for general lighting, LEDs, and others.

What will be the Size of the Market During the Forecast Period?

Quantum Dots Market Size

For More Highlights About this Report, Download Free Sample in a Minute 

Market Segmentation

By Material

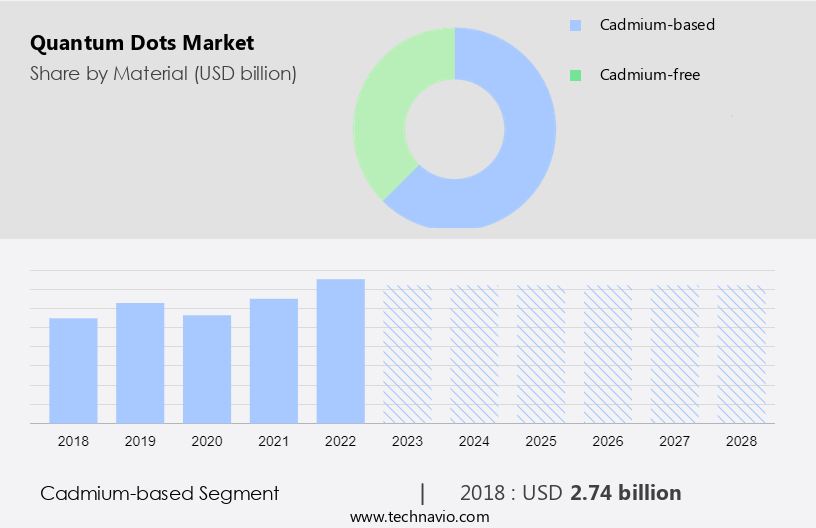
The cadmium-based segment is estimated to witness significant growth during the forecast period. The main features of the cadmium-based segment are broad UV excitation, narrow emission, strong photoluminescence (PL), and high photostability, making them appropriate for use in bioimaging, EL and PV devices, catalytic hydrogen generation, sensors, and other applications. In addition, the cadmium selenide (CdSe) segment is renowned for its uniform size distribution and flexibility.

Quantum Dots Market Size

Get a glance at the market contribution of various segments Download the PDF Sample

The cadmium-based segment was the largest segment and was valued at USD 2.74 billion in 2018. Moreover, CdSe coresegment may be driven at a range of wavelengths and emitted with a narrow peak, resulting in color-pure emission that spans virtually the whole visible spectrum. In addition, for demonstrations and proof-of-concept work, CdSe core segment are a low-cost option. Furthermore, because of its appropriate and customizable bandgap over the visible spectrum, CdSe, the most common form of QD, has emerged as one of the most thoroughly investigated fluorescent semiconductor nanocrystal families. Hence, such factors are fuelling the growth of this segment which in turn drives the market growth during the forecast period.

By Product

The growing adoption of quantum dots in displays segments will increase the market growth. Quantum dot displays feature a restricted spectrum, good stability, and consume little power and thus display makers are increasingly employing them. In addition, they are utilized in displays of flat-panel TV screens, digital cameras, cellphones, gaming consoles, and personal digital assistant (PDA) devices. Moreover, LEDs with quantum dot luminophores are a potential breakthrough in the display ecology. Furthermore, displays use it and have several advantages, including superb color rendering, high lighting efficiency, and inexpensive cost. Hence, such factors are fuelling the growth of this segment which in turn drives the market growth during the forecast period.

By region

Quantum Dots Market Share by Geography

For more insights on the market share of various regions Download PDF Sample now!

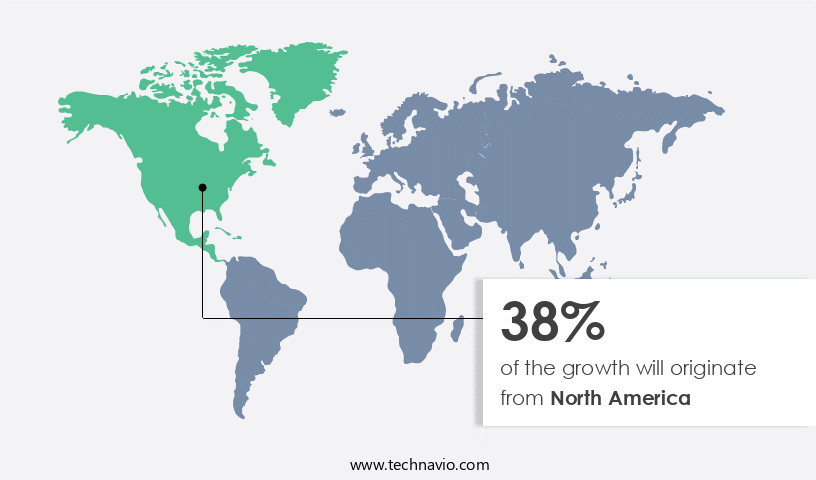
North America is estimated to contribute 38% to the growth of the global market during the forecast period. 
Technavio's analysts have provided extensive insight into the market forecast, detailing the regional trends and drivers influencing the market's trajectory throughout the forecast period. Several factors such as high display demand and the early adoption of quantum dot technology in applications including healthcare and automotive drive quantum dots market growth.

Moreover, because of the widespread adoption of quantum dot displays, the US market has the region's largest market share. Furthermore, several consumer electronics manufacturers in North America are working on producing hybrid quantum dot displays to address the rising need for flexible displays. Therefore, this technique will assist consumer gadgets that require a flexible display. Hence, such factors are driving the market growth in North America during the forecast period.

Market Dynamics and Customer Landscape

The market is witnessing significant growth propelled by advancements in plasmonic devices and quantum computers. With innovations like cadmium-based QDs, it enhances electroluminescence (EL) and photovoltaic (PV) devices. Moreover, QDs play a pivotal role in catalytic hydrogen production and facilitate the development of high-quality display devices. Extensive research and development activities in nanotechnology and quantum computing drive the market forward, supporting applications in diverse fields such as cell biology research and microscopy. Harnessing the unique properties of atoms, QDs offer promising solutions for next-generation technologies.

Key Driver

Increasing demand for optimized devices with better performance and high resolution is notably driving the market. The growing demand for optimized devices with better performance and high resolution has gained market traction in the last few years in multiple domains, including consumer electronics and communication. In addition, modern screens not only have improved brightness and contrast ratios, but they also have higher resolutions and use less power than older displays.

Moreover, display makers are designing screens with higher characteristics to increase their market position. In addition, they are widely utilized in display systems because they provide richer color resolution, better color purity, a highly immersive high-dynamic-range (HDR) experience, and superior energy efficiency than traditional displays. Furthermore, because they have narrow emission spectra and broad excitation profiles, they can more efficiently convert light into any hue in the visible spectrum. Hence, such factors are driving the market growth during the forecast period.

Significant Trends

Increasing adoption of optoelectronics is one of the emerging market trends shaping the growth. Quantum dots are mainly used in LCD devices, including TVs, smartphones, and tablets. In addition, these displays use LED backlights to enhance the color gamut by inserting a thin film of them between the backlight and the display. Furthermore, the narrow color-band frequency emission and small size of these materials help manage the brightness of the display, and almost 80% less power is consumed by this material than LCD and OLED displays.

For instance, Sony and Samsung are developing quantum dot-based 4K and 8K LED LCD TVs. In addition,  these are also popular in optoelectronic devices such as telecom components and lasers to increase their efficiency. Furthermore, they allow LCD technology to grow in the display market for applications such as signage, monitors, and TVs. Hence, such factors are driving the market growth during the forecast period.

Major Market Restrain

The lack of raw material availability for quantum dots is a major challenge hindering the market. Rare earth materials, including cadmium, selenium, zinc, and indium, are used in its manufacturing. In addition, as there are a limited number of suppliers who deal with the quality of raw materials for quantum dots, these materials are very expensive owing to their limited availability and high demand globally.

Moreover, they are created by a variety of processes that employ materials with comparable characteristics. In addition, materials appropriate for the creation of these devices are difficult to obtain. Moreover, cadmium is a hazardous metal that is not environment friendly. Furthermore, cadmium, selenium, and indium are all being employed more and more in the production of these materials. However, due to their scarcity, these commodities should be handled wisely. Hence, such factors are hindering the market growth during the forecast period.

Market Customer Landscape

The market forecasting report includes the adoption lifecycle of the market research and growth, covering from the innovator’s stage to the laggard’s stage. It focuses on adoption rates in different regions based on penetration. Furthermore, the report also includes key purchase criteria and drivers of price sensitivity to help companies evaluate and develop their market growth and trends strategies.

Quantum Dots Market Share by Geography

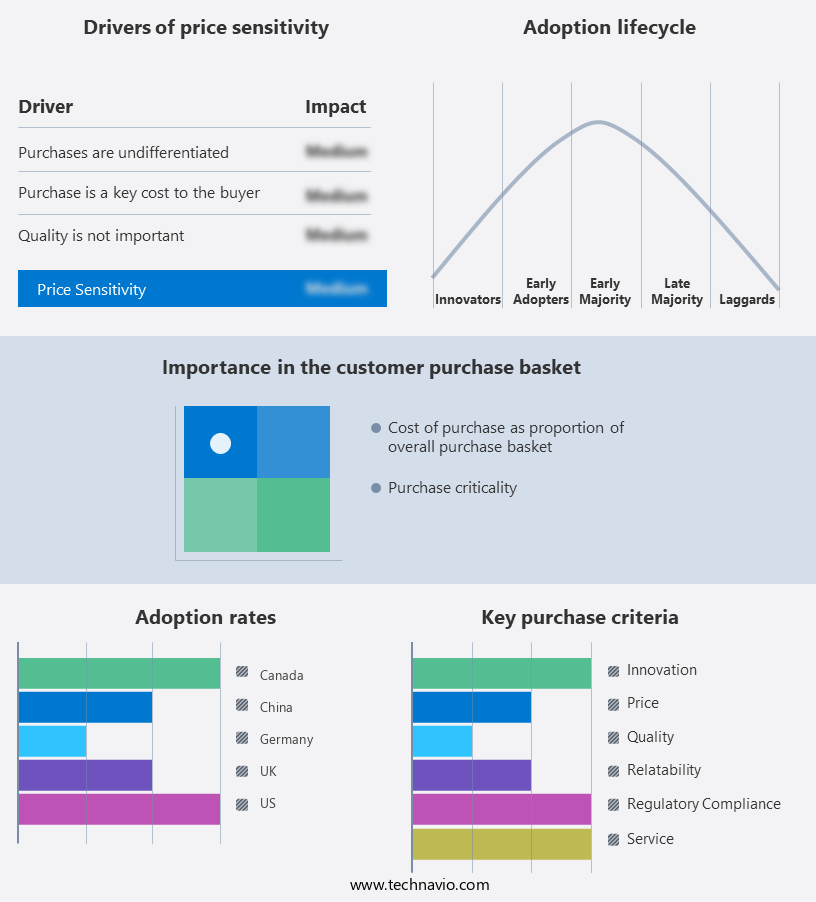
Global Market Customer Landscape

Market Players

Companies are implementing various strategies, such as strategic alliances, partnerships, mergers and acquisitions, geographical expansion, and product/service launches, to enhance their presence in the market.

MaTecK Gmbh: The company offers quantum dots that are used in different applications such as photovoltaic devices, biosensors, flat panel displays, lasers, memory elements, and others.

Market analysis and report of qualitative and quantitative analysis of companies has been conducted to help clients understand the wider business environment as well as the strengths and weaknesses of key market players. Data is qualitatively analyzed to categorize companies as pure play, category-focused, industry-focused, and diversified; it is quantitatively analyzed to categorize companies as dominant, leading, strong, tentative, and weak.

Segment Overview

The market research report provides comprehensive data (region wise segment analysis), with forecasts and estimates in "USD Billion" for the period 2024 to 2028, as well as historical data from 2018 to 2022 for the following segments 

  • Material Outlook
    • Cadmium-based
    • Cadmium-free
  • Product Outlook
    • Displays
    • Others
  • Region Outlook
    • North America
      • The U.S.
      • Canada
    • Europe
      • The U.K.
      • Germany
      • France
      • Rest of Europe
    • APAC
      • China
      • India
    • South America
      • Chile
      • Argentina
      • Brazil
    • Middle East & Africa
      • Saudi Arabia
      • South Africa
      • Rest of the Middle East & Africa

Market Analyst Overview

The market is witnessing rapid growth across various sectors such as consumer electronics companies, agriculture, medicine, and environmental monitoring. Quantum dots, including alloyed quantum dots and core-shell quantum dots, are revolutionizing industries with their unique properties. Applications range from flat-panel LED displays and LED TVs to OLED screens and microLED TVs, offering superior illumination efficiency and luminous efficiency. With advancements like quantum dot enhancement film (QDEF) and nanocell technology, quantum dots are driving innovation in LCD-based QLED panel technology and solid-state lighting. As demand rises for technologically advanced products, the quantum dot industry continues to expand, shaping the future of lighting, displays, and beyond.

Further, the market is witnessing rapid expansion, driven by innovations such as 4K tech and Colloidal QD LED. These advancements cater to diverse applications in the consumer vertical, including fitness trackers and mobile phones, enhancing display quality and energy efficiency. With concerns over heavy metal contamination, Indium and zinc emerge as viable substitutes for cadmium in QD technology, ensuring environmental sustainability. QDs also enable advancements in infrared range applications like night vision and surveillance, while their integration into LCD displays and LED backlighting revolutionizes TV sets and lighting companies. Moreover, QDs facilitate mass production and enhance solar cells efficiency, driving their adoption in greenhouses and optical coherence tomography systems.

Market Scope

Report Coverage

Details

Page number

160

Base year

2023

Historic period

2018-2022

Forecast period

2024-2028

Growth momentum & CAGR

Accelerate at a CAGR of 17.01%

Market Growth 2024-2028

USD 7.09 billion

Market structure

Fragmented

YoY growth 2023-2024(%)

16.34

Regional analysis

North America, Europe, APAC, Middle East and Africa, and South America

Performing market contribution

North America at 38%

Key countries

US, Canada, China, Germany, and UK

Competitive landscape

Leading Companies, Market Positioning of Companies, Competitive Strategies, and Industry Risks

Key companies profiled

American Elements, ams OSRAM AG, Indium Corp., LG Electronics Inc., MaTecK GmbH, Merck KGaA, Nanorh, Nanosys Inc., Nippon Chemical Industrial Co. Ltd., NNCrystal US Corp., Ocean NanoTech LLC, QD Laser Inc., Quantum Solutions UK, RANVOUS Inc., Samsung Electronics Co. Ltd., UbiQD Inc., Core Quantum Technologies, Crystalplex Corp., Strem Chemicals Inc., and XTPL S.A.

Market dynamics

Parent market analysis, Market growth inducers and obstacles, Fast-growing and slow-growing segment analysis, COVID-19 impact and recovery analysis and future consumer dynamics, and Market condition analysis for the forecast period.

Customization purview

If our report has not included the data that you are looking for, you can reach out to our analysts and get segments customized.

Download PDF Sample

What are the Key Data Covered in this Market Research Report?

  • CAGR of the market report forecast during the forecast period
  • Detailed information on factors that will drive the growth of the market  between 2023 and 2028
  • Precise estimation of the market  size and its contribution to the market in focus on the parent market
  • Accurate predictions about upcoming trends and changes in consumer behavior
  • Growth of the market across North America, Europe, APAC, Middle East and Africa, and South America
  • Thorough market analysis and report of the market’s competitive landscape and detailed information about companies
  • Comprehensive analysis of factors that will challenge the growth of Industry companies


We can help! Our analysts can customize this market research report to meet your requirements. Get in touch


1 Executive Summary

  • 1.1 Market overview
    • Exhibit 01: Executive Summary – Chart on Market Overview
    • Exhibit 02: Executive Summary – Data Table on Market Overview
    • Exhibit 03: Executive Summary – Chart on Global Market Characteristics
    • Exhibit 04: Executive Summary – Chart on Market by Geography
    • Exhibit 05: Executive Summary – Chart on Market Segmentation by Material
    • Exhibit 06: Executive Summary – Chart on Market Segmentation by Product
    • Exhibit 07: Executive Summary – Chart on Incremental Growth
    • Exhibit 08: Executive Summary – Data Table on Incremental Growth
    • Exhibit 09: Executive Summary – Chart on Vendor Market Positioning

2 Market Landscape

  • 2.1 Market ecosystem
    • Exhibit 10: Parent market
    • Exhibit 11: Market Characteristics

3 Market Sizing

  • 3.1 Market definition
    • Exhibit 12: Offerings of vendors included in the market definition
  • 3.2 Market segment analysis
    • Exhibit 13: Market segments
  • 3.3 Market size 2023
    • 3.4 Market outlook: Forecast for 2023-2028
      • Exhibit 14: Chart on Global - Market size and forecast 2023-2028 ($ billion)
      • Exhibit 15: Data Table on Global - Market size and forecast 2023-2028 ($ billion)
      • Exhibit 16: Chart on Global Market: Year-over-year growth 2023-2028 (%)
      • Exhibit 17: Data Table on Global Market: Year-over-year growth 2023-2028 (%)

    4 Historic Market Size

    • 4.1 Global quantum dots market 2018 - 2022
      • Exhibit 18: Historic Market Size – Data Table on global quantum dots market 2018 - 2022 ($ billion)
    • 4.2 Material Segment Analysis 2018 - 2022
      • Exhibit 19: Historic Market Size – Material Segment 2018 - 2022 ($ billion)
    • 4.3 Product Segment Analysis 2018 - 2022
      • Exhibit 20: Historic Market Size – Product Segment 2018 - 2022 ($ billion)
    • 4.4 Geography Segment Analysis 2018 - 2022
      • Exhibit 21: Historic Market Size – Geography Segment 2018 - 2022 ($ billion)
    • 4.5 Country Segment Analysis 2018 - 2022
      • Exhibit 22: Historic Market Size – Country Segment 2018 - 2022 ($ billion)

    5 Five Forces Analysis

    • 5.1 Five forces summary
      • Exhibit 23: Five forces analysis - Comparison between 2023 and 2028
    • 5.2 Bargaining power of buyers
      • Exhibit 24: Chart on Bargaining power of buyers – Impact of key factors 2023 and 2028
    • 5.3 Bargaining power of suppliers
      • Exhibit 25: Bargaining power of suppliers – Impact of key factors in 2023 and 2028
    • 5.4 Threat of new entrants
      • Exhibit 26: Threat of new entrants – Impact of key factors in 2023 and 2028
    • 5.5 Threat of substitutes
      • Exhibit 27: Threat of substitutes – Impact of key factors in 2023 and 2028
    • 5.6 Threat of rivalry
      • Exhibit 28: Threat of rivalry – Impact of key factors in 2023 and 2028
    • 5.7 Market condition
      • Exhibit 29: Chart on Market condition - Five forces 2023 and 2028

    6 Market Segmentation by Material

    • 6.1 Market segments
      • Exhibit 30: Chart on Material - Market share 2023-2028 (%)
      • Exhibit 31: Data Table on Material - Market share 2023-2028 (%)
    • 6.2 Comparison by Material
      • Exhibit 32: Chart on Comparison by Material
      • Exhibit 33: Data Table on Comparison by Material
    • 6.3 Cadmium-based - Market size and forecast 2023-2028
      • Exhibit 34: Chart on Cadmium-based - Market size and forecast 2023-2028 ($ billion)
      • Exhibit 35: Data Table on Cadmium-based - Market size and forecast 2023-2028 ($ billion)
      • Exhibit 36: Chart on Cadmium-based - Year-over-year growth 2023-2028 (%)
      • Exhibit 37: Data Table on Cadmium-based - Year-over-year growth 2023-2028 (%)
    • 6.4 Cadmium-free - Market size and forecast 2023-2028
      • Exhibit 38: Chart on Cadmium-free - Market size and forecast 2023-2028 ($ billion)
      • Exhibit 39: Data Table on Cadmium-free - Market size and forecast 2023-2028 ($ billion)
      • Exhibit 40: Chart on Cadmium-free - Year-over-year growth 2023-2028 (%)
      • Exhibit 41: Data Table on Cadmium-free - Year-over-year growth 2023-2028 (%)
    • 6.5 Market opportunity by Material
      • Exhibit 42: Market opportunity by Material ($ billion)
      • Exhibit 43: Data Table on Market opportunity by Material ($ billion)

    7 Market Segmentation by Product

    • 7.1 Market segments
      • Exhibit 44: Chart on Product - Market share 2023-2028 (%)
      • Exhibit 45: Data Table on Product - Market share 2023-2028 (%)
    • 7.2 Comparison by Product
      • Exhibit 46: Chart on Comparison by Product
      • Exhibit 47: Data Table on Comparison by Product
    • 7.3 Displays - Market size and forecast 2023-2028
      • Exhibit 48: Chart on Displays - Market size and forecast 2023-2028 ($ billion)
      • Exhibit 49: Data Table on Displays - Market size and forecast 2023-2028 ($ billion)
      • Exhibit 50: Chart on Displays - Year-over-year growth 2023-2028 (%)
      • Exhibit 51: Data Table on Displays - Year-over-year growth 2023-2028 (%)
    • 7.4 Others - Market size and forecast 2023-2028
      • Exhibit 52: Chart on Others - Market size and forecast 2023-2028 ($ billion)
      • Exhibit 53: Data Table on Others - Market size and forecast 2023-2028 ($ billion)
      • Exhibit 54: Chart on Others - Year-over-year growth 2023-2028 (%)
      • Exhibit 55: Data Table on Others - Year-over-year growth 2023-2028 (%)
    • 7.5 Market opportunity by Product
      • Exhibit 56: Market opportunity by Product ($ billion)
      • Exhibit 57: Data Table on Market opportunity by Product ($ billion)

    8 Customer Landscape

    • 8.1 Customer landscape overview
      • Exhibit 58: Analysis of price sensitivity, lifecycle, customer purchase basket, adoption rates, and purchase criteria

    9 Geographic Landscape

    • 9.1 Geographic segmentation
      • Exhibit 59: Chart on Market share by geography 2023-2028 (%)
      • Exhibit 60: Data Table on Market share by geography 2023-2028 (%)
    • 9.2 Geographic comparison
      • Exhibit 61: Chart on Geographic comparison
      • Exhibit 62: Data Table on Geographic comparison
    • 9.3 North America - Market size and forecast 2023-2028
      • Exhibit 63: Chart on North America - Market size and forecast 2023-2028 ($ billion)
      • Exhibit 64: Data Table on North America - Market size and forecast 2023-2028 ($ billion)
      • Exhibit 65: Chart on North America - Year-over-year growth 2023-2028 (%)
      • Exhibit 66: Data Table on North America - Year-over-year growth 2023-2028 (%)
    • 9.4 Europe - Market size and forecast 2023-2028
      • Exhibit 67: Chart on Europe - Market size and forecast 2023-2028 ($ billion)
      • Exhibit 68: Data Table on Europe - Market size and forecast 2023-2028 ($ billion)
      • Exhibit 69: Chart on Europe - Year-over-year growth 2023-2028 (%)
      • Exhibit 70: Data Table on Europe - Year-over-year growth 2023-2028 (%)
    • 9.5 APAC - Market size and forecast 2023-2028
      • Exhibit 71: Chart on APAC - Market size and forecast 2023-2028 ($ billion)
      • Exhibit 72: Data Table on APAC - Market size and forecast 2023-2028 ($ billion)
      • Exhibit 73: Chart on APAC - Year-over-year growth 2023-2028 (%)
      • Exhibit 74: Data Table on APAC - Year-over-year growth 2023-2028 (%)
    • 9.6 Middle East and Africa - Market size and forecast 2023-2028
      • Exhibit 75: Chart on Middle East and Africa - Market size and forecast 2023-2028 ($ billion)
      • Exhibit 76: Data Table on Middle East and Africa - Market size and forecast 2023-2028 ($ billion)
      • Exhibit 77: Chart on Middle East and Africa - Year-over-year growth 2023-2028 (%)
      • Exhibit 78: Data Table on Middle East and Africa - Year-over-year growth 2023-2028 (%)
    • 9.7 South America - Market size and forecast 2023-2028
      • Exhibit 79: Chart on South America - Market size and forecast 2023-2028 ($ billion)
      • Exhibit 80: Data Table on South America - Market size and forecast 2023-2028 ($ billion)
      • Exhibit 81: Chart on South America - Year-over-year growth 2023-2028 (%)
      • Exhibit 82: Data Table on South America - Year-over-year growth 2023-2028 (%)
    • 9.8 US - Market size and forecast 2023-2028
      • Exhibit 83: Chart on US - Market size and forecast 2023-2028 ($ billion)
      • Exhibit 84: Data Table on US - Market size and forecast 2023-2028 ($ billion)
      • Exhibit 85: Chart on US - Year-over-year growth 2023-2028 (%)
      • Exhibit 86: Data Table on US - Year-over-year growth 2023-2028 (%)
    • 9.9 China - Market size and forecast 2023-2028
      • Exhibit 87: Chart on China - Market size and forecast 2023-2028 ($ billion)
      • Exhibit 88: Data Table on China - Market size and forecast 2023-2028 ($ billion)
      • Exhibit 89: Chart on China - Year-over-year growth 2023-2028 (%)
      • Exhibit 90: Data Table on China - Year-over-year growth 2023-2028 (%)
    • 9.10 Germany - Market size and forecast 2023-2028
      • Exhibit 91: Chart on Germany - Market size and forecast 2023-2028 ($ billion)
      • Exhibit 92: Data Table on Germany - Market size and forecast 2023-2028 ($ billion)
      • Exhibit 93: Chart on Germany - Year-over-year growth 2023-2028 (%)
      • Exhibit 94: Data Table on Germany - Year-over-year growth 2023-2028 (%)
    • 9.11 Canada - Market size and forecast 2023-2028
      • Exhibit 95: Chart on Canada - Market size and forecast 2023-2028 ($ billion)
      • Exhibit 96: Data Table on Canada - Market size and forecast 2023-2028 ($ billion)
      • Exhibit 97: Chart on Canada - Year-over-year growth 2023-2028 (%)
      • Exhibit 98: Data Table on Canada - Year-over-year growth 2023-2028 (%)
    • 9.12 UK - Market size and forecast 2023-2028
      • Exhibit 99: Chart on UK - Market size and forecast 2023-2028 ($ billion)
      • Exhibit 100: Data Table on UK - Market size and forecast 2023-2028 ($ billion)
      • Exhibit 101: Chart on UK - Year-over-year growth 2023-2028 (%)
      • Exhibit 102: Data Table on UK - Year-over-year growth 2023-2028 (%)
    • 9.13 Market opportunity by geography
      • Exhibit 103: Market opportunity by geography ($ billion)
      • Exhibit 104: Data Tables on Market opportunity by geography ($ billion)

    10 Drivers, Challenges, and Trends

    • 10.1 Market drivers
      • 10.2 Market challenges
        • 10.3 Impact of drivers and challenges
          • Exhibit 105: Impact of drivers and challenges in 2023 and 2028
        • 10.4 Market trends

          11 Vendor Landscape

          • 11.1 Overview
            • 11.2 Vendor landscape
              • Exhibit 106: Overview on Criticality of inputs and Factors of differentiation
            • 11.3 Landscape disruption
              • Exhibit 107: Overview on factors of disruption
            • 11.4 Industry risks
              • Exhibit 108: Impact of key risks on business

            12 Vendor Analysis

            • 12.1 Vendors covered
              • Exhibit 109: Vendors covered
            • 12.2 Market positioning of vendors
              • Exhibit 110: Matrix on vendor position and classification
            • 12.3 ams OSRAM AG
              • Exhibit 111: ams OSRAM AG - Overview
              • Exhibit 112: ams OSRAM AG - Business segments
              • Exhibit 113: ams OSRAM AG - Key offerings
              • Exhibit 114: ams OSRAM AG - Segment focus
            • 12.4 Indium Corp.
              • Exhibit 115: Indium Corp. - Overview
              • Exhibit 116: Indium Corp. - Product / Service
              • Exhibit 117: Indium Corp. - Key offerings
            • 12.5 LG Electronics Inc.
              • Exhibit 118: LG Electronics Inc. - Overview
              • Exhibit 119: LG Electronics Inc. - Product / Service
              • Exhibit 120: LG Electronics Inc. - Key offerings
            • 12.6 MaTecK GmbH
              • Exhibit 121: MaTecK GmbH - Overview
              • Exhibit 122: MaTecK GmbH - Product / Service
              • Exhibit 123: MaTecK GmbH - Key offerings
            • 12.7 Merck KGaA
              • Exhibit 124: Merck KGaA - Overview
              • Exhibit 125: Merck KGaA - Business segments
              • Exhibit 126: Merck KGaA - Key news
              • Exhibit 127: Merck KGaA - Key offerings
              • Exhibit 128: Merck KGaA - Segment focus
            • 12.8 Nanosys Inc.
              • Exhibit 129: Nanosys Inc. - Overview
              • Exhibit 130: Nanosys Inc. - Product / Service
              • Exhibit 131: Nanosys Inc. - Key offerings
            • 12.9 Nippon Chemical Industrial Co. Ltd.
              • Exhibit 132: Nippon Chemical Industrial Co. Ltd. - Overview
              • Exhibit 133: Nippon Chemical Industrial Co. Ltd. - Product / Service
              • Exhibit 134: Nippon Chemical Industrial Co. Ltd. - Key offerings
            • 12.10 NNCrystal US Corp.
              • Exhibit 135: NNCrystal US Corp. - Overview
              • Exhibit 136: NNCrystal US Corp. - Product / Service
              • Exhibit 137: NNCrystal US Corp. - Key offerings
            • 12.11 Ocean NanoTech LLC
              • Exhibit 138: Ocean NanoTech LLC - Overview
              • Exhibit 139: Ocean NanoTech LLC - Product / Service
              • Exhibit 140: Ocean NanoTech LLC - Key offerings
            • 12.12 QD Laser Inc.
              • Exhibit 141: QD Laser Inc. - Overview
              • Exhibit 142: QD Laser Inc. - Product / Service
              • Exhibit 143: QD Laser Inc. - Key offerings
            • 12.13 Quantum Solutions UK
              • Exhibit 144: Quantum Solutions UK - Overview
              • Exhibit 145: Quantum Solutions UK - Product / Service
              • Exhibit 146: Quantum Solutions UK - Key offerings
            • 12.14 Samsung Electronics Co. Ltd.
              • Exhibit 147: Samsung Electronics Co. Ltd. - Overview
              • Exhibit 148: Samsung Electronics Co. Ltd. - Business segments
              • Exhibit 149: Samsung Electronics Co. Ltd. - Key news
              • Exhibit 150: Samsung Electronics Co. Ltd. - Key offerings
              • Exhibit 151: Samsung Electronics Co. Ltd. - Segment focus
            • 12.15 Strem Chemicals Inc.
              • Exhibit 152: Strem Chemicals Inc. - Overview
              • Exhibit 153: Strem Chemicals Inc. - Product / Service
              • Exhibit 154: Strem Chemicals Inc. - Key offerings
            • 12.16 UbiQD Inc.
              • Exhibit 155: UbiQD Inc. - Overview
              • Exhibit 156: UbiQD Inc. - Product / Service
              • Exhibit 157: UbiQD Inc. - Key offerings
            • 12.17 XTPL S.A.
              • Exhibit 158: XTPL S.A. - Overview
              • Exhibit 159: XTPL S.A. - Product / Service
              • Exhibit 160: XTPL S.A. - Key offerings

            13 Appendix

            • 13.1 Scope of the report
              • 13.2 Inclusions and exclusions checklist
                • Exhibit 161: Inclusions checklist
                • Exhibit 162: Exclusions checklist
              • 13.3 Currency conversion rates for US$
                • Exhibit 163: Currency conversion rates for US$
              • 13.4 Research methodology
                • Exhibit 164: Research methodology
                • Exhibit 165: Validation techniques employed for market sizing
                • Exhibit 166: Information sources
              • 13.5 List of abbreviations
                • Exhibit 167: List of abbreviations

              Research Methodology

              Technavio presents a detailed picture of the market by way of study, synthesis, and summation of data from multiple sources. The analysts have presented the various facets of the market with a particular focus on identifying the key industry influencers. The data thus presented is comprehensive, reliable, and the result of extensive research, both primary and secondary.

              INFORMATION SOURCES

              Primary sources

              • Manufacturers and suppliers
              • Channel partners
              • Industry experts
              • Strategic decision makers

              Secondary sources

              • Industry journals and periodicals
              • Government data
              • Financial reports of key industry players
              • Historical data
              • Press releases

              DATA ANALYSIS

              Data Synthesis

              • Collation of data
              • Estimation of key figures
              • Analysis of derived insights

              Data Validation

              • Triangulation with data models
              • Reference against proprietary databases
              • Corroboration with industry experts

              REPORT WRITING

              Qualitative

              • Market drivers
              • Market challenges
              • Market trends
              • Five forces analysis

              Quantitative

              • Market size and forecast
              • Market segmentation
              • Geographical insights
              • Competitive landscape

              Interested in this report?

              Get your sample now to see our research methodology and insights!

              Download Now

              Frequently Asked Questions

              Quantum Dots market growth will increase by $ 7.09 bn during 2024-2028.

              The Quantum Dots market is expected to grow at a CAGR of 17.01% during 2024-2028.

              Quantum Dots market is segmented by Material( Cadmium-based, Cadmium-free) Product( Displays, Others)

              American Elements, ams OSRAM AG, Indium Corp., LG Electronics Inc., MaTecK GmbH, Merck KGaA, Nanorh, Nanosys Inc., Nippon Chemical Industrial Co. Ltd., NNCrystal US Corp., Ocean NanoTech LLC, QD Laser Inc., Quantum Solutions UK, RANVOUS Inc., Samsung Electronics Co. Ltd., UbiQD Inc., Core Quantum Technologies, Crystalplex Corp., Strem Chemicals Inc., XTPL S.A. are a few of the key vendors in the Quantum Dots market.

              North America will register the highest growth rate of 38% among the other regions. Therefore, the Quantum Dots market in North America is expected to garner significant business opportunities for the vendors during the forecast period.

              US, Canada, China, Germany, UK

              • Increasing demand for optimized devices with better performance and high resolutionThe increasing demand for optimized devices with better performance and high resolution has gained market traction in the last few years in multiple domains is the driving factor this market.
              • such as consumer electronics and communication. Modern screens not only have improved brightness and contrast ratios is the driving factor this market.
              • but they also have higher resolutions and use less power than older displays. Display makers are designing screens with higher characteristics to increase their market position. Quantum dots are widely utilized in display systems because they provide richer color resolution is the driving factor this market.
              • better color purity is the driving factor this market.
              • a highly immersive high-dynamic-range (HDR) experience is the driving factor this market.
              • and superior energy efficiency than traditional displays. Because quantum dots have narrow emission spectra and broad excitation profiles is the driving factor this market.
              • they can more efficiently convert light into any hue in the visible spectrum. Quantum dots are often employed by display makers due to their increased features. Quantum dots is the driving factor this market.
              • semiconductor nanoparticles with unique optical and electronic properties is the driving factor this market.
              • offer significant advantages in applications such as displays is the driving factor this market.
              • lighting is the driving factor this market.
              • solar cells is the driving factor this market.
              • and medical imaging. In the display industry is the driving factor this market.
              • quantum dots are utilized to enhance color accuracy is the driving factor this market.
              • brightness is the driving factor this market.
              • and energy efficiency in LCD and OLED screens is the driving factor this market.
              • catering to the growing consumer preference for high-quality visual experiences. Similarly is the driving factor this market.
              • in the lighting sector is the driving factor this market.
              • quantum dot technology enables the production of more efficient and vibrant lighting solutions compared with traditional LEDs is the driving factor this market.
              • driving adoption in commercial is the driving factor this market.
              • residential is the driving factor this market.
              • and automotive lighting solutions. TV manufacturers are producing 4K ultra-high-definition (UHD) TVs that display superior optical properties and have a wide field of view. With an increase in UHD content providers worldwide is the driving factor this market.
              • the demand for 4K UHD TVs is on the rise. The increasing consumer base for large displays and high-resolution displays across the world is expected to drive the overall growth of the global quantum dots market during the forecast period. is the driving factor this market.

              The Quantum Dots market vendors should focus on grabbing business opportunities from the Cadmium-based segment as it accounted for the largest market share in the base year.