Outdoor Apparel Market Analysis, Size, and Forecast 2026-2030: North America (US, Canada, and Mexico), Europe (Germany, UK, and France), APAC (China, Japan, and India), South America (Brazil and Argentina), Middle East and Africa (Saudi Arabia, UAE, and South Africa), and Rest of World (ROW)

Outdoor Apparel Market Analysis, Size, and Forecast 2026-2030:
North America (US, Canada, and Mexico), Europe (Germany, UK, and France), APAC (China, Japan, and India), South America (Brazil and Argentina), Middle East and Africa (Saudi Arabia, UAE, and South Africa), and Rest of World (ROW)

Published: Apr 2026 293 Pages SKU: IRTNTR40137

Market Overview at a Glance

$8.20 B
Market Opportunity
6.8%
CAGR 2025 - 2030
32.1%
Europe Growth
$12.39 B
Offline segment 2024

Outdoor Apparel Market Size 2026-2030

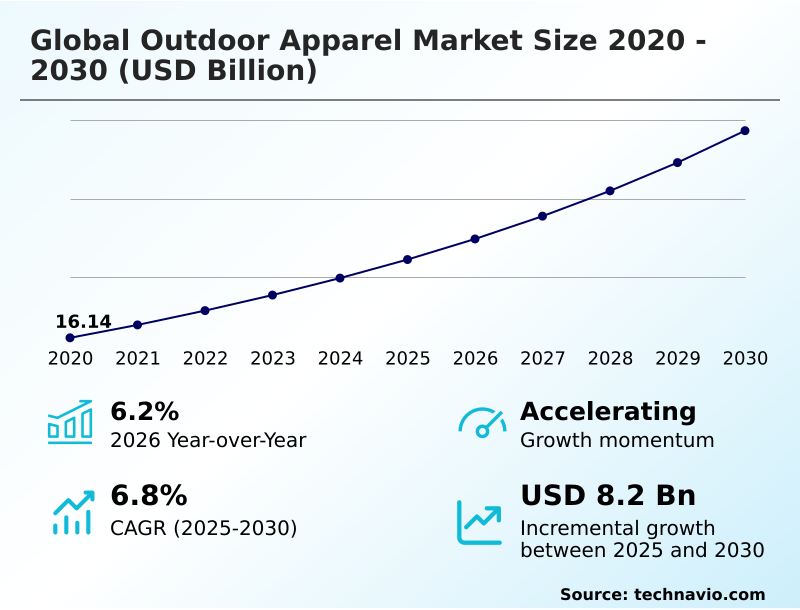
The outdoor apparel market size is valued to increase by USD 8.20 billion, at a CAGR of 6.8% from 2025 to 2030. Institutionalization of heat hacking and climate adaptation technologies will drive the outdoor apparel market.

Major Market Trends & Insights

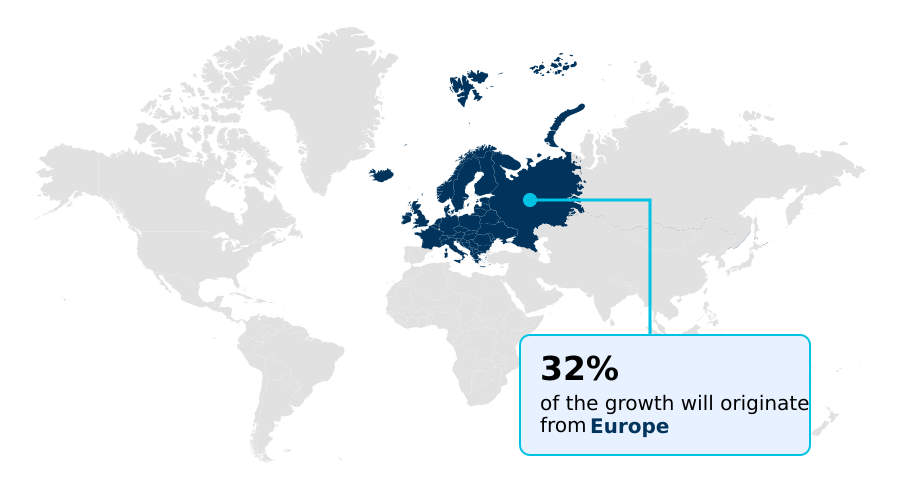
  • Europe dominated the market and accounted for a 32.1% growth during the forecast period.
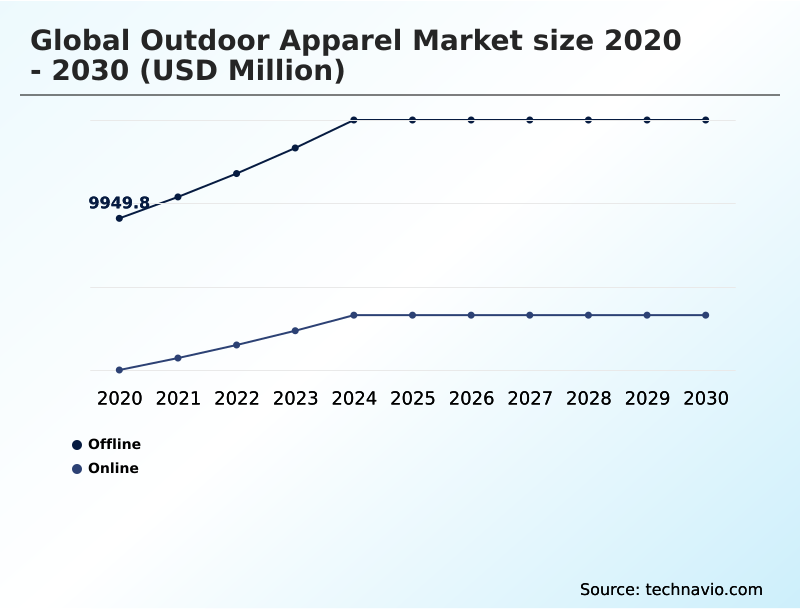
  • By Distribution Channel - Offline segment was valued at USD 12.39 billion in 2024
  • By Product Type - Top wear segment accounted for the largest market revenue share in 2024

Market Size & Forecast

  • Market Opportunities: USD 13.18 billion
  • Market Future Opportunities: USD 8.20 billion
  • CAGR from 2025 to 2030 : 6.8%

Market Summary

  • The outdoor apparel market is undergoing a significant transformation, evolving from a niche segment for specialized athletes to a mainstream lifestyle category. This shift is driven by a growing consumer focus on health, wellness, and outdoor recreation, alongside the rise of urban technical fashion.
  • Key market dynamics include a strong push toward technological innovation in materials, such as waterproof-breathable membranes and high-performance thermal regulation technology, to meet demands for both functionality and versatility. Concurrently, sustainability has become a non-negotiable aspect, challenging firms to rethink their entire value chain.
  • For instance, a company transitioning to a circular model must address complex operational logistics, from designing garments for disassembly using mono-material textile design to establishing efficient garment-to-garment recycling programs.
  • This strategic pivot impacts everything from sourcing recycled polyester feedstock to managing reverse logistics, representing a fundamental change in business operations that requires significant investment but also offers a powerful competitive advantage in an increasingly eco-conscious market.

What will be the Size of the Outdoor Apparel Market during the forecast period?

Get Key Insights on Market Forecast (PDF) Request Free Sample

How is the Outdoor Apparel Market Segmented?

The outdoor apparel industry research report provides comprehensive data (region-wise segment analysis), with forecasts and estimates in "USD million" for the period 2026-2030, as well as historical data from 2020-2024 for the following segments.

  • Distribution channel
    • Offline
    • Online
  • Product type
    • Top wear
    • Bottom wear
    • Coveralls
    • Others
  • End-user
    • Men
    • Women
    • Kids
    • Unisex
  • Geography
    • North America
      • US
      • Canada
      • Mexico
    • Europe
      • Germany
      • UK
      • France
    • APAC
      • China
      • Japan
      • India
    • South America
      • Brazil
      • Argentina
    • Middle East and Africa
      • Saudi Arabia
      • UAE
      • South Africa
    • Rest of World (ROW)

By Distribution Channel Insights

The offline segment is estimated to witness significant growth during the forecast period.

The offline segment remains integral, offering crucial consumer touchpoints that digital channels cannot replicate. Physical retail enables essential tactile fabric evaluation, allowing customers to assess high-loft synthetic insulation and seam-sealed garment construction firsthand.

This hands-on experience is critical for products featuring phase-change material integration and advanced anti-odor fabric treatment. Despite challenges from volatile supply chains, which can impact inventory, the in-store environment provides a unique opportunity for expert consultation on fit and function.

For instance, brands utilizing innovative four-way stretch material and demonstrating superior down insulation fill power can build significant consumer confidence.

This direct interaction helps justify premium pricing, with informed staff explaining technical metrics like moisture vapor transmission rate and the benefits of pfc-free water repellency, reinforcing brand value beyond the digital shelf.

Request Free Sample

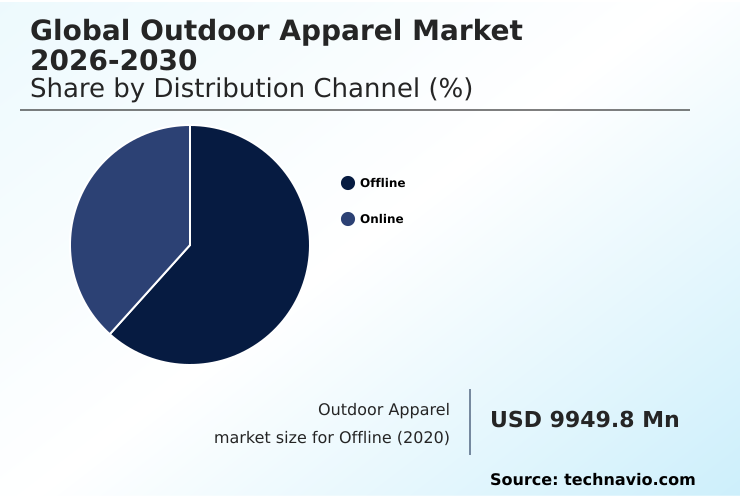
The Offline segment was valued at USD 12.39 billion in 2024 and showed a gradual increase during the forecast period.

Request Free Sample

Regional Analysis

Europe is estimated to contribute 32.1% to the growth of the global market during the forecast period.Technavio’s analysts have elaborately explained the regional trends and drivers that shape the market during the forecast period.

See How Outdoor Apparel Market Demand is Rising in Europe Request Free Sample

Geographic dynamics in the outdoor apparel market are shifting, with mature regions like Europe and North America driving innovation in sustainability while APAC emerges as a powerful growth engine.

Europe, which accounts for 32.1% of the market's incremental growth, is heavily influenced by stringent regulations such as extended producer responsibility, making supply chain transparency essential.

In North America, where consumer demand for technical fabric abrasion resistance and effective moisture-wicking base layers is high, there is a focus on high-performance materials like advanced waterproof-breathable membranes.

Firms are establishing localized manufacturing hubs to better manage technical textile sourcing and serve regional needs.

This strategy improves responsiveness, with some brands achieving a 15% reduction in logistical lead times, and allows for specialized offerings based on regional climates and activities.

Market Dynamics

Our researchers analyzed the data with 2025 as the base year, along with the key drivers, trends, and challenges. A holistic analysis of drivers will help companies refine their marketing strategies to gain a competitive advantage.

  • The global outdoor apparel market is increasingly defined by the sophisticated interplay between extreme performance, sustainability, and versatile aesthetics. The demand for high-performance thermoregulating smart textiles for alpine use is pushing the boundaries of material science, with developments in carbon-fiber-infused fabrics for extreme environment protection.
  • Consumers now conduct detailed waterproof breathable membrane performance comparison in jackets and analyze the effectiveness of PFC-free durable water repellent (DWR) effectiveness on shells. This technical scrutiny extends to a granular ultra-lightweight backpacking gear weight-to-durability ratio analysis.
  • Simultaneously, sustainability is a core driver, compelling a shift toward circular design principles for end-of-life disassembly and a thorough recycled polyester vs virgin material lifecycle analysis. This has elevated the importance of supply chain transparency in raw material sourcing for apparel. Firms face challenges in achieving mono-material textile design at scale while navigating volatile specialized textile supply chains.
  • The market also reflects cultural shifts, with urban outdoor fashion trends and gorpcore aesthetics merging technical climbing apparel for high-altitude environments with everyday wear.
  • This convergence demands innovation, from advanced moisture-wicking and insulation technologies for baselayers to the integration of modular cooling systems in performance wear, all while adhering to mandates like extended producer responsibility, which can impact operational costs by over 10% if not properly managed.

What are the key market drivers leading to the rise in the adoption of Outdoor Apparel Industry?

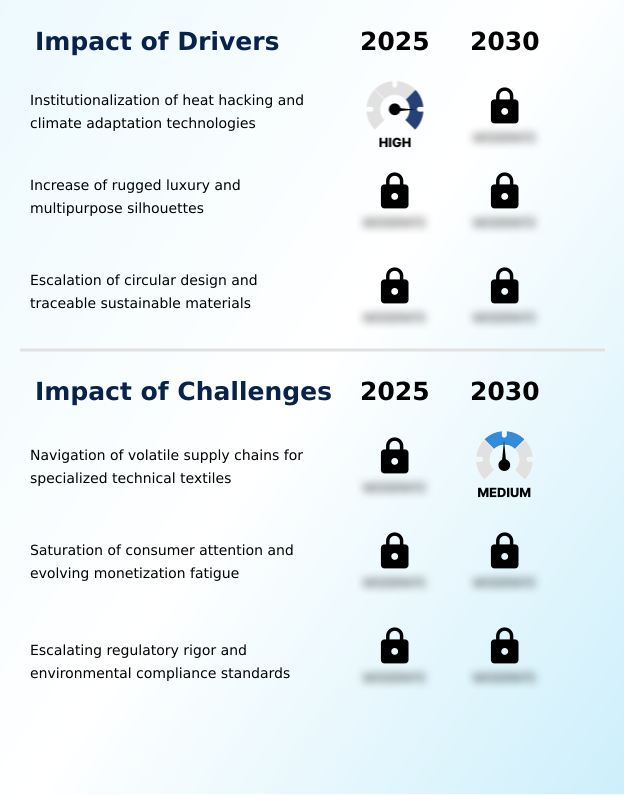
  • The institutionalization of heat hacking and climate adaptation technologies serves as a key driver for the market's growth and innovation.

  • Market growth is propelled by a confluence of climate adaptation, ethical consumerism, and lifestyle shifts.
  • The institutionalization of heat hacking technologies is creating a new class of climate-adaptive apparel, with demand for items featuring chemical-free UV protection growing by over 25% in sun-belt regions.
  • This functional necessity is paired with the rise of rugged luxury and multipurpose silhouettes, which blend high performance with workleisure and sophisticated escapism aesthetics, expanding the consumer base.
  • The most significant driver remains the push for traceable sustainable materials, where circular design principles and made-for-disassembly construction are paramount.
  • Given that supply disruptions have inflated raw material costs by an average of 18% for some specialized textiles, establishing certified recycled textiles and fair-labor practices verification is now a key strategy for both risk mitigation and brand differentiation.

What are the market trends shaping the Outdoor Apparel Industry?

  • The industrialization of circular textile ecosystems represents a significant upcoming market trend. This movement prioritizes closed-loop manufacturing processes over traditional linear production models.

  • Key market trends are reshaping production and consumer engagement. The industrialization of circular textile ecosystems is accelerating, compelling a move towards mono-material textile design to facilitate end-of-life disassembly. This is critical, as automated monitoring now flags over 90% of unsubstantiated environmental claims, forcing authentic transparency.
  • Simultaneously, the gorpcore fashion movement is driving the adoption of high-performance technologies in everyday wear, increasing the relevance of metrics like a high hydrostatic head rating even for urban-focused products.
  • The advancement of thermoregulating smart textiles, incorporating knit-to-shape designs and smart textile sensor integration, is enhancing user experience, with some applications demonstrating a 20% improvement in maintaining thermal comfort during fluctuating activity levels, highlighting a clear performance benefit.

What challenges does the Outdoor Apparel Industry face during its growth?

  • Navigating volatile supply chains for specialized technical textiles presents a key challenge affecting the outdoor apparel industry's growth and stability.

  • The market faces significant operational and regulatory hurdles. The challenge of navigating volatile supply chains for specialized technical textiles, such as high-tenacity nylon yarns, remains paramount, as reliance on a few certified suppliers can disrupt production schedules tied to as much as 70% of annual revenue.
  • Concurrently, escalating regulatory rigor around environmental compliance standards is forcing a rapid transition to non-fluorinated DWR alternatives, a process complicated by consumer attention saturation, which makes it difficult for brands to communicate the value of these costly proprietary material innovations. The proliferation of digital product passports is one response aimed at combating counterfeit goods and validating sustainability claims.
  • However, achieving compliance can be costly, with penalties for failing to meet new standards reaching up to 10% of global turnover in certain jurisdictions.

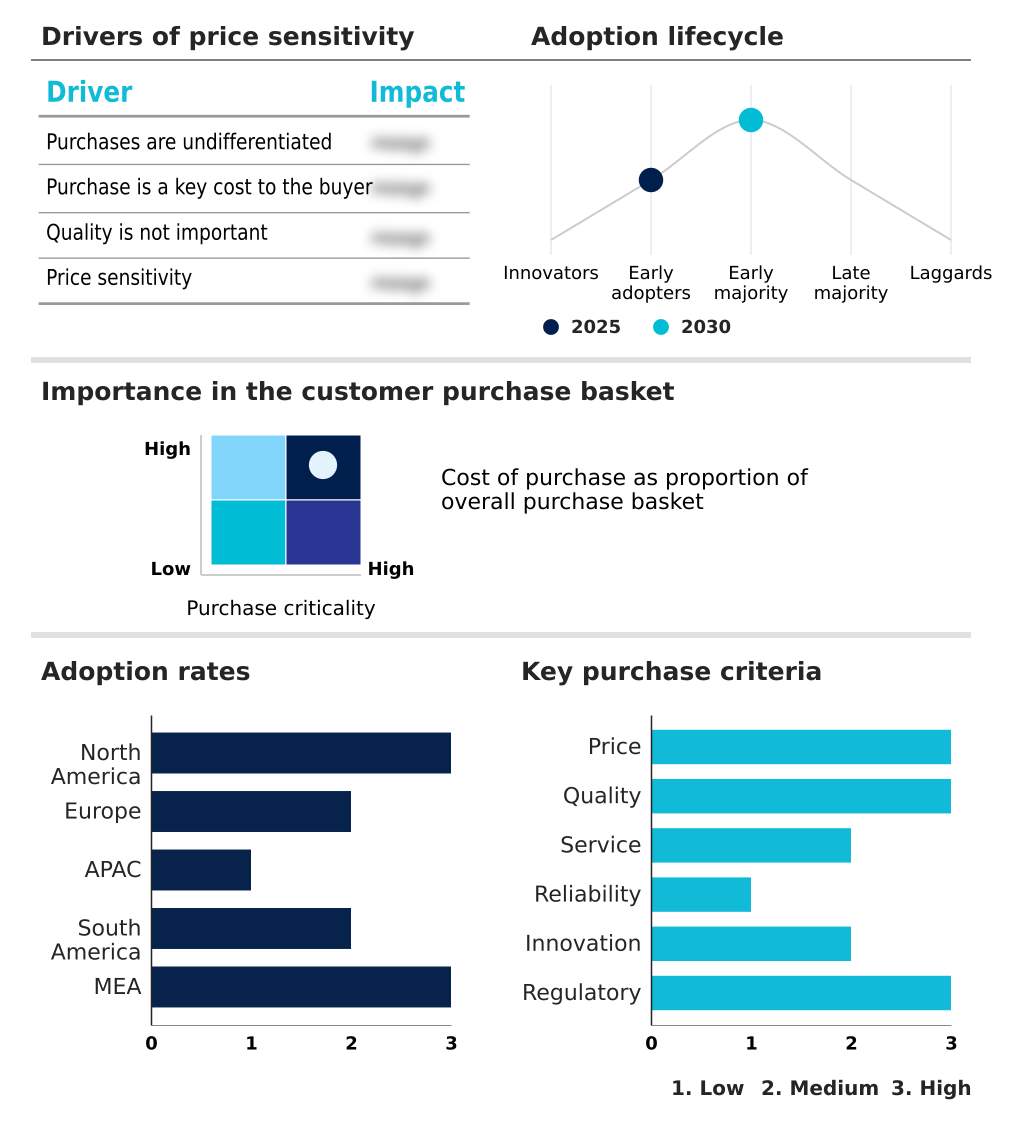
Exclusive Technavio Analysis on Customer Landscape

The outdoor apparel market forecasting report includes the adoption lifecycle of the market, covering from the innovator’s stage to the laggard’s stage. It focuses on adoption rates in different regions based on penetration. Furthermore, the outdoor apparel market report also includes key purchase criteria and drivers of price sensitivity to help companies evaluate and develop their market growth analysis strategies.

Customer Landscape of Outdoor Apparel Industry

Competitive Landscape

Companies are implementing various strategies, such as strategic alliances, outdoor apparel market forecast, partnerships, mergers and acquisitions, geographical expansion, and product/service launches, to enhance their presence in the industry.

Arcteryx Sports Corp. - Key offerings include technical outdoor apparel like the Alpha SV and Beta AR jackets, part of a broader portfolio of high-performance gear and accessories.

The industry research and growth report includes detailed analyses of the competitive landscape of the market and information about key companies, including:

  • Arcteryx Sports Corp.
  • Black Diamond Equipment Ltd.
  • Columbia Sportswear Co.
  • Cotopaxi Inc.
  • DIRECT ALPINE s.r.o.
  • Fjallraven Retail USA LLC
  • Helly Hansen AS
  • Jack Wolfskin
  • KUHL Inc.
  • L.L. Bean Inc.
  • Mammut Sports Group AG
  • Marmot Mountain LLC.
  • Montbell America Inc.
  • Mountain Hardwear Inc.
  • Norrona Sport AS
  • Outdoor Research
  • Patagonia Inc.
  • Prana Living LLC
  • Salomon Group
  • Smartwool LLC

Qualitative and quantitative analysis of companies has been conducted to help clients understand the wider business environment as well as the strengths and weaknesses of key industry players. Data is qualitatively analyzed to categorize companies as pure play, category-focused, industry-focused, and diversified; it is quantitatively analyzed to categorize companies as dominant, leading, strong, tentative, and weak.

Recent Development and News in Outdoor apparel market

  • In March 2025, Black Diamond Equipment entered into a strategic partnership with Polartec to launch a new line of technical climbing apparel featuring advanced moisture-wicking and insulation technologies.
  • In August 2025, Columbia Sportswear launched its new global brand platform, 'Engineered for Whatever,' using a digital-first marketing strategy to highlight the durability of its proprietary technologies.
  • In March 2025, Patagonia publicly reinforced its strategic commitment to restructuring its supply chains with the goal of achieving 100% usage of recycled or renewable materials by the end of the decade.
  • In May 2025, Patagonia announced the complete transition of its technical shell production to use 100% recycled polyester and bio-based synthetics, a move resonating with conservation-focused sectors.

Dive into Technavio’s robust research methodology, blending expert interviews, extensive data synthesis, and validated models for unparalleled Outdoor Apparel Market insights. See full methodology.

Market Scope
Page number 293
Base year 2025
Historic period 2020-2024
Forecast period 2026-2030
Growth momentum & CAGR Accelerate at a CAGR of 6.8%
Market growth 2026-2030 USD 8196.1 million
Market structure Fragmented
YoY growth 2025-2026(%) 6.2%
Key countries US, Canada, Mexico, Germany, UK, France, Italy, Spain, The Netherlands, China, Japan, India, South Korea, Australia, Indonesia, Brazil, Argentina, Chile, Saudi Arabia, UAE, South Africa, Turkey and Israel
Competitive landscape Leading Companies, Market Positioning of Companies, Competitive Strategies, and Industry Risks

Request Free Sample

Research Analyst Overview

  • The outdoor apparel market is advancing beyond seasonal collections to a new paradigm of material science and circularity. Boardroom decisions are now centered on long-term investments in sustainable innovation, driven by regulatory pressures and consumer demand for transparency. The strategic implementation of circular textile ecosystems is becoming a critical differentiator, moving beyond concept to operational reality.
  • This involves a fundamental re-engineering of the supply chain to incorporate bio-based polymer fibers and facilitate garment-to-garment recycling. The adoption of extended producer responsibility mandates is a pivotal factor, with non-compliance in some regions threatening penalties of up to 10% of global turnover, thereby directly linking environmental strategy to financial performance.
  • Companies are leveraging digital product passports to validate claims of supply chain transparency and the use of recycled polyester feedstock. This intricate landscape requires a focus on high-performance features like advanced waterproof-breathable membranes, effective pfc-free durable water repellent finishes, and climate-adaptive apparel, ensuring that technical prowess and ecological accountability are intrinsically linked for future success.

What are the Key Data Covered in this Outdoor Apparel Market Research and Growth Report?

  • What is the expected growth of the Outdoor Apparel Market between 2026 and 2030?

    • USD 8.20 billion, at a CAGR of 6.8%

  • What segmentation does the market report cover?

    • The report is segmented by Distribution Channel (Offline, and Online), Product Type (Top wear, Bottom wear, Coveralls, and Others), End-user (Men, Women, Kids, and Unisex) and Geography (North America, Europe, APAC, South America, Middle East and Africa)

  • Which regions are analyzed in the report?

    • North America, Europe, APAC, South America and Middle East and Africa

  • What are the key growth drivers and market challenges?

    • Institutionalization of heat hacking and climate adaptation technologies, Navigation of volatile supply chains for specialized technical textiles

  • Who are the major players in the Outdoor Apparel Market?

    • Arcteryx Sports Corp., Black Diamond Equipment Ltd., Columbia Sportswear Co., Cotopaxi Inc., DIRECT ALPINE s.r.o., Fjallraven Retail USA LLC, Helly Hansen AS, Jack Wolfskin, KUHL Inc., L.L. Bean Inc., Mammut Sports Group AG, Marmot Mountain LLC., Montbell America Inc., Mountain Hardwear Inc., Norrona Sport AS, Outdoor Research, Patagonia Inc., Prana Living LLC, Salomon Group and Smartwool LLC

Market Research Insights

  • The market's dynamic nature is shaped by intense competition and evolving consumer ethics. Innovations such as advanced insulation mapping and biomimetic fiber engineering are becoming standard, while the adoption of PFC-free water repellency is now a baseline expectation.
  • The shift towards circular design principles is not just a trend but a strategic necessity, with branded resale and repair platforms gaining significant traction. Operationally, this pivot to sustainability yields tangible results; some firms leveraging localized manufacturing hubs for technical textile sourcing have mitigated raw material cost volatility by up to 18%.
  • In contrast, a failure in supply chain transparency carries high risk, as automated green claim monitoring systems now flag over 90% of misleading environmental marketing, underscoring the importance of verifiable environmental compliance standards.

We can help! Our analysts can customize this outdoor apparel market research report to meet your requirements.

Get in touch

1. Executive Summary

1.1 Market overview

Executive Summary - Chart on Market Overview
Executive Summary - Data Table on Market Overview
Executive Summary - Chart on Global Market Characteristics
Executive Summary - Chart on Market by Geography
Executive Summary - Chart on Market Segmentation by Distribution Channel
Executive Summary - Chart on Market Segmentation by Product Type
Executive Summary - Chart on Market Segmentation by End-user
Executive Summary - Chart on Incremental Growth
Executive Summary - Data Table on Incremental Growth
Executive Summary - Chart on Company Market Positioning

2. Technavio Analysis

2.1 Analysis of price sensitivity, lifecycle, customer purchase basket, adoption rates, and purchase criteria

2.2 Criticality of inputs and Factors of differentiation

Chart on Overview on criticality of inputs and factors of differentiation

2.3 Factors of disruption

Chart on Overview on factors of disruption

2.4 Impact of drivers and challenges

Chart on Impact of drivers and challenges in 2025 and 2030

3. Market Landscape

3.1 Market ecosystem

Chart on Parent Market
Data Table on - Parent Market

3.2 Market characteristics

Chart on Market characteristics analysis

3.3 Value chain analysis

Chart on Value chain analysis

4. Market Sizing

4.1 Market definition

Data Table on Offerings of companies included in the market definition

4.2 Market segment analysis

Market segments

4.3 Market size 2025

4.4 Market outlook: Forecast for 2025-2030

Chart on Global - Market size and forecast 2025-2030 ($ million)
Data Table on Global - Market size and forecast 2025-2030 ($ million)
Chart on Global Market: Year-over-year growth 2025-2030 (%)
Data Table on Global Market: Year-over-year growth 2025-2030 (%)

5. Historic Market Size

5.1 Global Outdoor Apparel Market 2020 - 2024

Historic Market Size - Data Table on Global Outdoor Apparel Market 2020 - 2024 ($ million)

5.2 Distribution Channel segment analysis 2020 - 2024

Historic Market Size - Distribution Channel Segment 2020 - 2024 ($ million)

5.3 Product Type segment analysis 2020 - 2024

Historic Market Size - Product Type Segment 2020 - 2024 ($ million)

5.4 End-user segment analysis 2020 - 2024

Historic Market Size - End-user Segment 2020 - 2024 ($ million)

5.5 Geography segment analysis 2020 - 2024

Historic Market Size - Geography Segment 2020 - 2024 ($ million)

5.6 Country segment analysis 2020 - 2024

Historic Market Size - Country Segment 2020 - 2024 ($ million)

6. Qualitative Analysis

6.1 Impact of AI in global outdoor apparel market

6.2 Impact of geopolitical conflict on global outdoor apparel market

7. Five Forces Analysis

7.1 Five forces summary

Five forces analysis - Comparison between 2025 and 2030

7.2 Bargaining power of buyers

Bargaining power of buyers - Impact of key factors 2025 and 2030

7.3 Bargaining power of suppliers

Bargaining power of suppliers - Impact of key factors in 2025 and 2030

7.4 Threat of new entrants

Threat of new entrants - Impact of key factors in 2025 and 2030

7.5 Threat of substitutes

Threat of substitutes - Impact of key factors in 2025 and 2030

7.6 Threat of rivalry

Threat of rivalry - Impact of key factors in 2025 and 2030

7.7 Market condition

Chart on Market condition - Five forces 2025 and 2030

8. Market Segmentation by Distribution Channel

8.1 Market segments

Chart on Distribution Channel - Market share 2025-2030 (%)
Data Table on Distribution Channel - Market share 2025-2030 (%)

8.2 Comparison by Distribution Channel

Chart on Comparison by Distribution Channel
Data Table on Comparison by Distribution Channel

8.3 Offline - Market size and forecast 2025-2030

Chart on Offline - Market size and forecast 2025-2030 ($ million)
Data Table on Offline - Market size and forecast 2025-2030 ($ million)
Chart on Offline - Year-over-year growth 2025-2030 (%)
Data Table on Offline - Year-over-year growth 2025-2030 (%)

8.4 Online - Market size and forecast 2025-2030

Chart on Online - Market size and forecast 2025-2030 ($ million)
Data Table on Online - Market size and forecast 2025-2030 ($ million)
Chart on Online - Year-over-year growth 2025-2030 (%)
Data Table on Online - Year-over-year growth 2025-2030 (%)

8.5 Market opportunity by Distribution Channel

Market opportunity by Distribution Channel ($ million)
Data Table on Market opportunity by Distribution Channel ($ million)

9. Market Segmentation by Product Type

9.1 Market segments

Chart on Product Type - Market share 2025-2030 (%)
Data Table on Product Type - Market share 2025-2030 (%)

9.2 Comparison by Product Type

Chart on Comparison by Product Type
Data Table on Comparison by Product Type

9.3 Top wear - Market size and forecast 2025-2030

Chart on Top wear - Market size and forecast 2025-2030 ($ million)
Data Table on Top wear - Market size and forecast 2025-2030 ($ million)
Chart on Top wear - Year-over-year growth 2025-2030 (%)
Data Table on Top wear - Year-over-year growth 2025-2030 (%)

9.4 Bottom wear - Market size and forecast 2025-2030

Chart on Bottom wear - Market size and forecast 2025-2030 ($ million)
Data Table on Bottom wear - Market size and forecast 2025-2030 ($ million)
Chart on Bottom wear - Year-over-year growth 2025-2030 (%)
Data Table on Bottom wear - Year-over-year growth 2025-2030 (%)

9.5 Coveralls - Market size and forecast 2025-2030

Chart on Coveralls - Market size and forecast 2025-2030 ($ million)
Data Table on Coveralls - Market size and forecast 2025-2030 ($ million)
Chart on Coveralls - Year-over-year growth 2025-2030 (%)
Data Table on Coveralls - Year-over-year growth 2025-2030 (%)

9.6 Others - Market size and forecast 2025-2030

Chart on Others - Market size and forecast 2025-2030 ($ million)
Data Table on Others - Market size and forecast 2025-2030 ($ million)
Chart on Others - Year-over-year growth 2025-2030 (%)
Data Table on Others - Year-over-year growth 2025-2030 (%)

9.7 Market opportunity by Product Type

Market opportunity by Product Type ($ million)
Data Table on Market opportunity by Product Type ($ million)

10. Market Segmentation by End-user

10.1 Market segments

Chart on End-user - Market share 2025-2030 (%)
Data Table on End-user - Market share 2025-2030 (%)

10.2 Comparison by End-user

Chart on Comparison by End-user
Data Table on Comparison by End-user

10.3 Men - Market size and forecast 2025-2030

Chart on Men - Market size and forecast 2025-2030 ($ million)
Data Table on Men - Market size and forecast 2025-2030 ($ million)
Chart on Men - Year-over-year growth 2025-2030 (%)
Data Table on Men - Year-over-year growth 2025-2030 (%)

10.4 Women - Market size and forecast 2025-2030

Chart on Women - Market size and forecast 2025-2030 ($ million)
Data Table on Women - Market size and forecast 2025-2030 ($ million)
Chart on Women - Year-over-year growth 2025-2030 (%)
Data Table on Women - Year-over-year growth 2025-2030 (%)

10.5 Kids - Market size and forecast 2025-2030

Chart on Kids - Market size and forecast 2025-2030 ($ million)
Data Table on Kids - Market size and forecast 2025-2030 ($ million)
Chart on Kids - Year-over-year growth 2025-2030 (%)
Data Table on Kids - Year-over-year growth 2025-2030 (%)

10.6 Unisex - Market size and forecast 2025-2030

Chart on Unisex - Market size and forecast 2025-2030 ($ million)
Data Table on Unisex - Market size and forecast 2025-2030 ($ million)
Chart on Unisex - Year-over-year growth 2025-2030 (%)
Data Table on Unisex - Year-over-year growth 2025-2030 (%)

10.7 Market opportunity by End-user

Market opportunity by End-user ($ million)
Data Table on Market opportunity by End-user ($ million)

11. Customer Landscape

11.1 Customer landscape overview

Analysis of price sensitivity, lifecycle, customer purchase basket, adoption rates, and purchase criteria

12. Geographic Landscape

12.1 Geographic segmentation

Chart on Market share by geography 2025-2030 (%)
Data Table on Market share by geography 2025-2030 (%)

12.2 Geographic comparison

Chart on Geographic comparison
Data Table on Geographic comparison

12.3 North America - Market size and forecast 2025-2030

Chart on North America - Market size and forecast 2025-2030 ($ million)
Data Table on North America - Market size and forecast 2025-2030 ($ million)
Chart on North America - Year-over-year growth 2025-2030 (%)
Data Table on North America - Year-over-year growth 2025-2030 (%)
Chart on Regional Comparison - North America
Data Table on Regional Comparison - North America

12.3.1 US - Market size and forecast 2025-2030

Chart on US - Market size and forecast 2025-2030 ($ million)
Data Table on US - Market size and forecast 2025-2030 ($ million)
Chart on US - Year-over-year growth 2025-2030 (%)
Data Table on US - Year-over-year growth 2025-2030 (%)

12.3.2 Canada - Market size and forecast 2025-2030

Chart on Canada - Market size and forecast 2025-2030 ($ million)
Data Table on Canada - Market size and forecast 2025-2030 ($ million)
Chart on Canada - Year-over-year growth 2025-2030 (%)
Data Table on Canada - Year-over-year growth 2025-2030 (%)

12.3.3 Mexico - Market size and forecast 2025-2030

Chart on Mexico - Market size and forecast 2025-2030 ($ million)
Data Table on Mexico - Market size and forecast 2025-2030 ($ million)
Chart on Mexico - Year-over-year growth 2025-2030 (%)
Data Table on Mexico - Year-over-year growth 2025-2030 (%)

12.4 Europe - Market size and forecast 2025-2030

Chart on Europe - Market size and forecast 2025-2030 ($ million)
Data Table on Europe - Market size and forecast 2025-2030 ($ million)
Chart on Europe - Year-over-year growth 2025-2030 (%)
Data Table on Europe - Year-over-year growth 2025-2030 (%)
Chart on Regional Comparison - Europe
Data Table on Regional Comparison - Europe

12.4.1 Germany - Market size and forecast 2025-2030

Chart on Germany - Market size and forecast 2025-2030 ($ million)
Data Table on Germany - Market size and forecast 2025-2030 ($ million)
Chart on Germany - Year-over-year growth 2025-2030 (%)
Data Table on Germany - Year-over-year growth 2025-2030 (%)

12.4.2 UK - Market size and forecast 2025-2030

Chart on UK - Market size and forecast 2025-2030 ($ million)
Data Table on UK - Market size and forecast 2025-2030 ($ million)
Chart on UK - Year-over-year growth 2025-2030 (%)
Data Table on UK - Year-over-year growth 2025-2030 (%)

12.4.3 France - Market size and forecast 2025-2030

Chart on France - Market size and forecast 2025-2030 ($ million)
Data Table on France - Market size and forecast 2025-2030 ($ million)
Chart on France - Year-over-year growth 2025-2030 (%)
Data Table on France - Year-over-year growth 2025-2030 (%)

12.4.4 Italy - Market size and forecast 2025-2030

Chart on Italy - Market size and forecast 2025-2030 ($ million)
Data Table on Italy - Market size and forecast 2025-2030 ($ million)
Chart on Italy - Year-over-year growth 2025-2030 (%)
Data Table on Italy - Year-over-year growth 2025-2030 (%)

12.4.5 Spain - Market size and forecast 2025-2030

Chart on Spain - Market size and forecast 2025-2030 ($ million)
Data Table on Spain - Market size and forecast 2025-2030 ($ million)
Chart on Spain - Year-over-year growth 2025-2030 (%)
Data Table on Spain - Year-over-year growth 2025-2030 (%)

12.4.6 The Netherlands - Market size and forecast 2025-2030

Chart on The Netherlands - Market size and forecast 2025-2030 ($ million)
Data Table on The Netherlands - Market size and forecast 2025-2030 ($ million)
Chart on The Netherlands - Year-over-year growth 2025-2030 (%)
Data Table on The Netherlands - Year-over-year growth 2025-2030 (%)

12.5 APAC - Market size and forecast 2025-2030

Chart on APAC - Market size and forecast 2025-2030 ($ million)
Data Table on APAC - Market size and forecast 2025-2030 ($ million)
Chart on APAC - Year-over-year growth 2025-2030 (%)
Data Table on APAC - Year-over-year growth 2025-2030 (%)
Chart on Regional Comparison - APAC
Data Table on Regional Comparison - APAC

12.5.1 China - Market size and forecast 2025-2030

Chart on China - Market size and forecast 2025-2030 ($ million)
Data Table on China - Market size and forecast 2025-2030 ($ million)
Chart on China - Year-over-year growth 2025-2030 (%)
Data Table on China - Year-over-year growth 2025-2030 (%)

12.5.2 Japan - Market size and forecast 2025-2030

Chart on Japan - Market size and forecast 2025-2030 ($ million)
Data Table on Japan - Market size and forecast 2025-2030 ($ million)
Chart on Japan - Year-over-year growth 2025-2030 (%)
Data Table on Japan - Year-over-year growth 2025-2030 (%)

12.5.3 India - Market size and forecast 2025-2030

Chart on India - Market size and forecast 2025-2030 ($ million)
Data Table on India - Market size and forecast 2025-2030 ($ million)
Chart on India - Year-over-year growth 2025-2030 (%)
Data Table on India - Year-over-year growth 2025-2030 (%)

12.5.4 South Korea - Market size and forecast 2025-2030

Chart on South Korea - Market size and forecast 2025-2030 ($ million)
Data Table on South Korea - Market size and forecast 2025-2030 ($ million)
Chart on South Korea - Year-over-year growth 2025-2030 (%)
Data Table on South Korea - Year-over-year growth 2025-2030 (%)

12.5.5 Australia - Market size and forecast 2025-2030

Chart on Australia - Market size and forecast 2025-2030 ($ million)
Data Table on Australia - Market size and forecast 2025-2030 ($ million)
Chart on Australia - Year-over-year growth 2025-2030 (%)
Data Table on Australia - Year-over-year growth 2025-2030 (%)

12.5.6 Indonesia - Market size and forecast 2025-2030

Chart on Indonesia - Market size and forecast 2025-2030 ($ million)
Data Table on Indonesia - Market size and forecast 2025-2030 ($ million)
Chart on Indonesia - Year-over-year growth 2025-2030 (%)
Data Table on Indonesia - Year-over-year growth 2025-2030 (%)

12.6 South America - Market size and forecast 2025-2030

Chart on South America - Market size and forecast 2025-2030 ($ million)
Data Table on South America - Market size and forecast 2025-2030 ($ million)
Chart on South America - Year-over-year growth 2025-2030 (%)
Data Table on South America - Year-over-year growth 2025-2030 (%)
Chart on Regional Comparison - South America
Data Table on Regional Comparison - South America

12.6.1 Brazil - Market size and forecast 2025-2030

Chart on Brazil - Market size and forecast 2025-2030 ($ million)
Data Table on Brazil - Market size and forecast 2025-2030 ($ million)
Chart on Brazil - Year-over-year growth 2025-2030 (%)
Data Table on Brazil - Year-over-year growth 2025-2030 (%)

12.6.2 Argentina - Market size and forecast 2025-2030

Chart on Argentina - Market size and forecast 2025-2030 ($ million)
Data Table on Argentina - Market size and forecast 2025-2030 ($ million)
Chart on Argentina - Year-over-year growth 2025-2030 (%)
Data Table on Argentina - Year-over-year growth 2025-2030 (%)

12.6.3 Chile - Market size and forecast 2025-2030

Chart on Chile - Market size and forecast 2025-2030 ($ million)
Data Table on Chile - Market size and forecast 2025-2030 ($ million)
Chart on Chile - Year-over-year growth 2025-2030 (%)
Data Table on Chile - Year-over-year growth 2025-2030 (%)

12.7 Middle East and Africa - Market size and forecast 2025-2030

Chart on Middle East and Africa - Market size and forecast 2025-2030 ($ million)
Data Table on Middle East and Africa - Market size and forecast 2025-2030 ($ million)
Chart on Middle East and Africa - Year-over-year growth 2025-2030 (%)
Data Table on Middle East and Africa - Year-over-year growth 2025-2030 (%)
Chart on Regional Comparison - Middle East and Africa
Data Table on Regional Comparison - Middle East and Africa

12.7.1 Saudi Arabia - Market size and forecast 2025-2030

Chart on Saudi Arabia - Market size and forecast 2025-2030 ($ million)
Data Table on Saudi Arabia - Market size and forecast 2025-2030 ($ million)
Chart on Saudi Arabia - Year-over-year growth 2025-2030 (%)
Data Table on Saudi Arabia - Year-over-year growth 2025-2030 (%)

12.7.2 UAE - Market size and forecast 2025-2030

Chart on UAE - Market size and forecast 2025-2030 ($ million)
Data Table on UAE - Market size and forecast 2025-2030 ($ million)
Chart on UAE - Year-over-year growth 2025-2030 (%)
Data Table on UAE - Year-over-year growth 2025-2030 (%)

12.7.3 South Africa - Market size and forecast 2025-2030

Chart on South Africa - Market size and forecast 2025-2030 ($ million)
Data Table on South Africa - Market size and forecast 2025-2030 ($ million)
Chart on South Africa - Year-over-year growth 2025-2030 (%)
Data Table on South Africa - Year-over-year growth 2025-2030 (%)

12.7.4 Turkey - Market size and forecast 2025-2030

Chart on Turkey - Market size and forecast 2025-2030 ($ million)
Data Table on Turkey - Market size and forecast 2025-2030 ($ million)
Chart on Turkey - Year-over-year growth 2025-2030 (%)
Data Table on Turkey - Year-over-year growth 2025-2030 (%)

12.7.5 Israel - Market size and forecast 2025-2030

Chart on Israel - Market size and forecast 2025-2030 ($ million)
Data Table on Israel - Market size and forecast 2025-2030 ($ million)
Chart on Israel - Year-over-year growth 2025-2030 (%)
Data Table on Israel - Year-over-year growth 2025-2030 (%)

12.8 Market opportunity by geography

Market opportunity by geography ($ million)
Data Tables on Market opportunity by geography ($ million)

13. Drivers, Challenges, and Opportunity

13.1 Market drivers

Institutionalization of heat hacking and climate adaptation technologies
Increase of rugged luxury and multipurpose silhouettes
Escalation of circular design and traceable sustainable materials

13.2 Market challenges

Navigation of volatile supply chains for specialized technical textiles
Saturation of consumer attention and evolving monetization fatigue
Escalating regulatory rigor and environmental compliance standards

13.3 Impact of drivers and challenges

Impact of drivers and challenges in 2025 and 2030

13.4 Market opportunities

Industrialization of circular textile ecosystems
Advancements in high-performance thermoregulating smart textiles
Rise of urbanized technical versatility

14. Competitive Landscape

14.1 Overview

14.2

Overview on criticality of inputs and factors of differentiation

14.3 Landscape disruption

Overview on factors of disruption

14.4 Industry risks

Impact of key risks on business

15. Competitive Analysis

15.1 Companies profiled

Companies covered

15.2 Company ranking index

15.3 Market positioning of companies

Matrix on companies position and classification

15.4 Arcteryx Sports Corp.

Arcteryx Sports Corp. - Overview
Arcteryx Sports Corp. - Product / Service
Arcteryx Sports Corp. - Key offerings
SWOT

15.5 Black Diamond Equipment Ltd.

Black Diamond Equipment Ltd. - Overview
Black Diamond Equipment Ltd. - Product / Service
Black Diamond Equipment Ltd. - Key offerings
SWOT

15.6 Columbia Sportswear Co.

Columbia Sportswear Co. - Overview
Columbia Sportswear Co. - Business segments
Columbia Sportswear Co. - Key offerings
Columbia Sportswear Co. - Segment focus
SWOT

15.7 Fjallraven Retail USA LLC

Fjallraven Retail USA LLC - Overview
Fjallraven Retail USA LLC - Product / Service
Fjallraven Retail USA LLC - Key offerings
SWOT

15.8 Helly Hansen AS

Helly Hansen AS - Overview
Helly Hansen AS - Product / Service
Helly Hansen AS - Key offerings
SWOT

15.9 Jack Wolfskin

Jack Wolfskin - Overview
Jack Wolfskin - Product / Service
Jack Wolfskin - Key offerings
SWOT

15.10 KUHL Inc.

KUHL Inc. - Overview
KUHL Inc. - Product / Service
KUHL Inc. - Key offerings
SWOT

15.11 L.L. Bean Inc.

L.L. Bean Inc. - Overview
L.L. Bean Inc. - Product / Service
L.L. Bean Inc. - Key offerings
SWOT

15.12 Mammut Sports Group AG

Mammut Sports Group AG - Overview
Mammut Sports Group AG - Product / Service
Mammut Sports Group AG - Key offerings
SWOT

15.13 Marmot Mountain LLC.

Marmot Mountain LLC. - Overview
Marmot Mountain LLC. - Product / Service
Marmot Mountain LLC. - Key offerings
SWOT

15.14 Montbell America Inc.

Montbell America Inc. - Overview
Montbell America Inc. - Product / Service
Montbell America Inc. - Key offerings
SWOT

15.15 Mountain Hardwear Inc.

Mountain Hardwear Inc. - Overview
Mountain Hardwear Inc. - Product / Service
Mountain Hardwear Inc. - Key offerings
SWOT

15.16 Norrona Sport AS

Norrona Sport AS - Overview
Norrona Sport AS - Product / Service
Norrona Sport AS - Key offerings
SWOT

15.17 Outdoor Research

Outdoor Research - Overview
Outdoor Research - Product / Service
Outdoor Research - Key offerings
SWOT

15.18 Patagonia Inc.

Patagonia Inc. - Overview
Patagonia Inc. - Product / Service
Patagonia Inc. - Key offerings
SWOT

16. Appendix

16.1 Scope of the report

Market definition
Objectives
Notes and caveats

16.2 Inclusions and exclusions checklist

Inclusions checklist
Exclusions checklist

16.3 Currency conversion rates for US$

16.4 Research methodology

16.5 Data procurement

Information sources

16.6 Data validation

16.7 Validation techniques employed for market sizing

16.8 Data synthesis

16.9 360 degree market analysis

16.10 List of abbreviations

Research Methodology

Technavio presents a detailed picture of the market by way of study, synthesis, and summation of data from multiple sources. The analysts have presented the various facets of the market with a particular focus on identifying the key industry influencers. The data thus presented is comprehensive, reliable, and the result of extensive research, both primary and secondary.

INFORMATION SOURCES

Primary sources

  • Manufacturers and suppliers
  • Channel partners
  • Industry experts
  • Strategic decision makers

Secondary sources

  • Industry journals and periodicals
  • Government data
  • Financial reports of key industry players
  • Historical data
  • Press releases

DATA ANALYSIS

Data Synthesis

  • Collation of data
  • Estimation of key figures
  • Analysis of derived insights

Data Validation

  • Triangulation with data models
  • Reference against proprietary databases
  • Corroboration with industry experts

REPORT WRITING

Qualitative

  • Market drivers
  • Market challenges
  • Market trends
  • Five forces analysis

Quantitative

  • Market size and forecast
  • Market segmentation
  • Geographical insights
  • Competitive landscape

Interested in this report?

Get your sample now to see our research methodology and insights!

Download Now

Frequently Asked Questions

Outdoor Apparel market growth will increase by USD 8196.1 million during 2026-2030.

The Outdoor Apparel market is expected to grow at a CAGR of 6.8% during 2026-2030.

Outdoor Apparel market is segmented by Distribution channel (Offline, Online) Product type (Top wear, Bottom wear, Coveralls, Others) End-user (Men, Women, Kids, Unisex)

Arcteryx Sports Corp., Black Diamond Equipment Ltd., Columbia Sportswear Co., Cotopaxi Inc., DIRECT ALPINE s.r.o., Fjallraven Retail USA LLC, Helly Hansen AS, Jack Wolfskin, KUHL Inc., L.L. Bean Inc., Mammut Sports Group AG, Marmot Mountain LLC., Montbell America Inc., Mountain Hardwear Inc., Norrona Sport AS, Outdoor Research, Patagonia Inc., Prana Living LLC, Salomon Group, Smartwool LLC are a few of the key vendors in the Outdoor Apparel market.

Europe will register the highest growth rate of 32.1% among the other regions. Therefore, the Outdoor Apparel market in Europe is expected to garner significant business opportunities for the vendors during the forecast period.

US, Canada, Mexico, Germany, UK, France, Italy, Spain, The Netherlands, China, Japan, India, South Korea, Australia, Indonesia, Brazil, Argentina, Chile, Saudi Arabia, UAE, South Africa, Turkey, Israel

  • Institutionalization of heat hacking and climate adaptation technologies is the driving factor this market.

The Outdoor Apparel market vendors should focus on grabbing business opportunities from the Distribution channel segment as it accounted for the largest market share in the base year.
RIA - Research AI Assistant
Ask RIA