
Beacon Market Size 2026-2030
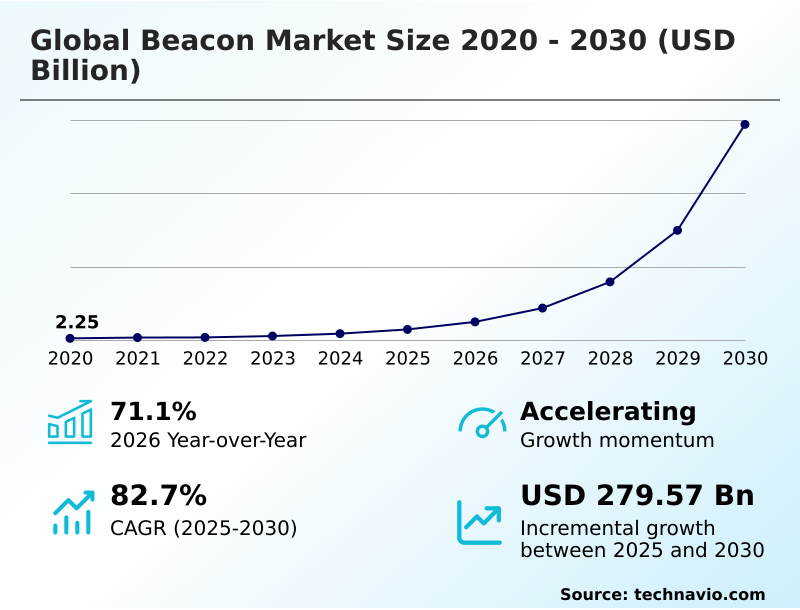
The beacon market size is valued to increase by USD 279.57 billion, at a CAGR of 82.7% from 2025 to 2030. Proliferation of proximity marketing and enhanced customer engagement will drive the beacon market.
Major Market Trends & Insights
- North America dominated the market and accounted for a 38% growth during the forecast period.
- By Type - iBeacon segment was valued at USD 6.44 billion in 2024
- By End-user - Retail segment accounted for the largest market revenue share in 2024
Market Size & Forecast
- Market Opportunities: USD 291.75 billion
- Market Future Opportunities: USD 279.57 billion
- CAGR from 2025 to 2030 : 82.7%
Market Summary
- The beacon market is defined by the expanding use of small wireless transmitters for proximity-based interactions. Growth is driven by the demand for precise location data to enhance operational efficiency and deliver personalized user experiences across diverse industries.
- The technology is fundamental to proximity marketing in retail, enabling businesses to engage customers with targeted offers and in-store navigation, bridging the physical and digital shopping journey. For instance, in a large distribution center, beacons facilitate real-time asset tracking, optimizing inventory management and reducing workflow bottlenecks. This capability provides granular visibility unattainable with other systems.
- Key trends include the integration of artificial intelligence to analyze location data for hyper-personalization and the development of advanced hardware with integrated sensors. However, the market also contends with challenges such as consumer data privacy concerns and competition from alternative technologies like Ultra-Wideband (UWB), which offer higher precision for specific industrial applications.
What will be the Size of the Beacon Market during the forecast period?
Get Key Insights on Market Forecast (PDF) Get Free Sample
How is the Beacon Market Segmented?
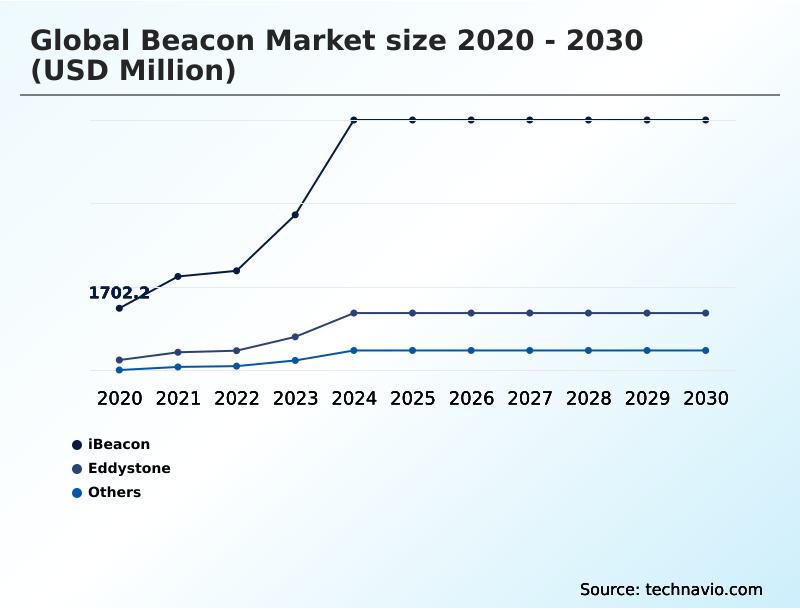
The beacon industry research report provides comprehensive data (region-wise segment analysis), with forecasts and estimates in "USD million" for the period 2026-2030, as well as historical data from 2020-2024 for the following segments.
- Type
- iBeacon
- Eddystone
- Others
- End-user
- Retail
- Healthcare
- BFSI
- Others
- Component
- Hardware
- Software development kit
- Geography
- North America
- US
- Canada
- Mexico
- APAC
- China
- India
- Japan
- Europe
- Germany
- UK
- France
- South America
- Brazil
- Argentina
- Middle East and Africa
- UAE
- Saudi Arabia
- South Africa
- Rest of World (ROW)
- North America
By Type Insights
The ibeacon segment is estimated to witness significant growth during the forecast period.
The market is segmented by protocol, with the iBeacon protocol being a significant segment due to its deep integration within the iOS ecosystem.
This provides a strong incentive for businesses to adopt the technology for hyper-personalization, indoor navigation, and delivering micro-location services. The use of Bluetooth Low Energy ensures power efficiency for large-scale deployments.
The evolution of the market is driven by sophisticated analytics derived from foot traffic analysis, allowing businesses to refine their omnichannel retail strategy.
The availability of advanced software development kits (SDKs) allows for the creation of nuanced user experiences that go beyond simple notifications.
Implementations have demonstrated significant business impact, with some firms achieving a 20% improvement in cost calculation accuracy through precise tracking. The open-source Eddystone protocol offers a cross-platform alternative, broadening applicability in areas like connected vehicle technology.
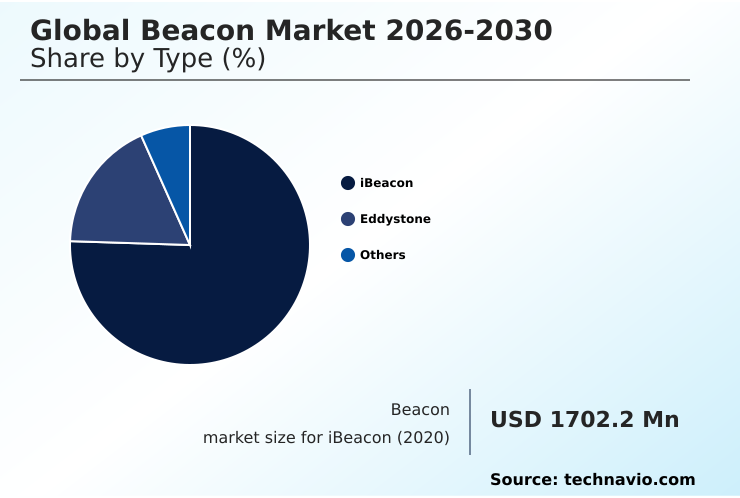
The iBeacon segment was valued at USD 6.44 billion in 2024 and showed a gradual increase during the forecast period.
Regional Analysis
North America is estimated to contribute 38% to the growth of the global market during the forecast period.Technavio’s analysts have elaborately explained the regional trends and drivers that shape the market during the forecast period.
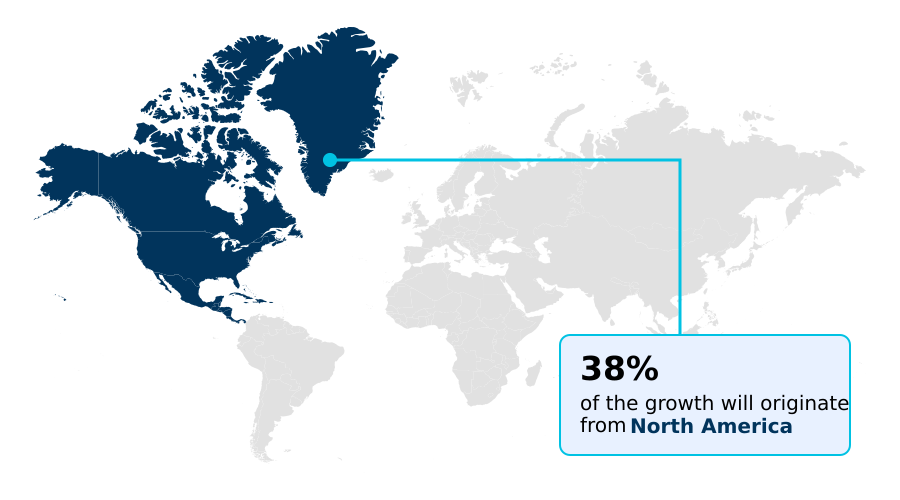
See How Beacon Market Demand is Rising in North America Get Free Sample
The geographic landscape is dominated by North America, which accounts for a significant share of deployments, with APAC emerging as the fastest-growing region.
In North America, adoption is mature in retail and healthcare, focusing on applications like indoor navigation and asset tracking. European markets, particularly Germany, emphasize industrial IoT applications, deploying ruggedized and ATEX-certified beacons in manufacturing environments to improve safety and efficiency.
In APAC, rapid urbanization and smart city projects drive demand. Across regions, the use of beacons with integrated environmental sensors is growing, providing data for complex use cases like digital twin synchronization.
The choice between protocols like the iBeacon protocol often depends on the regional user device ecosystem, impacting customer journey mapping and the delivery of real-time notifications. Effective remote device management remains a key factor for success in all geographies.
Market Dynamics
Our researchers analyzed the data with 2025 as the base year, along with the key drivers, trends, and challenges. A holistic analysis of drivers will help companies refine their marketing strategies to gain a competitive advantage.
- The Global Beacon Market 2026-2030 is expanding as enterprises seek tailored solutions. Use cases for the Global Beacon Market 2026-2030 for retail proximity marketing are evolving, with a focus on marketing hyper-personalization. Concurrently, the Global Beacon Market 2026-2030 for industrial asset tracking is gaining traction, leveraging robust hardware and software development kits.
- A critical comparison is the Global Beacon Market 2026-2030 vs UWB for precision tracking, with UWB offering higher accuracy for specific needs. The Global Beacon Market 2026-2030 integration with AI and ML platforms is enabling predictive analytics, while the Global Beacon Market 2026-2030 security and privacy challenges remain a key consideration for developers.
- In vertical markets, the Global Beacon Market 2026-2030 for healthcare patient flow management optimizes hospital operations, achieving efficiency gains of over 15% compared to manual processes. Similarly, the Global Beacon Market 2026-2030 for smart city indoor navigation is improving urban mobility.
- The Global Beacon Market 2026-2030 Eddystone vs iBeacon protocols continues to be a central debate, influencing everything from the Global Beacon Market 2026-2030 in transportation and public transit to the Global Beacon Market 2026-2030 for hospitality guest experience.
- Innovations like the Global Beacon Market 2026-2030 with environmental sensor integration enhance capabilities for the Global Beacon Market 2026-2030 for enterprise-grade access control. The Global Beacon Market 2026-2030 power consumption and battery life are critical for large-scale projects, including the Global Beacon Market 2026-2030 in education for campus navigation.
- Finally, features like Global Beacon Market 2026-2030 firmware over-the-air updates, Global Beacon Market 2026-2030 API integration for enterprise systems, and improving Global Beacon Market 2026-2030 real-time location system accuracy are shaping the future.
What are the key market drivers leading to the rise in the adoption of Beacon Industry?
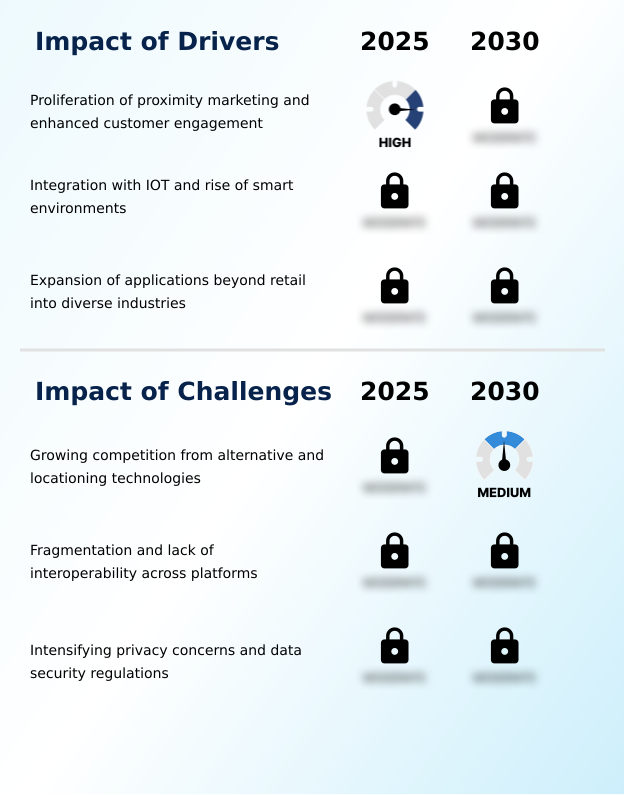
- The proliferation of proximity marketing strategies across various sectors is a key driver, significantly enhancing contextual customer engagement and fostering brand loyalty.
- The adoption of proximity marketing is a primary driver, enabling businesses to create compelling, context-aware user experiences and execute an effective omnichannel retail strategy. This capability significantly improves operational efficiency, with some retailers reporting a 20% increase in customer engagement.
- Beyond retail, the integration of real-time location systems into broader IoT ecosystems is fueling growth. These systems, managed through cloud-based management platforms with robust API integration, are essential for smart environment integration in buildings and cities.
- They enhance supply chain visibility and enable new functionalities like app-less user interaction, which lowers adoption barriers. This expansion into diverse industrial applications highlights the technology's versatility in providing granular location data to automate processes and inform strategic decisions.
What are the market trends shaping the Beacon Industry?
- The integration of artificial intelligence and machine learning is a pivotal trend. It enables hyper-personalized, contextually aware user experiences.
- The evolution of beacon technology is marked by significant hardware and protocol advancements that enhance its utility for sophisticated location-based services. A key trend is the move toward secure beacon devices capable of bidirectional communication, which facilitates remote management and firmware over-the-air updates, a critical feature for large-scale enterprise-grade deployments.
- Innovations in hardware include the adoption of energy harvesting technology, reducing maintenance overhead and enabling perpetual operation. Precision is also improving, with methods like Angle of Arrival (AoA) providing sub-meter accuracy, which is essential for industrial use cases.
- This supports more advanced device-to-device communication within low-power wide-area networks, driving richer contextual engagement and creating more robust, scalable systems that improve efficiency by up to 15%.
What challenges does the Beacon Industry face during its growth?
- The market faces a significant challenge from the growing competition of alternative and more precise locationing technologies, including UWB and 5G-based positioning.
- The market confronts significant challenges from alternative technologies offering superior precision. Ultra-Wideband (UWB), Wi-Fi RTT, and 5G-based positioning are gaining traction, with UWB providing up to 10 times greater accuracy for applications requiring fine-grained geospatial intelligence. This competition requires innovation beyond standard geofencing capabilities.
- Furthermore, escalating privacy concerns and stringent data regulations necessitate adherence to strong data encryption standards and privacy-by-design principles. The effective use of location data analytics is constrained by consumer reluctance to grant permissions, which can impact over 30% of potential users.
- Addressing these issues through transparent policies and advancements in secure, on-device network edge processing is crucial for sustaining growth, especially in sectors like smart building automation.
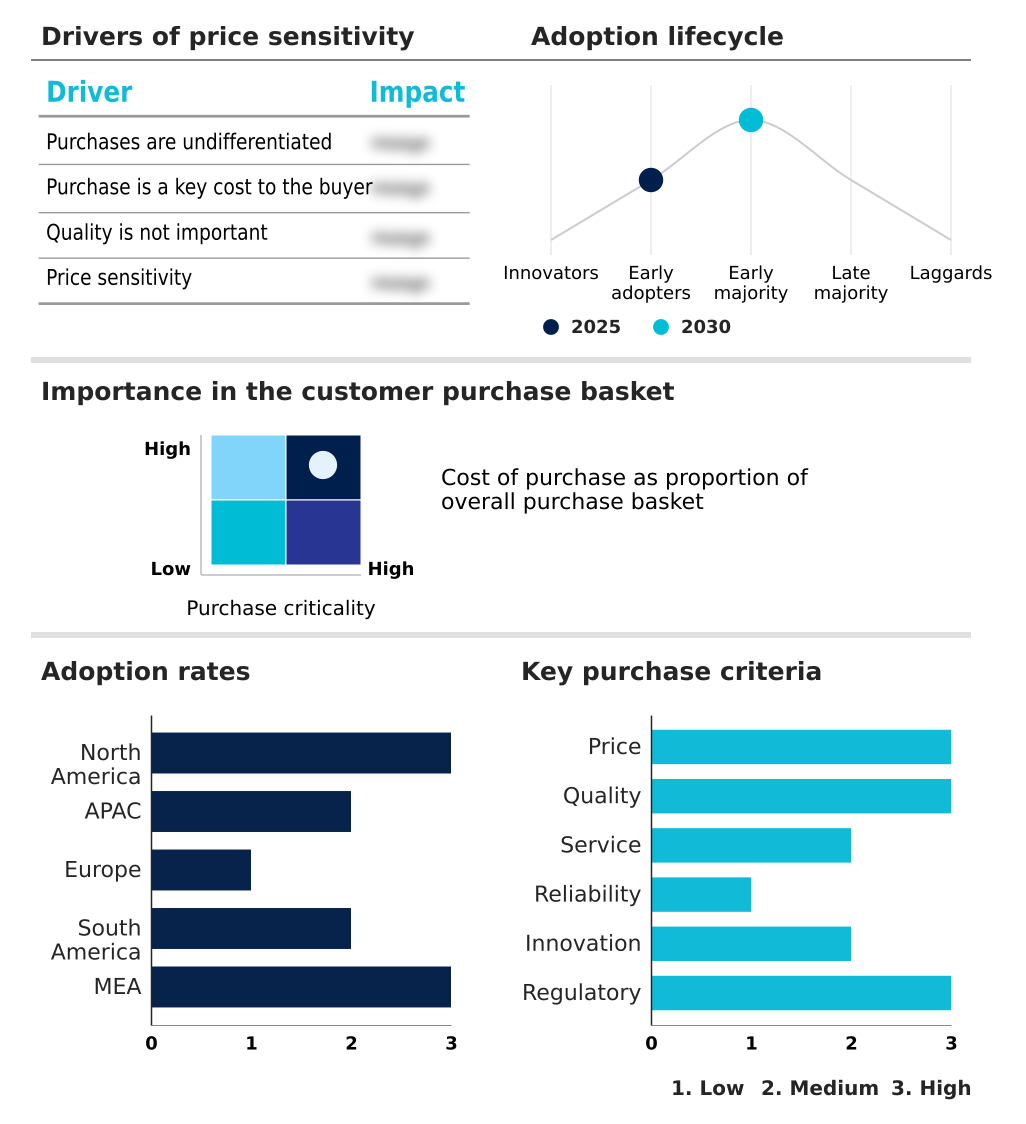
Exclusive Technavio Analysis on Customer Landscape
The beacon market forecasting report includes the adoption lifecycle of the market, covering from the innovator’s stage to the laggard’s stage. It focuses on adoption rates in different regions based on penetration. Furthermore, the beacon market report also includes key purchase criteria and drivers of price sensitivity to help companies evaluate and develop their market growth analysis strategies.
Customer Landscape of Beacon Industry
Competitive Landscape
Companies are implementing various strategies, such as strategic alliances, beacon market forecast, partnerships, mergers and acquisitions, geographical expansion, and product/service launches, to enhance their presence in the industry.
Accent Advanced Syst SLU - Delivering precise indoor positioning and asset tracking through advanced Bluetooth Low Energy (BLE) devices for enhanced enterprise visibility and operational control.
The industry research and growth report includes detailed analyses of the competitive landscape of the market and information about key companies, including:
- Accent Advanced Syst SLU
- Apple Inc.
- BlueUp Srls
- ELA Innovation SA
- Estimote Inc.
- G24 Power Ltd.
- Hewlett Packard Entp Co.
- HID Global Corp.
- Infillion
- MOKOSmart
- Nordic Semiconductor ASA
- OSRAM GmbH
- Qualcomm Inc.
- Sensoro Co. Ltd.
- Silicon Laboratories Inc.
- Texas Instruments Inc.
- Zebra Technologies Corp.
Qualitative and quantitative analysis of companies has been conducted to help clients understand the wider business environment as well as the strengths and weaknesses of key industry players. Data is qualitatively analyzed to categorize companies as pure play, category-focused, industry-focused, and diversified; it is quantitatively analyzed to categorize companies as dominant, leading, strong, tentative, and weak.
Recent Development and News in Beacon market
- In March 2025, the California Attorney General initiated an investigative sweep into the location data industry, signaling heightened enforcement and scrutiny of companies that handle such information.
- In March 2025, Kontakt.io introduced an advanced BLE platform aimed at improving the precision of real-time asset tracking within medical facilities, enhancing operational efficiency.
- In April 2025, the Unity Health Alliance completed its implementation of a comprehensive real-time location system integrating beacon technology to track equipment and automate hospital workflows.
- In February 2025, Intercontinental Financial Group launched a premium banking service that uses beacon technology to automatically check-in high-net-worth clients and alert relationship managers.
Dive into Technavio’s robust research methodology, blending expert interviews, extensive data synthesis, and validated models for unparalleled Beacon Market insights. See full methodology.
| Market Scope | |
|---|---|
| Page number | 292 |
| Base year | 2025 |
| Historic period | 2020-2024 |
| Forecast period | 2026-2030 |
| Growth momentum & CAGR | Accelerate at a CAGR of 82.7% |
| Market growth 2026-2030 | USD 279570.1 million |
| Market structure | Fragmented |
| YoY growth 2025-2026(%) | 71.1% |
| Key countries | US, Canada, Mexico, China, India, Japan, South Korea, Australia, Indonesia, Germany, UK, France, Italy, Spain, The Netherlands, Brazil, Argentina, Chile, UAE, Saudi Arabia, South Africa, Qatar and Egypt |
| Competitive landscape | Leading Companies, Market Positioning of Companies, Competitive Strategies, and Industry Risks |
Research Analyst Overview
- The beacon market's evolution is driven by the convergence of hardware innovation and intelligent software. The widespread adoption of Bluetooth Low Energy enables diverse location-based services, from proximity marketing to industrial asset tracking. Key to this expansion are secure beacon devices capable of bidirectional communication, which, alongside robust software development kits (SDKs), facilitate hyper-personalization and context-aware user experiences.
- Protocols such as the Eddystone protocol and iBeacon protocol define the communication framework, while advanced technologies like Ultra-Wideband (UWB), Wi-Fi RTT, and 5G-based positioning present competitive alternatives for high-precision needs. The integration of environmental sensors and Angle of Arrival (AoA) technology enhances indoor navigation and real-time location systems.
- For boardroom consideration, navigating data encryption standards is critical to mitigating privacy risks, a factor that directly impacts product strategy. Deployments leveraging energy harvesting technology and ATEX-certified beacons demonstrate the market's adaptation to specialized industrial requirements, with some achieving a 15% reduction in production delays. Management is streamlined through cloud-based management platforms with API integration, supporting geofencing capabilities.
What are the Key Data Covered in this Beacon Market Research and Growth Report?
-
What is the expected growth of the Beacon Market between 2026 and 2030?
-
USD 279.57 billion, at a CAGR of 82.7%
-
-
What segmentation does the market report cover?
-
The report is segmented by Type (iBeacon, Eddystone, and Others), End-user (Retail, Healthcare, BFSI, and Others), Component (Hardware, and Software development kit) and Geography (North America, APAC, Europe, South America, Middle East and Africa)
-
-
Which regions are analyzed in the report?
-
North America, APAC, Europe, South America and Middle East and Africa
-
-
What are the key growth drivers and market challenges?
-
Proliferation of proximity marketing and enhanced customer engagement, Growing competition from alternative and locationing technologies
-
-
Who are the major players in the Beacon Market?
-
Accent Advanced Syst SLU, Apple Inc., BlueUp Srls, ELA Innovation SA, Estimote Inc., G24 Power Ltd., Hewlett Packard Entp Co., HID Global Corp., Infillion, MOKOSmart, Nordic Semiconductor ASA, OSRAM GmbH, Qualcomm Inc., Sensoro Co. Ltd., Silicon Laboratories Inc., Texas Instruments Inc. and Zebra Technologies Corp.
-
Market Research Insights
- The market is characterized by dynamic shifts toward enterprise-grade deployments and smart environment integration, underpinned by sophisticated location data analytics. The emphasis on operational efficiency is driving adoption, with implementations demonstrating up to a 15% reduction in process delays through enhanced supply chain visibility and customer journey mapping.
- The convergence of technologies is enabling richer contextual engagement and micro-location services, forming a key part of an effective omnichannel retail strategy. Advancements such as app-less user interaction and device-to-device communication, supported by network edge processing, are lowering adoption barriers. The ability to perform remote device management and firmware over-the-air updates is critical for scalability.
- These dynamics, combined with a focus on privacy-by-design principles, are shaping the evolution of connected vehicle technology and smart building automation.
We can help! Our analysts can customize this beacon market research report to meet your requirements.
 RIA -
RIA - 
