Culinary Tourism Market Analysis, Size, and Forecast 2026-2030: Europe (Italy, France, and Spain), North America (US, Canada, and Mexico), APAC (China, Japan, and India), South America (Brazil and Argentina), Middle East and Africa (Turkey, UAE, and South Africa), and Rest of World (ROW)

Culinary Tourism Market Analysis, Size, and Forecast 2026-2030:
Europe (Italy, France, and Spain), North America (US, Canada, and Mexico), APAC (China, Japan, and India), South America (Brazil and Argentina), Middle East and Africa (Turkey, UAE, and South Africa), and Rest of World (ROW)

Published: Mar 2026 300 Pages SKU: IRTNTR70511

Market Overview at a Glance

$310.71 B
Market Opportunity
23.3%
CAGR 2025 - 2030
35.1%
Europe Growth
$49.37 B
Food festival segment 2024

Culinary Tourism Market Size 2026-2030

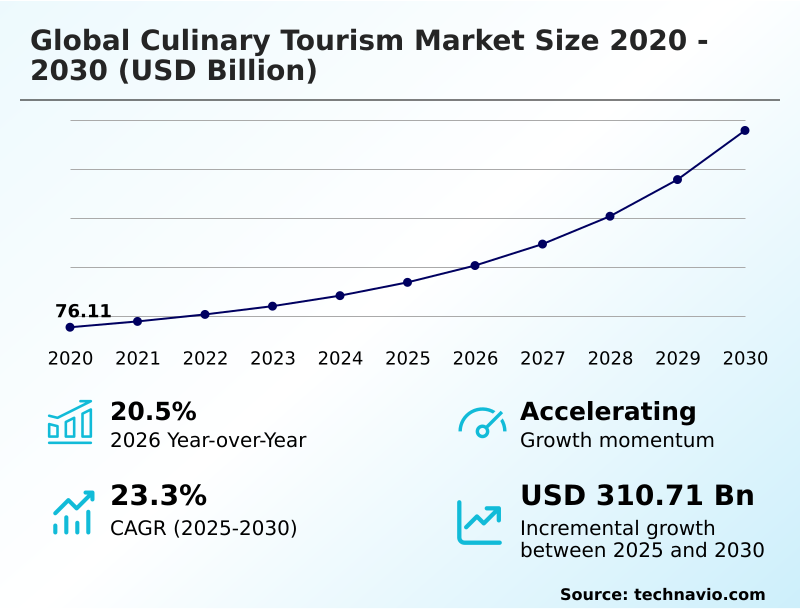
The culinary tourism market size is valued to increase by USD 310.71 billion, at a CAGR of 23.3% from 2025 to 2030. Growing consumer interest in authentic local food experiences will drive the culinary tourism market.

Major Market Trends & Insights

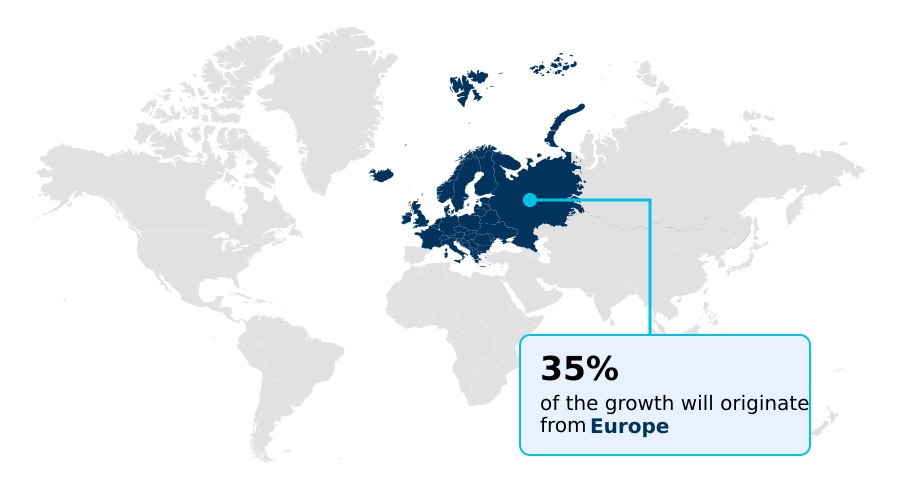
  • Europe dominated the market and accounted for a 35.1% growth during the forecast period.
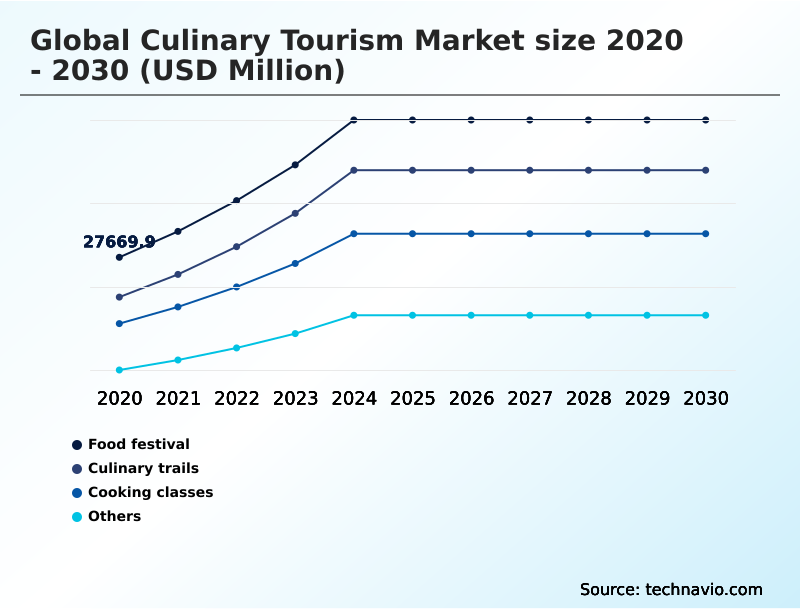
  • By Application - Food festival segment was valued at USD 49.37 billion in 2024
  • By Product - Domestic segment accounted for the largest market revenue share in 2024

Market Size & Forecast

  • Market Opportunities: USD 402.52 billion
  • Market Future Opportunities: USD 310.71 billion
  • CAGR from 2025 to 2030 : 23.3%

Market Summary

  • The culinary tourism market is defined by a shift toward authentic cultural engagement, where food serves as the primary medium for exploration. This evolution is driven by a growing demand for immersive dining and experiential travel, prompting food tour operators to design sophisticated culinary itineraries that go beyond simple tastings.
  • These packages often include culinary workshops, street food tours, and agritourism activities that provide insight into traditional cooking techniques and indigenous ingredients. A key business application involves tour operators leveraging data from online travel agencies and social media to optimize culinary vacation packages.
  • By analyzing foodie travel planning trends, operators can dynamically adjust offerings, such as chef-guided tours and local market tours, to match consumer interest, which has been shown to improve booking conversion rates. However, the industry faces challenges related to food tourism infrastructure in emerging gastronomy destinations and the need for greater food heritage preservation.
  • The continued focus on sustainable food tourism and eco-gastronomy presents significant opportunities for differentiation and growth.

What will be the Size of the Culinary Tourism Market during the forecast period?

Get Key Insights on Market Forecast (PDF) Request Free Sample

How is the Culinary Tourism Market Segmented?

The culinary tourism industry research report provides comprehensive data (region-wise segment analysis), with forecasts and estimates in "USD million" for the period 2026-2030, as well as historical data from 2020-2024 for the following segments.

  • Application
    • Food festival
    • Culinary trails
    • Cooking classes
    • Others
  • Product
    • Domestic
    • International
  • Type
    • Recreational
    • Diversionary
    • Existential
    • Experimental
  • Geography
    • Europe
      • Italy
      • France
      • Spain
    • North America
      • US
      • Canada
      • Mexico
    • APAC
      • China
      • Japan
      • India
    • South America
      • Brazil
      • Argentina
    • Middle East and Africa
      • Turkey
      • UAE
      • South Africa
    • Rest of World (ROW)

By Application Insights

The food festival segment is estimated to witness significant growth during the forecast period.

The food festival segment represents a highly engaging facet of the market, serving as a primary draw for food-motivated travelers.

These organized gastronomic events are pivotal for gastronomy marketing, allowing destinations to showcase a concentrated variety of regional specialties and authentic cuisine.

Such gatherings, a key part of food festival travel, foster community engagement and provide a platform for travelers to immerse themselves in local culture through diverse food and beverage experiences.

Effective culinary event planning turns these festivals into recurring highlights, with local food guides steering visitors toward unique offerings.

This segment, accounting for over a third of application-based revenue, complements other travel forms like culinary trails and solidifies a region's reputation as one of the top foodie travel destinations for regional cuisine exploration.

Request Free Sample

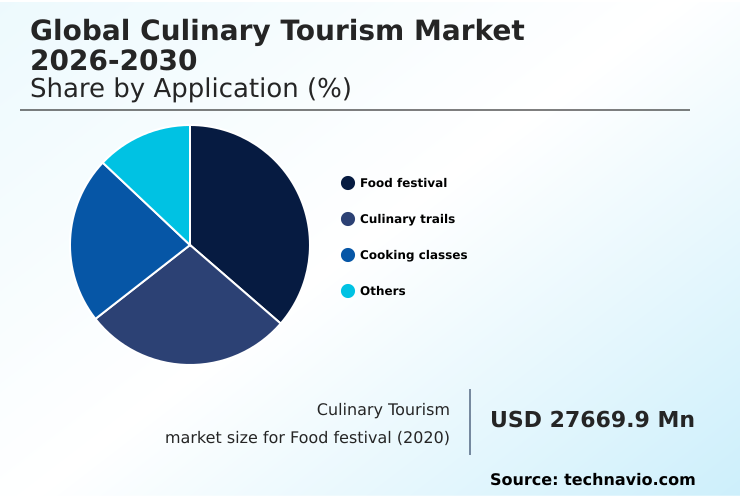
The Food festival segment was valued at USD 49.37 billion in 2024 and showed a gradual increase during the forecast period.

Request Free Sample

Regional Analysis

Europe is estimated to contribute 35.1% to the growth of the global market during the forecast period.Technavio’s analysts have elaborately explained the regional trends and drivers that shape the market during the forecast period.

See How Culinary Tourism Market Demand is Rising in Europe Request Free Sample

Europe is poised to contribute over 35% of the market's incremental growth, with its established food and wine tours and wine tasting tours in countries like Italy and France.

However, the APAC region is forecast to expand at a faster rate, with a projected CAGR of 24.7%, driven by vibrant street food tours and a focus on local culinary traditions.

Culinary tourism development initiatives in both regions are pivotal, with an emphasis on food heritage preservation and agritourism. Destinations are leveraging cultural gastronomy to position themselves as premier gastronomy destination choices.

These efforts, which include gourmet travel tours and food history tours, create diverse culinary experiences centered on unique regional dishes, attracting a global audience of travelers.

Market Dynamics

Our researchers analyzed the data with 2025 as the base year, along with the key drivers, trends, and challenges. A holistic analysis of drivers will help companies refine their marketing strategies to gain a competitive advantage.

  • Strategizing for the culinary tourism market requires a deep understanding of key growth drivers and consumer preferences. The selection of the best destinations for culinary tourism is increasingly influenced by the impact of social media on food travel, which shapes authentic local food experience trends.
  • Boardroom decisions now frequently address how to implement sustainable practices in food tourism and promote heritage cuisine preservation through tourism, as these factors directly affect brand perception. For operators, organizing a successful food festival involves more than logistics; it requires robust marketing strategies for food tourism to maximize the economic impact of food festivals.
  • Similarly, developing culinary trails in rural areas is a key tactic to disperse tourism and support local economies, though it brings culinary tourism infrastructure development challenges. The offerings are becoming more specialized, with a rise of vegan culinary tourism and curated experiences for culinary tourism for luxury travelers.
  • The role of chefs in gastronomic tourism is becoming more prominent, creating both opportunities and challenges in culinary tour guiding. For instance, demand for specialized itineraries like wine tasting tours in Europe and street food tours in Southeast Asia is growing.
  • Businesses are also focusing on demonstrating the farm-to-table dining experience benefits and leveraging technology in culinary tourism bookings to facilitate cultural immersion through cooking classes. Addressing these culinary tourism market growth drivers is essential for sustainable success.

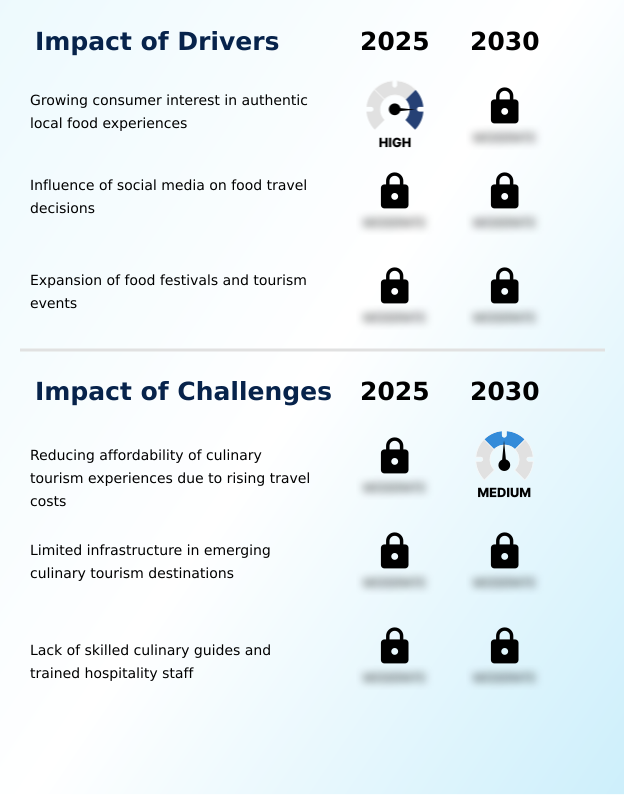
What are the key market drivers leading to the rise in the adoption of Culinary Tourism Industry?

  • The growing consumer interest in authentic local food experiences serves as a key driver for the market's expansion.

  • The demand for authentic local food experiences is a primary market driver, fueling the growth of gastronomic tourism as a form of experiential travel.
  • Social media platforms and food and travel blogs are central to this, with content from influencers leading to visitor inquiry spikes of up to 50% for promoted destinations.
  • This digital exposure shapes food tourism trends and inspires travel for food lovers to embark on gastronomic journeys.
  • Food tour operators are capitalizing on this by creating narratives around culinary storytelling and offering guided food tours that highlight traditional cooking techniques.
  • This approach transforms a simple vacation into culinary adventure travel, satisfying the modern traveler's quest for authenticity and unique cultural engagement.

What are the market trends shaping the Culinary Tourism Industry?

  • The increasing demand for chef-led culinary tourism experiences is a prominent upcoming market trend. This reflects a growing consumer preference for direct interaction with culinary experts and personalized, skill-based travel.

  • A significant trend is the rise of sustainable food tourism, with travelers prioritizing eco-gastronomy and sustainable culinary travel. This shift has amplified demand for farm-to-table dining experiences at dedicated farm-to-table restaurants. Concurrently, the popularity of chef-led experiences and chef-guided tours is surging, as they offer unique, immersive dining opportunities and foster an immersive food culture.
  • These educational formats, which include specialized culinary workshops and heritage cooking classes, command a price premium of up to 25% over standard tours. The focus on heritage cuisine provides travelers with authentic dining experiences that connect them to the history and traditions of a destination, enhancing overall trip satisfaction and engagement.

What challenges does the Culinary Tourism Industry face during its growth?

  • The declining affordability of culinary tourism experiences, driven by rising travel costs, presents a significant challenge to industry growth.

  • A key challenge is the underdeveloped food tourism infrastructure in many emerging destinations, which complicates foodie travel planning and limits the scalability of specialty food travel. This deficit affects culinary tour operators trying to design comprehensive culinary itineraries for culinary vacation packages.
  • While online travel agencies facilitate bookings, rising operational costs have driven a 10-15% price increase for experiences like luxury gastronomy and cultural food tours, making them less accessible.
  • Furthermore, a shortage of skilled guides capable of explaining the significance of indigenous ingredients or leading high-quality cooking classes and local market tours can diminish the value of a cooking vacation, impacting overall market growth and customer satisfaction.

Exclusive Technavio Analysis on Customer Landscape

The culinary tourism market forecasting report includes the adoption lifecycle of the market, covering from the innovator’s stage to the laggard’s stage. It focuses on adoption rates in different regions based on penetration. Furthermore, the culinary tourism market report also includes key purchase criteria and drivers of price sensitivity to help companies evaluate and develop their market growth analysis strategies.

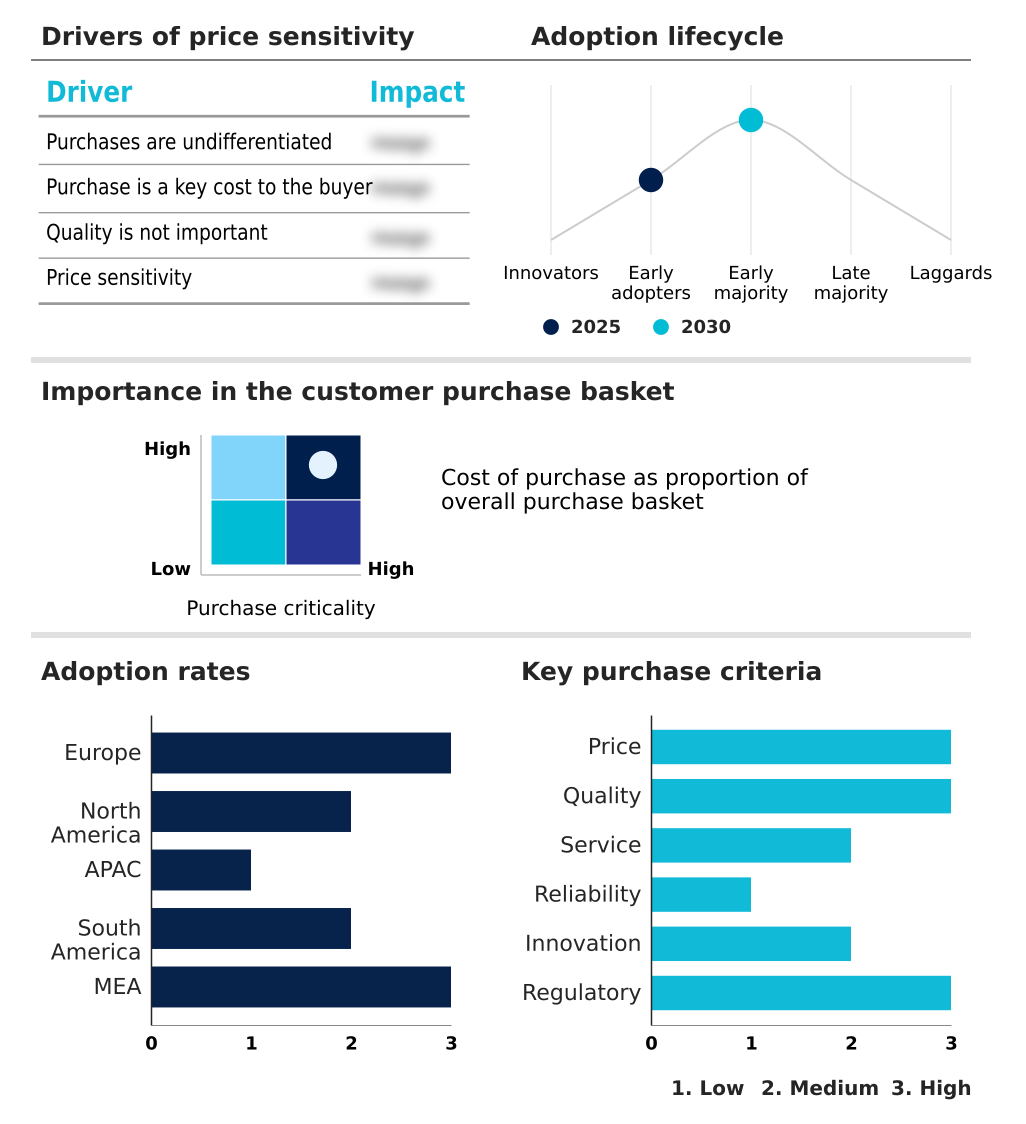
Customer Landscape of Culinary Tourism Industry

Competitive Landscape

Companies are implementing various strategies, such as strategic alliances, culinary tourism market forecast, partnerships, mergers and acquisitions, geographical expansion, and product/service launches, to enhance their presence in the industry.

A and K Travel Group Ltd. - Specializes in luxury travel itineraries featuring curated food experiences, regional cuisine tastings, and immersive dining, showcasing global culture and traditions through gastronomy.

The industry research and growth report includes detailed analyses of the competitive landscape of the market and information about key companies, including:

  • A and K Travel Group Ltd.
  • Airbnb Inc.
  • Butterfield and Robinson Inc.
  • Context Travel LLC
  • Cookly Pte. Ltd.
  • Culinary Backstreets LLC
  • Devour Tours
  • Eating Europe Tours
  • Epicurean Ways LLC
  • Essor Ltd
  • Fork and Walk Tours Berlin
  • G Adventures Inc.
  • Gourmet On Tour Ltd.
  • Intrepid Group Pty Ltd.
  • Intrepid Urban Adventures
  • Taste Buds Travel
  • Trafalgar
  • TripAdvisor Inc.
  • Zicasso Inc.

Qualitative and quantitative analysis of companies has been conducted to help clients understand the wider business environment as well as the strengths and weaknesses of key industry players. Data is qualitatively analyzed to categorize companies as pure play, category-focused, industry-focused, and diversified; it is quantitatively analyzed to categorize companies as dominant, leading, strong, tentative, and weak.

Recent Development and News in Culinary tourism market

  • In August, 2025, Traverse City Tourism launched the annual Food and Wine Festival, featuring over seventy culinary activities, including farm dinners and wine tastings, to position the region as a national culinary destination.
  • In July, 2025, the Madurai City Tourism Board organized a three-day food festival to promote the city's gastronomic heritage, featuring over twenty local food outlets and cultural performances to attract food enthusiasts.
  • In June, 2025, the Government of Meghalaya initiated the Culinary Cascade 2025 festival in Shillong to celebrate regional cuisine and create entrepreneurial opportunities by showcasing the state's unique food traditions.
  • In April, 2025, organizers of the Charleston Food and Wine Classic featured cooking demonstrations and exclusive tasting seminars with renowned chefs, enhancing the event's appeal to food-motivated travelers seeking expert interactions.

Dive into Technavio’s robust research methodology, blending expert interviews, extensive data synthesis, and validated models for unparalleled Culinary Tourism Market insights. See full methodology.

Market Scope
Page number 300
Base year 2025
Historic period 2020-2024
Forecast period 2026-2030
Growth momentum & CAGR Accelerate at a CAGR of 23.3%
Market growth 2026-2030 USD 310705.1 million
Market structure Fragmented
YoY growth 2025-2026(%) 20.5%
Key countries Italy, France, Spain, Germany, UK, The Netherlands, US, Canada, Mexico, China, Japan, India, Thailand, South Korea, Australia, Brazil, Argentina, Peru, Turkey, UAE, Morocco, South Africa and Saudi Arabia
Competitive landscape Leading Companies, Market Positioning of Companies, Competitive Strategies, and Industry Risks

Request Free Sample

Research Analyst Overview

  • The market is undergoing a significant transformation, moving beyond simple food travel to become a core component of experiential travel. This shift is driving demand for a variety of culinary experiences, from luxury gastronomy and immersive dining to authentic cuisine found on street food tours.
  • Successful food tour operators now offer curated culinary itineraries that emphasize culinary storytelling, traditional cooking techniques, and regional specialties. A key boardroom consideration is the investment in sustainable food tourism and food heritage preservation, as these initiatives directly build brand equity and have been shown to increase customer retention by up to 15%.
  • This involves promoting agritourism, eco-gastronomy, and farm-to-table dining. The industry relies on a complex ecosystem including online travel agencies, gastronomic events like food festivals, and educational offerings such as culinary workshops and cooking classes.
  • Growth is contingent on developing adequate food tourism infrastructure and promoting gastronomy destinations that feature unique indigenous ingredients, regional dishes, and compelling food and beverage experiences to attract food-motivated travelers.

What are the Key Data Covered in this Culinary Tourism Market Research and Growth Report?

  • What is the expected growth of the Culinary Tourism Market between 2026 and 2030?

    • USD 310.71 billion, at a CAGR of 23.3%

  • What segmentation does the market report cover?

    • The report is segmented by Application (Food festival, Culinary trails, Cooking classes, and Others), Product (Domestic, and International), Type (Recreational, Diversionary, Existential, and Experimental) and Geography (Europe, North America, APAC, South America, Middle East and Africa)

  • Which regions are analyzed in the report?

    • Europe, North America, APAC, South America and Middle East and Africa

  • What are the key growth drivers and market challenges?

    • Growing consumer interest in authentic local food experiences, Reducing affordability of culinary tourism experiences due to rising travel costs

  • Who are the major players in the Culinary Tourism Market?

    • A and K Travel Group Ltd., Airbnb Inc., Butterfield and Robinson Inc., Context Travel LLC, Cookly Pte. Ltd., Culinary Backstreets LLC, Devour Tours, Eating Europe Tours, Epicurean Ways LLC, Essor Ltd, Fork and Walk Tours Berlin, G Adventures Inc., Gourmet On Tour Ltd., Intrepid Group Pty Ltd., Intrepid Urban Adventures, Taste Buds Travel, Trafalgar, TripAdvisor Inc. and Zicasso Inc.

Market Research Insights

  • The market is characterized by robust and dynamic growth, with an overall year-over-year expansion exceeding 20%. Regionally, Europe is set to contribute over 35% of the market's incremental growth, underscoring its role as a hub for gastronomic journeys and cultural gastronomy.
  • This expansion is fueled by an increasing consumer appetite for culinary adventure travel and authentic dining experiences, often discovered through food and travel blogs. Operators are responding by creating specialized gourmet travel tours and curated culinary vacation packages.
  • These offerings are designed to provide deep regional cuisine exploration and immersive food culture experiences, meeting the sophisticated demands of modern travelers and reflecting positive food tourism trends across both domestic and international segments.

We can help! Our analysts can customize this culinary tourism market research report to meet your requirements.

Get in touch

1. Executive Summary

1.1 Market overview

Executive Summary - Chart on Market Overview
Executive Summary - Data Table on Market Overview
Executive Summary - Chart on Global Market Characteristics
Executive Summary - Chart on Market by Geography
Executive Summary - Chart on Market Segmentation by Application
Executive Summary - Chart on Market Segmentation by Product
Executive Summary - Chart on Market Segmentation by Type
Executive Summary - Chart on Incremental Growth
Executive Summary - Data Table on Incremental Growth
Executive Summary - Chart on Company Market Positioning

2. Technavio Analysis

2.1 Analysis of price sensitivity, lifecycle, customer purchase basket, adoption rates, and purchase criteria

2.2 Criticality of inputs and Factors of differentiation

Chart on Overview on criticality of inputs and factors of differentiation

2.3 Factors of disruption

Chart on Overview on factors of disruption

2.4 Impact of drivers and challenges

Chart on Impact of drivers and challenges in 2025 and 2030

3. Market Landscape

3.1 Market ecosystem

Chart on Parent Market
Data Table on - Parent Market

3.2 Market characteristics

Chart on Market characteristics analysis

3.3 Value chain analysis

Chart on Value chain analysis

4. Market Sizing

4.1 Market definition

Data Table on Offerings of companies included in the market definition

4.2 Market segment analysis

Market segments

4.3 Market size 2025

4.4 Market outlook: Forecast for 2025-2030

Chart on Global - Market size and forecast 2025-2030 ($ million)
Data Table on Global - Market size and forecast 2025-2030 ($ million)
Chart on Global Market: Year-over-year growth 2025-2030 (%)
Data Table on Global Market: Year-over-year growth 2025-2030 (%)

5. Historic Market Size

5.1 Global Culinary Tourism Market 2020 - 2024

Historic Market Size - Data Table on Global Culinary Tourism Market 2020 - 2024 ($ million)

5.2 Application segment analysis 2020 - 2024

Historic Market Size - Application Segment 2020 - 2024 ($ million)

5.3 Product segment analysis 2020 - 2024

Historic Market Size - Product Segment 2020 - 2024 ($ million)

5.4 Type segment analysis 2020 - 2024

Historic Market Size - Type Segment 2020 - 2024 ($ million)

5.5 Geography segment analysis 2020 - 2024

Historic Market Size - Geography Segment 2020 - 2024 ($ million)

5.6 Country segment analysis 2020 - 2024

Historic Market Size - Country Segment 2020 - 2024 ($ million)

6. Qualitative Analysis

6.1 Impact of AI on Global Culinary Tourism Market

6.2 Impact of Geopolitical Conflicts on Global Culinary Tourism Market

7. Five Forces Analysis

7.1 Five forces summary

Five forces analysis - Comparison between 2025 and 2030

7.2 Bargaining power of buyers

Bargaining power of buyers - Impact of key factors 2025 and 2030

7.3 Bargaining power of suppliers

Bargaining power of suppliers - Impact of key factors in 2025 and 2030

7.4 Threat of new entrants

Threat of new entrants - Impact of key factors in 2025 and 2030

7.5 Threat of substitutes

Threat of substitutes - Impact of key factors in 2025 and 2030

7.6 Threat of rivalry

Threat of rivalry - Impact of key factors in 2025 and 2030

7.7 Market condition

Chart on Market condition - Five forces 2025 and 2030

8. Market Segmentation by Application

8.1 Market segments

Chart on Application - Market share 2025-2030 (%)
Data Table on Application - Market share 2025-2030 (%)

8.2 Comparison by Application

Chart on Comparison by Application
Data Table on Comparison by Application

8.3 Food festival - Market size and forecast 2025-2030

Chart on Food festival - Market size and forecast 2025-2030 ($ million)
Data Table on Food festival - Market size and forecast 2025-2030 ($ million)
Chart on Food festival - Year-over-year growth 2025-2030 (%)
Data Table on Food festival - Year-over-year growth 2025-2030 (%)

8.4 Culinary trails - Market size and forecast 2025-2030

Chart on Culinary trails - Market size and forecast 2025-2030 ($ million)
Data Table on Culinary trails - Market size and forecast 2025-2030 ($ million)
Chart on Culinary trails - Year-over-year growth 2025-2030 (%)
Data Table on Culinary trails - Year-over-year growth 2025-2030 (%)

8.5 Cooking classes - Market size and forecast 2025-2030

Chart on Cooking classes - Market size and forecast 2025-2030 ($ million)
Data Table on Cooking classes - Market size and forecast 2025-2030 ($ million)
Chart on Cooking classes - Year-over-year growth 2025-2030 (%)
Data Table on Cooking classes - Year-over-year growth 2025-2030 (%)

8.6 Others - Market size and forecast 2025-2030

Chart on Others - Market size and forecast 2025-2030 ($ million)
Data Table on Others - Market size and forecast 2025-2030 ($ million)
Chart on Others - Year-over-year growth 2025-2030 (%)
Data Table on Others - Year-over-year growth 2025-2030 (%)

8.7 Market opportunity by Application

Market opportunity by Application ($ million)
Data Table on Market opportunity by Application ($ million)

9. Market Segmentation by Product

9.1 Market segments

Chart on Product - Market share 2025-2030 (%)
Data Table on Product - Market share 2025-2030 (%)

9.2 Comparison by Product

Chart on Comparison by Product
Data Table on Comparison by Product

9.3 Domestic - Market size and forecast 2025-2030

Chart on Domestic - Market size and forecast 2025-2030 ($ million)
Data Table on Domestic - Market size and forecast 2025-2030 ($ million)
Chart on Domestic - Year-over-year growth 2025-2030 (%)
Data Table on Domestic - Year-over-year growth 2025-2030 (%)

9.4 International - Market size and forecast 2025-2030

Chart on International - Market size and forecast 2025-2030 ($ million)
Data Table on International - Market size and forecast 2025-2030 ($ million)
Chart on International - Year-over-year growth 2025-2030 (%)
Data Table on International - Year-over-year growth 2025-2030 (%)

9.5 Market opportunity by Product

Market opportunity by Product ($ million)
Data Table on Market opportunity by Product ($ million)

10. Market Segmentation by Type

10.1 Market segments

Chart on Type - Market share 2025-2030 (%)
Data Table on Type - Market share 2025-2030 (%)

10.2 Comparison by Type

Chart on Comparison by Type
Data Table on Comparison by Type

10.3 Recreational - Market size and forecast 2025-2030

Chart on Recreational - Market size and forecast 2025-2030 ($ million)
Data Table on Recreational - Market size and forecast 2025-2030 ($ million)
Chart on Recreational - Year-over-year growth 2025-2030 (%)
Data Table on Recreational - Year-over-year growth 2025-2030 (%)

10.4 Diversionary - Market size and forecast 2025-2030

Chart on Diversionary - Market size and forecast 2025-2030 ($ million)
Data Table on Diversionary - Market size and forecast 2025-2030 ($ million)
Chart on Diversionary - Year-over-year growth 2025-2030 (%)
Data Table on Diversionary - Year-over-year growth 2025-2030 (%)

10.5 Existential - Market size and forecast 2025-2030

Chart on Existential - Market size and forecast 2025-2030 ($ million)
Data Table on Existential - Market size and forecast 2025-2030 ($ million)
Chart on Existential - Year-over-year growth 2025-2030 (%)
Data Table on Existential - Year-over-year growth 2025-2030 (%)

10.6 Experimental - Market size and forecast 2025-2030

Chart on Experimental - Market size and forecast 2025-2030 ($ million)
Data Table on Experimental - Market size and forecast 2025-2030 ($ million)
Chart on Experimental - Year-over-year growth 2025-2030 (%)
Data Table on Experimental - Year-over-year growth 2025-2030 (%)

10.7 Market opportunity by Type

Market opportunity by Type ($ million)
Data Table on Market opportunity by Type ($ million)

11. Customer Landscape

11.1 Customer landscape overview

Analysis of price sensitivity, lifecycle, customer purchase basket, adoption rates, and purchase criteria

12. Geographic Landscape

12.1 Geographic segmentation

Chart on Market share by geography 2025-2030 (%)
Data Table on Market share by geography 2025-2030 (%)

12.2 Geographic comparison

Chart on Geographic comparison
Data Table on Geographic comparison

12.3 Europe - Market size and forecast 2025-2030

Chart on Europe - Market size and forecast 2025-2030 ($ million)
Data Table on Europe - Market size and forecast 2025-2030 ($ million)
Chart on Europe - Year-over-year growth 2025-2030 (%)
Data Table on Europe - Year-over-year growth 2025-2030 (%)
Chart on Regional Comparison - Europe
Data Table on Regional Comparison - Europe

12.3.1 Italy - Market size and forecast 2025-2030

Chart on Italy - Market size and forecast 2025-2030 ($ million)
Data Table on Italy - Market size and forecast 2025-2030 ($ million)
Chart on Italy - Year-over-year growth 2025-2030 (%)
Data Table on Italy - Year-over-year growth 2025-2030 (%)

12.3.2 France - Market size and forecast 2025-2030

Chart on France - Market size and forecast 2025-2030 ($ million)
Data Table on France - Market size and forecast 2025-2030 ($ million)
Chart on France - Year-over-year growth 2025-2030 (%)
Data Table on France - Year-over-year growth 2025-2030 (%)

12.3.3 Spain - Market size and forecast 2025-2030

Chart on Spain - Market size and forecast 2025-2030 ($ million)
Data Table on Spain - Market size and forecast 2025-2030 ($ million)
Chart on Spain - Year-over-year growth 2025-2030 (%)
Data Table on Spain - Year-over-year growth 2025-2030 (%)

12.3.4 Germany - Market size and forecast 2025-2030

Chart on Germany - Market size and forecast 2025-2030 ($ million)
Data Table on Germany - Market size and forecast 2025-2030 ($ million)
Chart on Germany - Year-over-year growth 2025-2030 (%)
Data Table on Germany - Year-over-year growth 2025-2030 (%)

12.3.5 UK - Market size and forecast 2025-2030

Chart on UK - Market size and forecast 2025-2030 ($ million)
Data Table on UK - Market size and forecast 2025-2030 ($ million)
Chart on UK - Year-over-year growth 2025-2030 (%)
Data Table on UK - Year-over-year growth 2025-2030 (%)

12.3.6 The Netherlands - Market size and forecast 2025-2030

Chart on The Netherlands - Market size and forecast 2025-2030 ($ million)
Data Table on The Netherlands - Market size and forecast 2025-2030 ($ million)
Chart on The Netherlands - Year-over-year growth 2025-2030 (%)
Data Table on The Netherlands - Year-over-year growth 2025-2030 (%)

12.4 North America - Market size and forecast 2025-2030

Chart on North America - Market size and forecast 2025-2030 ($ million)
Data Table on North America - Market size and forecast 2025-2030 ($ million)
Chart on North America - Year-over-year growth 2025-2030 (%)
Data Table on North America - Year-over-year growth 2025-2030 (%)
Chart on Regional Comparison - North America
Data Table on Regional Comparison - North America

12.4.1 US - Market size and forecast 2025-2030

Chart on US - Market size and forecast 2025-2030 ($ million)
Data Table on US - Market size and forecast 2025-2030 ($ million)
Chart on US - Year-over-year growth 2025-2030 (%)
Data Table on US - Year-over-year growth 2025-2030 (%)

12.4.2 Canada - Market size and forecast 2025-2030

Chart on Canada - Market size and forecast 2025-2030 ($ million)
Data Table on Canada - Market size and forecast 2025-2030 ($ million)
Chart on Canada - Year-over-year growth 2025-2030 (%)
Data Table on Canada - Year-over-year growth 2025-2030 (%)

12.4.3 Mexico - Market size and forecast 2025-2030

Chart on Mexico - Market size and forecast 2025-2030 ($ million)
Data Table on Mexico - Market size and forecast 2025-2030 ($ million)
Chart on Mexico - Year-over-year growth 2025-2030 (%)
Data Table on Mexico - Year-over-year growth 2025-2030 (%)

12.5 APAC - Market size and forecast 2025-2030

Chart on APAC - Market size and forecast 2025-2030 ($ million)
Data Table on APAC - Market size and forecast 2025-2030 ($ million)
Chart on APAC - Year-over-year growth 2025-2030 (%)
Data Table on APAC - Year-over-year growth 2025-2030 (%)
Chart on Regional Comparison - APAC
Data Table on Regional Comparison - APAC

12.5.1 China - Market size and forecast 2025-2030

Chart on China - Market size and forecast 2025-2030 ($ million)
Data Table on China - Market size and forecast 2025-2030 ($ million)
Chart on China - Year-over-year growth 2025-2030 (%)
Data Table on China - Year-over-year growth 2025-2030 (%)

12.5.2 Japan - Market size and forecast 2025-2030

Chart on Japan - Market size and forecast 2025-2030 ($ million)
Data Table on Japan - Market size and forecast 2025-2030 ($ million)
Chart on Japan - Year-over-year growth 2025-2030 (%)
Data Table on Japan - Year-over-year growth 2025-2030 (%)

12.5.3 India - Market size and forecast 2025-2030

Chart on India - Market size and forecast 2025-2030 ($ million)
Data Table on India - Market size and forecast 2025-2030 ($ million)
Chart on India - Year-over-year growth 2025-2030 (%)
Data Table on India - Year-over-year growth 2025-2030 (%)

12.5.4 Thailand - Market size and forecast 2025-2030

Chart on Thailand - Market size and forecast 2025-2030 ($ million)
Data Table on Thailand - Market size and forecast 2025-2030 ($ million)
Chart on Thailand - Year-over-year growth 2025-2030 (%)
Data Table on Thailand - Year-over-year growth 2025-2030 (%)

12.5.5 South Korea - Market size and forecast 2025-2030

Chart on South Korea - Market size and forecast 2025-2030 ($ million)
Data Table on South Korea - Market size and forecast 2025-2030 ($ million)
Chart on South Korea - Year-over-year growth 2025-2030 (%)
Data Table on South Korea - Year-over-year growth 2025-2030 (%)

12.5.6 Australia - Market size and forecast 2025-2030

Chart on Australia - Market size and forecast 2025-2030 ($ million)
Data Table on Australia - Market size and forecast 2025-2030 ($ million)
Chart on Australia - Year-over-year growth 2025-2030 (%)
Data Table on Australia - Year-over-year growth 2025-2030 (%)

12.6 South America - Market size and forecast 2025-2030

Chart on South America - Market size and forecast 2025-2030 ($ million)
Data Table on South America - Market size and forecast 2025-2030 ($ million)
Chart on South America - Year-over-year growth 2025-2030 (%)
Data Table on South America - Year-over-year growth 2025-2030 (%)
Chart on Regional Comparison - South America
Data Table on Regional Comparison - South America

12.6.1 Brazil - Market size and forecast 2025-2030

Chart on Brazil - Market size and forecast 2025-2030 ($ million)
Data Table on Brazil - Market size and forecast 2025-2030 ($ million)
Chart on Brazil - Year-over-year growth 2025-2030 (%)
Data Table on Brazil - Year-over-year growth 2025-2030 (%)

12.6.2 Argentina - Market size and forecast 2025-2030

Chart on Argentina - Market size and forecast 2025-2030 ($ million)
Data Table on Argentina - Market size and forecast 2025-2030 ($ million)
Chart on Argentina - Year-over-year growth 2025-2030 (%)
Data Table on Argentina - Year-over-year growth 2025-2030 (%)

12.6.3 Peru - Market size and forecast 2025-2030

Chart on Peru - Market size and forecast 2025-2030 ($ million)
Data Table on Peru - Market size and forecast 2025-2030 ($ million)
Chart on Peru - Year-over-year growth 2025-2030 (%)
Data Table on Peru - Year-over-year growth 2025-2030 (%)

12.7 Middle East and Africa - Market size and forecast 2025-2030

Chart on Middle East and Africa - Market size and forecast 2025-2030 ($ million)
Data Table on Middle East and Africa - Market size and forecast 2025-2030 ($ million)
Chart on Middle East and Africa - Year-over-year growth 2025-2030 (%)
Data Table on Middle East and Africa - Year-over-year growth 2025-2030 (%)
Chart on Regional Comparison - Middle East and Africa
Data Table on Regional Comparison - Middle East and Africa

12.7.1 Turkey - Market size and forecast 2025-2030

Chart on Turkey - Market size and forecast 2025-2030 ($ million)
Data Table on Turkey - Market size and forecast 2025-2030 ($ million)
Chart on Turkey - Year-over-year growth 2025-2030 (%)
Data Table on Turkey - Year-over-year growth 2025-2030 (%)

12.7.2 UAE - Market size and forecast 2025-2030

Chart on UAE - Market size and forecast 2025-2030 ($ million)
Data Table on UAE - Market size and forecast 2025-2030 ($ million)
Chart on UAE - Year-over-year growth 2025-2030 (%)
Data Table on UAE - Year-over-year growth 2025-2030 (%)

12.7.3 Morocco - Market size and forecast 2025-2030

Chart on Morocco - Market size and forecast 2025-2030 ($ million)
Data Table on Morocco - Market size and forecast 2025-2030 ($ million)
Chart on Morocco - Year-over-year growth 2025-2030 (%)
Data Table on Morocco - Year-over-year growth 2025-2030 (%)

12.7.4 South Africa - Market size and forecast 2025-2030

Chart on South Africa - Market size and forecast 2025-2030 ($ million)
Data Table on South Africa - Market size and forecast 2025-2030 ($ million)
Chart on South Africa - Year-over-year growth 2025-2030 (%)
Data Table on South Africa - Year-over-year growth 2025-2030 (%)

12.7.5 Saudi Arabia - Market size and forecast 2025-2030

Chart on Saudi Arabia - Market size and forecast 2025-2030 ($ million)
Data Table on Saudi Arabia - Market size and forecast 2025-2030 ($ million)
Chart on Saudi Arabia - Year-over-year growth 2025-2030 (%)
Data Table on Saudi Arabia - Year-over-year growth 2025-2030 (%)

12.8 Market opportunity by geography

Market opportunity by geography ($ million)
Data Tables on Market opportunity by geography ($ million)

13. Drivers, Challenges, and Opportunity

13.1 Market drivers

Growing consumer interest in authentic local food experiences
Influence of social media on food travel decisions
Expansion of food festivals and tourism events

13.2 Market challenges

Reducing affordability of culinary tourism experiences due to rising travel costs
Limited infrastructure in emerging culinary tourism destinations
Lack of skilled culinary guides and trained hospitality staff

13.3 Impact of drivers and challenges

Impact of drivers and challenges in 2025 and 2030

13.4 Market opportunities

Rise in demand for chef-led culinary tourism experiences
Increasing demand for sustainable local food
Rising popularity of heritage cuisine tourism experiences

14. Competitive Landscape

14.1 Overview

14.2

Overview on criticality of inputs and factors of differentiation

14.3 Landscape disruption

Overview on factors of disruption

14.4 Industry risks

Impact of key risks on business

15. Competitive Analysis

15.1 Companies profiled

Companies covered

15.2 Company ranking index

15.3 Market positioning of companies

Matrix on companies position and classification

15.4 A and K Travel Group Ltd.

A and K Travel Group Ltd. - Overview
A and K Travel Group Ltd. - Product / Service
A and K Travel Group Ltd. - Key offerings
SWOT

15.5 Airbnb Inc.

Airbnb Inc. - Overview
Airbnb Inc. - Product / Service
Airbnb Inc. - Key offerings
SWOT

15.6 Butterfield and Robinson Inc.

Butterfield and Robinson Inc. - Overview
Butterfield and Robinson Inc. - Product / Service
Butterfield and Robinson Inc. - Key offerings
SWOT

15.7 Context Travel LLC

Context Travel LLC - Overview
Context Travel LLC - Product / Service
Context Travel LLC - Key offerings
SWOT

15.8 Devour Tours

Devour Tours - Overview
Devour Tours - Product / Service
Devour Tours - Key offerings
SWOT

15.9 Eating Europe Tours

Eating Europe Tours - Overview
Eating Europe Tours - Product / Service
Eating Europe Tours - Key offerings
SWOT

15.10 Epicurean Ways LLC

Epicurean Ways LLC - Overview
Epicurean Ways LLC - Product / Service
Epicurean Ways LLC - Key offerings
SWOT

15.11 Fork and Walk Tours Berlin

Fork and Walk Tours Berlin - Overview
Fork and Walk Tours Berlin - Product / Service
Fork and Walk Tours Berlin - Key offerings
SWOT

15.12 G Adventures Inc.

G Adventures Inc. - Overview
G Adventures Inc. - Product / Service
G Adventures Inc. - Key offerings
SWOT

15.13 Gourmet On Tour Ltd.

Gourmet On Tour Ltd. - Overview
Gourmet On Tour Ltd. - Product / Service
Gourmet On Tour Ltd. - Key offerings
SWOT

15.14 Intrepid Group Pty Ltd.

Intrepid Group Pty Ltd. - Overview
Intrepid Group Pty Ltd. - Product / Service
Intrepid Group Pty Ltd. - Key offerings
SWOT

15.15 Intrepid Urban Adventures

Intrepid Urban Adventures - Overview
Intrepid Urban Adventures - Product / Service
Intrepid Urban Adventures - Key offerings
SWOT

15.16 Trafalgar

Trafalgar - Overview
Trafalgar - Product / Service
Trafalgar - Key offerings
SWOT

15.17 TripAdvisor Inc.

TripAdvisor Inc. - Overview
TripAdvisor Inc. - Business segments
TripAdvisor Inc. - Key offerings
TripAdvisor Inc. - Segment focus
SWOT

15.18 Zicasso Inc.

Zicasso Inc. - Overview
Zicasso Inc. - Product / Service
Zicasso Inc. - Key offerings
SWOT

16. Appendix

16.1 Scope of the report

Market definition
Objectives
Notes and caveats

16.2 Inclusions and exclusions checklist

Inclusions checklist
Exclusions checklist

16.3 Currency conversion rates for US$

16.4 Research methodology

16.5 Data procurement

Information sources

16.6 Data validation

16.7 Validation techniques employed for market sizing

16.8 Data synthesis

16.9 360 degree market analysis

16.10 List of abbreviations

Research Methodology

Technavio presents a detailed picture of the market by way of study, synthesis, and summation of data from multiple sources. The analysts have presented the various facets of the market with a particular focus on identifying the key industry influencers. The data thus presented is comprehensive, reliable, and the result of extensive research, both primary and secondary.

INFORMATION SOURCES

Primary sources

  • Manufacturers and suppliers
  • Channel partners
  • Industry experts
  • Strategic decision makers

Secondary sources

  • Industry journals and periodicals
  • Government data
  • Financial reports of key industry players
  • Historical data
  • Press releases

DATA ANALYSIS

Data Synthesis

  • Collation of data
  • Estimation of key figures
  • Analysis of derived insights

Data Validation

  • Triangulation with data models
  • Reference against proprietary databases
  • Corroboration with industry experts

REPORT WRITING

Qualitative

  • Market drivers
  • Market challenges
  • Market trends
  • Five forces analysis

Quantitative

  • Market size and forecast
  • Market segmentation
  • Geographical insights
  • Competitive landscape

Interested in this report?

Get your sample now to see our research methodology and insights!

Download Now

Frequently Asked Questions

Culinary Tourism market growth will increase by USD 310705.1 million during 2026-2030.

The Culinary Tourism market is expected to grow at a CAGR of 23.3% during 2026-2030.

Culinary Tourism market is segmented by Application (Food festival, Culinary trails, Cooking classes, Others) Product (Domestic, International) Type (Recreational, Diversionary, Existential, Experimental)

A and K Travel Group Ltd., Airbnb Inc., Butterfield and Robinson Inc., Context Travel LLC, Cookly Pte. Ltd., Culinary Backstreets LLC, Devour Tours, Eating Europe Tours, Epicurean Ways LLC, Essor Ltd, Fork and Walk Tours Berlin, G Adventures Inc., Gourmet On Tour Ltd., Intrepid Group Pty Ltd., Intrepid Urban Adventures, Taste Buds Travel, Trafalgar, TripAdvisor Inc., Zicasso Inc. are a few of the key vendors in the Culinary Tourism market.

Europe will register the highest growth rate of 35.1% among the other regions. Therefore, the Culinary Tourism market in Europe is expected to garner significant business opportunities for the vendors during the forecast period.

Italy, France, Spain, Germany, UK, The Netherlands, US, Canada, Mexico, China, Japan, India, Thailand, South Korea, Australia, Brazil, Argentina, Peru, Turkey, UAE, Morocco, South Africa, Saudi Arabia

  • Growing consumer interest in authentic local food experiences is the driving factor this market.

The Culinary Tourism market vendors should focus on grabbing business opportunities from the Application segment as it accounted for the largest market share in the base year.
RIA - Research AI Assistant
Ask RIA