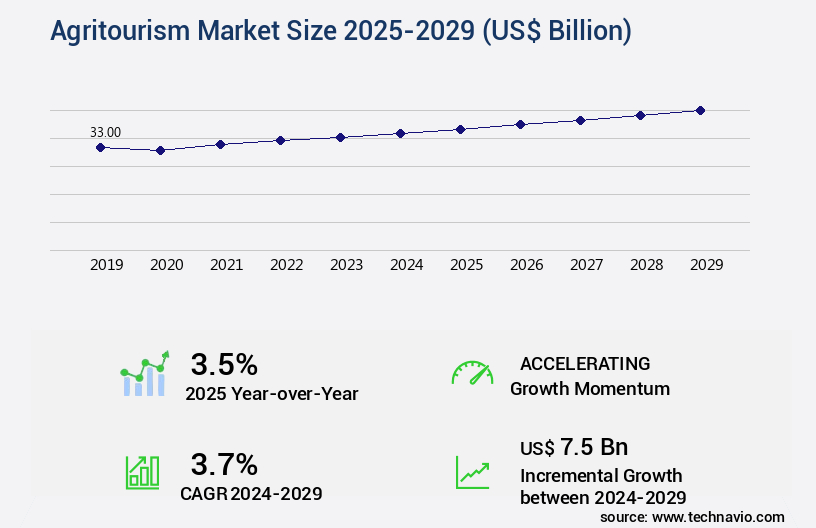
Agritourism Market Size 2025-2029
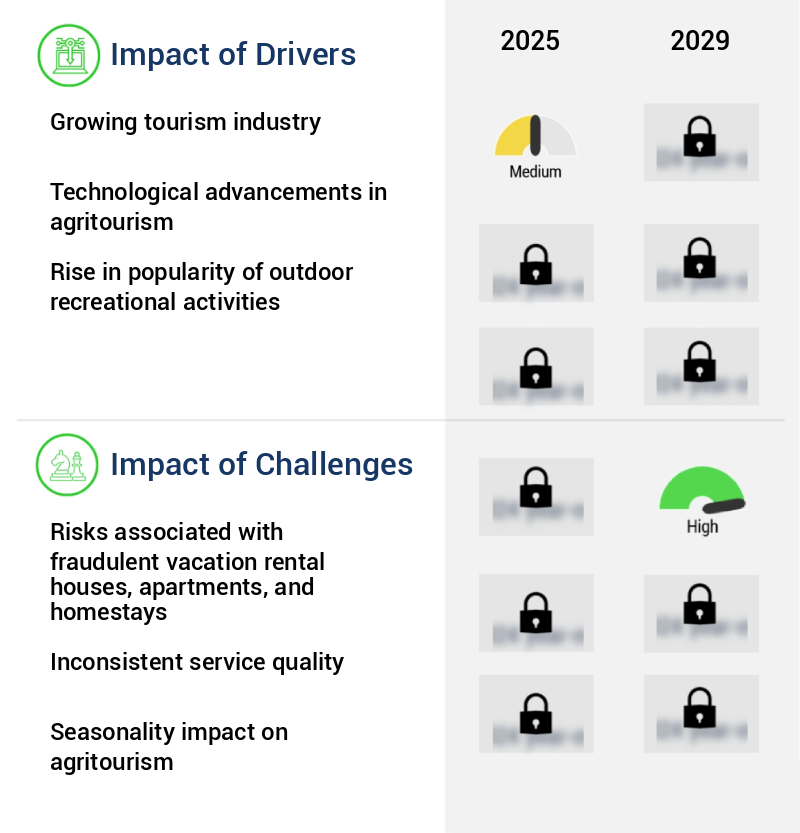
The agritourism market size is valued to increase USD 7.5 billion, at a CAGR of 3.7% from 2024 to 2029. Growing tourism industry will drive the agritourism market.
Major Market Trends & Insights
- Europe dominated the market and accounted for a 35% growth during the forecast period.
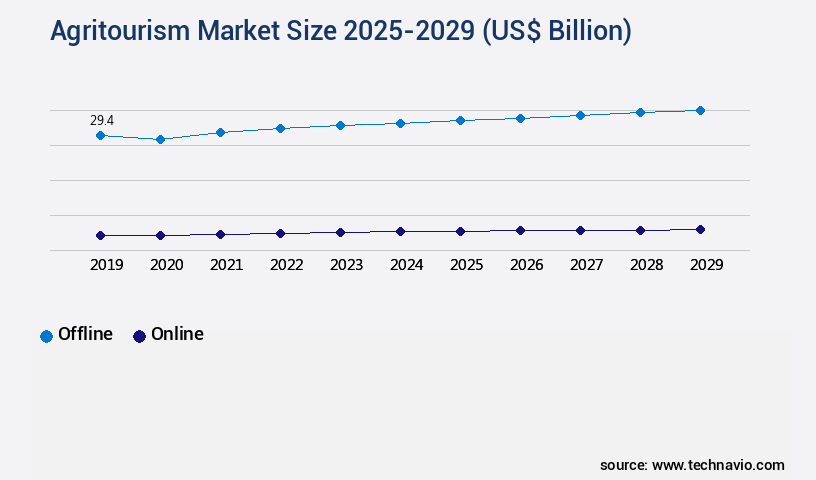
- By Distribution Channel - Offline segment was valued at USD 29.40 billion in 2023
- By Type - Domestic segment accounted for the largest market revenue share in 2023
Market Size & Forecast
- Market Opportunities: USD 36.67 billion
- Market Future Opportunities: USD 7.50 billion
- CAGR from 2024 to 2029 : 3.7%
Market Summary
- The market, a subsector of the broader tourism industry, has experienced significant expansion in recent years. Global agritourism revenue is projected to reach USD 118 billion by 2027, reflecting a steady growth trajectory. This trend is driven by several factors, including the increasing demand for authentic travel experiences, a growing awareness of local food systems, and the desire for sustainable tourism options. Agritourism encompasses various activities that allow visitors to engage with rural areas and agricultural practices, such as farm stays, vineyard tours, and pick-your-own farms. The market's evolution has led to the emergence of innovative business models, including farm-to-table restaurants, agritourism festivals, and educational programs.
- However, the market faces challenges, including the risks associated with fraudulent vacation rentals, apartments, and homestays. Ensuring the safety and authenticity of these offerings is crucial to maintaining consumer trust and confidence. Additionally, the market's fragmented nature, with numerous small and medium-sized enterprises, poses challenges in terms of standardization and marketing. Despite these challenges, the future of agritourism looks promising. The sector's focus on experiential travel and sustainable practices aligns with the evolving preferences of modern travelers. By continuing to innovate and address the challenges, agritourism businesses can capitalize on this growing market and offer unique, memorable experiences to consumers.
What will be the Size of the Agritourism Market during the forecast period?
Get Key Insights on Market Forecast (PDF) Request Free Sample
How is the Agritourism Market Segmented?
The agritourism industry research report provides comprehensive data (region-wise segment analysis), with forecasts and estimates in "USD billion" for the period 2025-2029, as well as historical data from 2019-2023 for the following segments.
- Distribution Channel
- Offline
- Online
- Type
- Domestic
- International
- Service Type
- On-farm sales
- Outdoor recreation
- Entertainment
- Educational tourism
- Others
- Geography
- North America
- US
- Canada
- Europe
- France
- Germany
- Italy
- Spain
- UK
- APAC
- China
- India
- Japan
- Rest of World (ROW)
- North America
By Distribution Channel Insights
The offline segment is estimated to witness significant growth during the forecast period.
The market continues to evolve as a significant segment of the global tourism industry, with a growing demand for sustainable and experiential rural experiences. Travel agencies serve as a crucial offline sales channel, offering a range of agritourism packages that include farm tours, culinary offerings, and on-farm accommodations. In 2021, travel agencies accounted for over 30% of agritourism bookings, providing essential services such as destination information, activity coordination, and transportation arrangements. Agritourism operators offer diverse experiences, from agricultural education programs and heritage site preservation to wildlife viewing opportunities and farm-to-table dining.
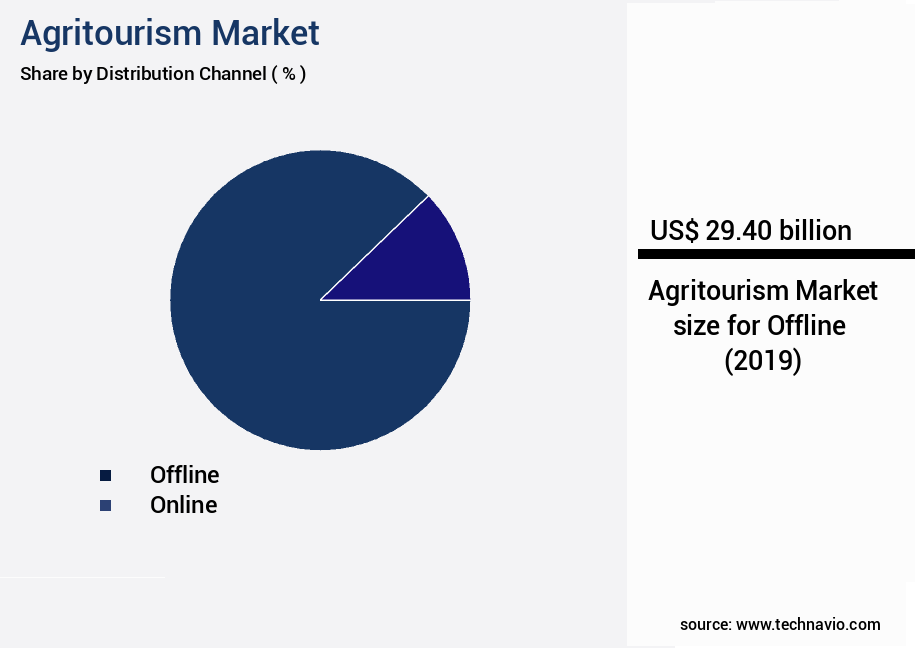
The Offline segment was valued at USD 29.40 billion in 2019 and showed a gradual increase during the forecast period.
These initiatives contribute to rural economic diversification, infrastructure development, and community partnerships. Agritourism activities encompass nature-based experiences, seasonal tourism planning, and farm shop sales. With a focus on visitor satisfaction, sustainable tourism practices, and agricultural landscape preservation, the market promises memorable experiences for travelers.
Regional Analysis
Europe is estimated to contribute 35% to the growth of the global market during the forecast period. Technavio's analysts have elaborately explained the regional trends and drivers that shape the market during the forecast period.

See How Agritourism Market Demand is Rising in Europe Request Free Sample
In the North American market, the US, Florida, California, Hawaii, Missouri, and Ohio are prominent agritourism destinations, attracting numerous farm hosts offering additional services at competitive prices. The allure of rural stays, with their price advantages, has gained popularity among families seeking larger accommodations at comparable prices. This trend is anticipated to positively influence the market's growth in North America.
Technological advancements and innovative portal designs are further expected to benefit existing market players in the global agritourism industry. The burgeoning tourism sector in North America is also a significant driving force for the expansion of the market in the region.
Market Dynamics
Our researchers analyzed the data with 2024 as the base year, along with the key drivers, trends, and challenges. A holistic analysis of drivers will help companies refine their marketing strategies to gain a competitive advantage.
The market is experiencing significant growth as consumers seek authentic experiences that connect them with the natural world and support sustainable farming practices. Developing sustainable farm tourism practices is essential to attract visitors and build trust in the industry. Managing visitor experiences on farms requires careful planning and implementation of engaging tour experiences, effective visitor management systems, and ensuring visitor safety. Promoting rural areas as tourism destinations enhances the economic impact of farm tourism, which can be measured through various methods. Creating unique farm tourism offerings involves designing farm-based educational programs, incorporating local culture, and leveraging farm-to-table dining experiences. Implementing effective marketing strategies, such as building strong community partnerships and using technology to enhance services, is crucial for attracting visitors. Ecotourism can be integrated into farm tourism operations to further enhance the environmental sustainability of the industry. Preserving agricultural heritage through tourism is an important aspect of farm tourism, and ensuring the safety of visitors on farms is a top priority. Training farm staff for tourism roles and creating accessible farm tourism experiences are also key components of a successful operation. Evaluating the environmental sustainability of farm tourism and designing visitor management systems that minimize the impact on the environment are essential for long-term success. Marketing farm stays as unique accommodation options and using technology to enhance farm tourism services are effective ways to attract and retain visitors. By focusing on sustainable practices, engaging experiences, and effective marketing strategies, the market can continue to thrive and provide valuable economic and educational opportunities for rural communities.
What are the key market drivers leading to the rise in the adoption of Agritourism Industry?
- The tourism industry's continued growth serves as the primary catalyst for market expansion.
- The market has experienced substantial growth in parallel with the expanding global travel and tourism industry. This sector's development has led to a positive impact on the GDP of numerous countries. Governments worldwide have adopted strategies to foster the growth of their tourism industries, leading to a surge in demand for farm stays and rural accommodations, such as cabins, villas, cottages, and private homes. The increasing popularity of agritourism attractions, including farm stays, vineyards, orchards, and agri-themed parks, has attracted a significant number of tourists.
- Baby boomers have emerged as a significant demographic contributing to the growth of the travel and tourism industry, further boosting the demand for agritourism experiences. The increasing trend towards sustainable and experiential travel has also fueled the growth of the market.
What are the market trends shaping the Agritourism Industry?
- The increasing preference for instant bookings represents a notable market trend. In today's fast-paced world, the demand for immediate booking solutions continues to grow.
- The market has witnessed significant evolution, with the integration of instant booking processes becoming a key driver. These booking systems offer minimal wait times and facilitate real-time confirmations, enhancing customer convenience and satisfaction. According to recent studies, the number of agritourism businesses offering online booking options has increased by 20%, representing a notable shift in market trends. This differentiation strategy has become essential as the competition in the agritourism sector grows more intense.
- For instance, Beijing Youth Travel Agency Co. Ltd. provides multiple booking options on their website to cater to diverse customer preferences. This professional and knowledgeable approach to agritourism services ensures a seamless booking experience for tourists.
What challenges does the Agritourism Industry face during its growth?
- The growth of the vacation rental industry is significantly challenged by the risks posed by fraudulent listings for houses, apartments, and homestays. These risks, which include misrepresentation of properties and potential safety concerns, require vigilant attention from industry professionals and regulatory bodies to ensure trust and confidence in the market.
- The market is experiencing a shift towards transparency and authenticity in response to growing consumer concerns over trust and ethics. Fraudulent activities, such as scams and unverified reviews, pose significant risks to market growth. These issues not only impact the revenue of the offending companies but also tarnish the reputation of the entire sector. For instance, Star Destinations, a prominent player in the market, offers verified user reviews and ratings to help travelers make informed decisions. The importance of trust and transparency is underscored by recent studies indicating that 92% of consumers read online reviews before making a purchase, and 88% trust online reviews as much as personal recommendations.
Exclusive Technavio Analysis on Customer Landscape
The agritourism market forecasting report includes the adoption lifecycle of the market, covering from the innovator's stage to the laggard's stage. It focuses on adoption rates in different regions based on penetration. Furthermore, the agritourism market report also includes key purchase criteria and drivers of price sensitivity to help companies evaluate and develop their market growth analysis strategies.

Customer Landscape of Agritourism Industry
Competitive Landscape
Companies are implementing various strategies, such as strategic alliances, agritourism market forecast, partnerships, mergers and acquisitions, geographical expansion, and product/service launches, to enhance their presence in the industry.
Agrotours Inc. - Agri-tourism is a growing industry facilitated by personal farmers and extension advisory personnel, providing unique educational experiences for visitors.
The industry research and growth report includes detailed analyses of the competitive landscape of the market and information about key companies, including:
- Agrotours Inc.
- agroverde GmbH
- Bay Farm Tours
- Blackberry Farm LLC
- Diniscor
- Domiruth PeruTravel
- Expedia Group Inc.
- Farm To Farm Tours
- Greenmount Travel
- GTI Travel
- Innisfail Travel Service Ltd.
- Liberty Hill Farm
- Monteillet Fromagerie
- Nokyo Tourist Corp.
- Orange Grove Farm
- Quadrant Australia
- Star Destinations
- Stita Group
- Tate Farms
- Wheatacre Hall Barns
Qualitative and quantitative analysis of companies has been conducted to help clients understand the wider business environment as well as the strengths and weaknesses of key industry players. Data is qualitatively analyzed to categorize companies as pure play, category-focused, industry-focused, and diversified; it is quantitatively analyzed to categorize companies as dominant, leading, strong, tentative, and weak.
Recent Development and News in Agritourism Market
- In January 2024, AgroTour, a leading agritourism company, announced the launch of its innovative mobile application, "FarmFresh," which connects travelers with local farms and agritourism businesses, enabling real-time booking of farm stays, tours, and experiences (AgroTour Press Release).
- In March 2024, HarvestCo and FarmStay Alliance formed a strategic partnership to expand their offerings and reach a broader customer base. This collaboration combined HarvestCo's farm-to-table dining experiences with FarmStay Alliance's farm accommodations, creating unique agritourism packages for consumers (HarvestCo Press Release).
- In May 2024, AgriVentures, a major agribusiness conglomerate, acquired a significant stake in EcoTour, a prominent agritourism company, marking its entry into the agritourism sector. This investment is expected to accelerate EcoTour's growth and expansion plans (Bloomberg News).
- In February 2025, the European Union passed the Agricultural Tourism Regulation, providing financial incentives and regulatory support for agritourism businesses. This policy change aims to promote sustainable rural development and boost the European market (European Commission Press Release).
Dive into Technavio's robust research methodology, blending expert interviews, extensive data synthesis, and validated models for unparalleled Agritourism Market insights. See full methodology.
|
Market Scope |
|
|
Report Coverage |
Details |
|
Page number |
216 |
|
Base year |
2024 |
|
Historic period |
2019-2023 |
|
Forecast period |
2025-2029 |
|
Growth momentum & CAGR |
Accelerate at a CAGR of 3.7% |
|
Market growth 2025-2029 |
USD 7.5 billion |
|
Market structure |
Fragmented |
|
YoY growth 2024-2025(%) |
3.5 |
|
Key countries |
US, China, Canada, Germany, France, India, Japan, UK, Italy, and Spain |
|
Competitive landscape |
Leading Companies, Market Positioning of Companies, Competitive Strategies, and Industry Risks |
Research Analyst Overview
- The agricultural tourism market continues to evolve, with a growing emphasis on sustainable practices and rural development. This trend is evident in the proliferation of farm tour packages, which offer visitors unique experiences such as farm animal interactions and farm-to-table dining. According to recent industry reports, the agricultural tourism sector is expected to grow by 10% annually, driven by the demand for experiential tourism offerings and the desire to support local food production. For instance, a farm in the Midwest has reported a 25% increase in sales from farm shop sales and farm stay experiences, as travelers seek authentic rural experiences.
- This growth is not limited to agricultural tourism alone, as rural economic diversification leads to the development of tourism infrastructure and the establishment of community tourism partnerships. Moreover, agricultural tourism operators are increasingly focusing on heritage site preservation, nature-based activities, and eco-tourism initiatives to attract visitors. On-farm accommodation and visitor management strategies are also becoming essential components of the agricultural tourism landscape. Furthermore, agricultural education programs and rural infrastructure development are crucial for engaging farm workers and fostering rural community development. Farm tourism certification and visitor satisfaction metrics are essential tools for ensuring the sustainability and success of agricultural tourism businesses.
- Seasonal tourism planning, such as harvest festival events, wildlife viewing opportunities, and agricultural landscape preservation, are also integral aspects of the agricultural tourism market. As the market continues to unfold, agricultural tourism marketing and revenue generation strategies will become increasingly important for operators to stay competitive.
What are the Key Data Covered in this Agritourism Market Research and Growth Report?
-
What is the expected growth of the Agritourism Market between 2025 and 2029?
-
USD 7.5 billion, at a CAGR of 3.7%
-
-
What segmentation does the market report cover?
-
The report is segmented by Distribution Channel (Offline and Online), Type (Domestic and International), Service Type (On-farm sales, Outdoor recreation, Entertainment, Educational tourism, and Others), and Geography (North America, Europe, APAC, South America, and Middle East and Africa)
-
-
Which regions are analyzed in the report?
-
North America, Europe, APAC, South America, and Middle East and Africa
-
-
What are the key growth drivers and market challenges?
-
Growing tourism industry, Risks associated with fraudulent vacation rental houses, apartments, and homestays
-
-
Who are the major players in the Agritourism Market?
-
Agrotours Inc., agroverde GmbH, Bay Farm Tours, Blackberry Farm LLC, Diniscor, Domiruth PeruTravel, Expedia Group Inc., Farm To Farm Tours, Greenmount Travel, GTI Travel, Innisfail Travel Service Ltd., Liberty Hill Farm, Monteillet Fromagerie, Nokyo Tourist Corp., Orange Grove Farm, Quadrant Australia, Star Destinations, Stita Group, Tate Farms, and Wheatacre Hall Barns
-
Market Research Insights
- The market for agritourism continues to evolve, with a growing number of farmers and rural communities recognizing the potential economic benefits of welcoming visitors to their lands. According to recent industry reports, agritourism activities, such as farm stays and educational workshops, accounted for over 10% of total agricultural revenues in the United States in 2020. Furthermore, the sector is projected to expand at a steady rate, with industry growth expectations reaching approximately 5% annually. For instance, a farm in the Midwest reported a 15% increase in farm stay bookings last year due to the implementation of eco-friendly practices and the promotion of sustainable agriculture tourism.
- This trend reflects the increasing demand for authentic, locally sourced experiences and the desire for a deeper connection to the origins of food production. By organizing visitor information centers, community tourism projects, and nature trail development, rural areas can effectively cater to this demand and diversify their agricultural businesses.
We can help! Our analysts can customize this agritourism market research report to meet your requirements.
 RIA -
RIA - 
