ETF Market Analysis, Size, and Forecast 2026-2030: North America (US, Canada, and Mexico), Europe (Germany, UK, and France), APAC (China, Japan, and India), South America (Brazil and Argentina), Middle East and Africa (Saudi Arabia, UAE, and South Africa), and Rest of World (ROW)

ETF Market Analysis, Size, and Forecast 2026-2030:
North America (US, Canada, and Mexico), Europe (Germany, UK, and France), APAC (China, Japan, and India), South America (Brazil and Argentina), Middle East and Africa (Saudi Arabia, UAE, and South Africa), and Rest of World (ROW)

Published: Mar 2026 297 Pages SKU: IRTNTR74013

Market Overview at a Glance

$19.30 B
Market Opportunity
19.2%
CAGR 2025 - 2030
45.9%
North America Growth
$3.03 B
Equity ETF segment 2024

ETF Market Size 2026-2030

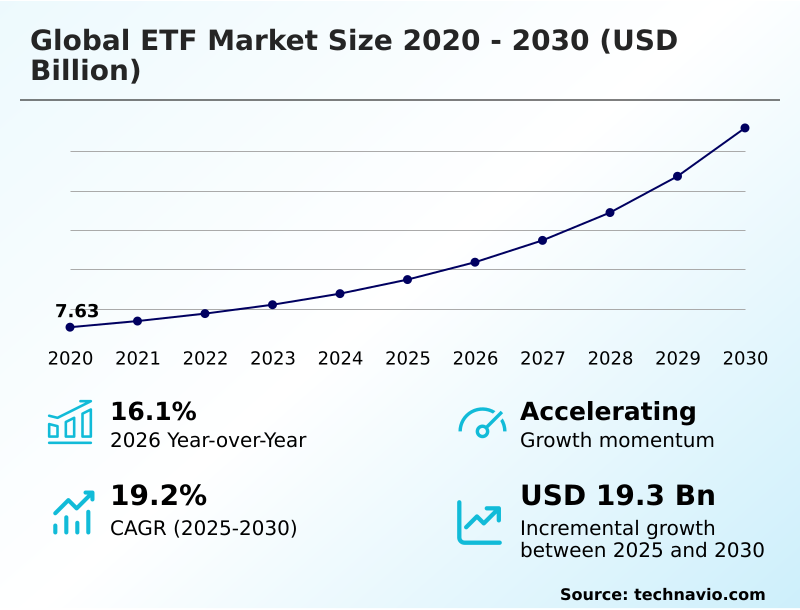
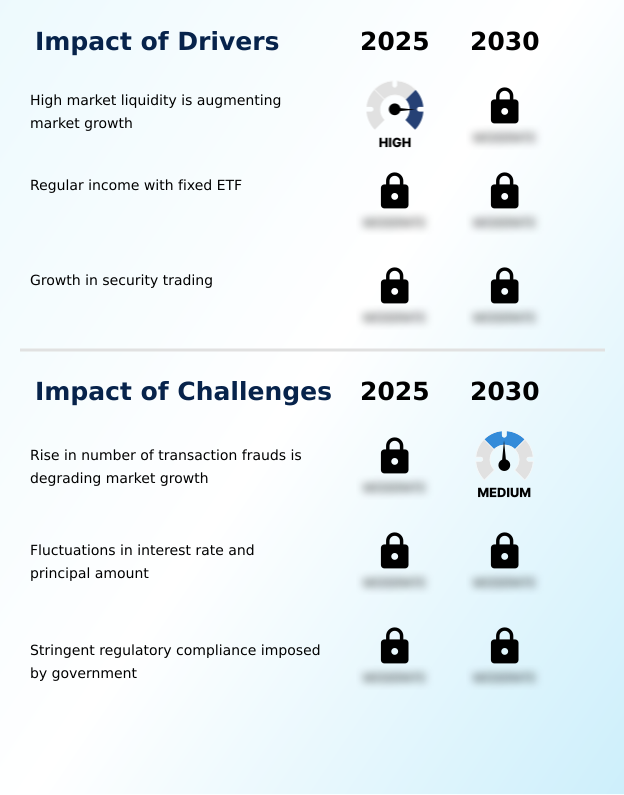
The etf market size is valued to increase by USD 19.30 billion, at a CAGR of 19.2% from 2025 to 2030. High market liquidity is augmenting market growth will drive the etf market.

Major Market Trends & Insights

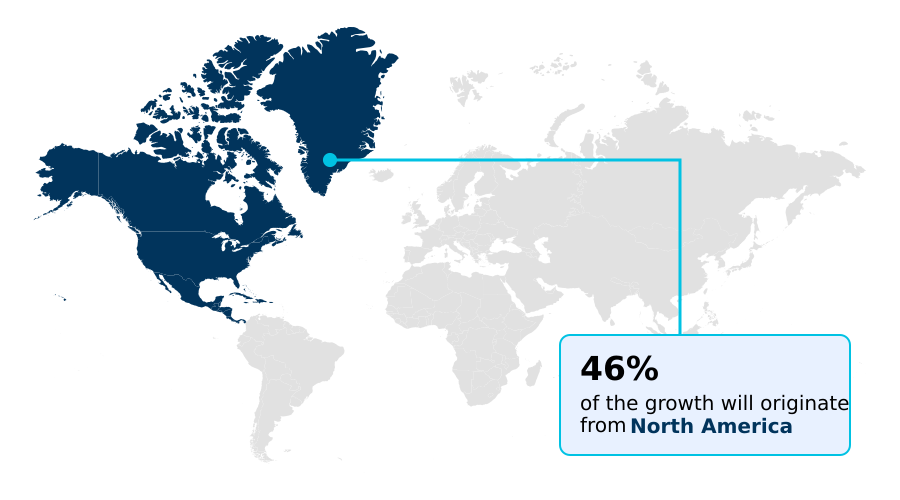
  • North America dominated the market and accounted for a 45.9% growth during the forecast period.
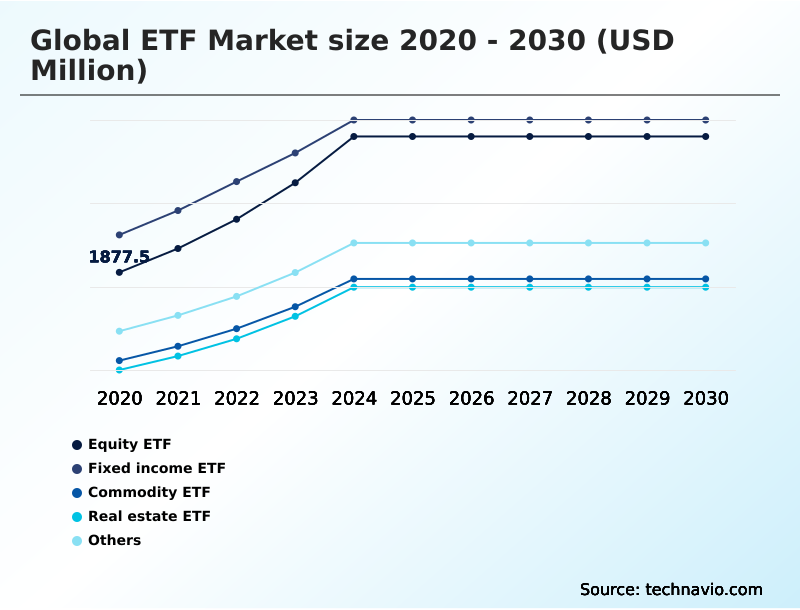
  • By Type - Equity ETF segment was valued at USD 3.03 billion in 2024
  • By Product Type - Large cap ETFs segment accounted for the largest market revenue share in 2024

Market Size & Forecast

  • Market Opportunities: USD 25.36 billion
  • Market Future Opportunities: USD 19.30 billion
  • CAGR from 2025 to 2030 : 19.2%

Market Summary

  • The ETF Market is undergoing significant expansion, driven by investor demand for transparent, liquid, and cost-effective investment vehicles. These funds provide diversified exposure across various asset classes, from broad equity indices to niche thematic investing areas like technology and sustainability.
  • A key driver is the ongoing shift from traditional, high-fee mutual funds to passive investment strategies, where the lower expense ratio and tax efficiency of ETFs are highly valued.
  • For instance, wealth management firms are increasingly building client portfolios around a core of broad market ETFs, supplemented by satellite holdings in actively managed ETFs or smart-beta strategies to target specific return profiles or risk factors. This approach allows for efficient asset allocation and rebalancing. However, the market is not without challenges.
  • The proliferation of complex products requires greater investor due diligence, and the industry faces continuous pressure to innovate while navigating stringent regulatory compliance frameworks. The integration of ESG investing criteria is also a dominant trend, compelling asset managers to develop new products that align with evolving ethical and financial objectives.

What will be the Size of the ETF Market during the forecast period?

Get Key Insights on Market Forecast (PDF) Request Free Sample

How is the ETF Market Segmented?

The etf industry research report provides comprehensive data (region-wise segment analysis), with forecasts and estimates in "USD million" for the period 2026-2030, as well as historical data from 2020-2024 for the following segments.

  • Type
    • Equity ETF
    • Fixed income ETF
    • Commodity ETF
    • Real estate ETF
    • Others
  • Product type
    • Large cap ETFs
    • Mega cap ETFs
    • Mid cap ETFs
    • Small cap ETFs
  • Distribution channel
    • Institutional investors
    • Retail investors
    • Adviser or wealth manager platforms
  • Geography
    • North America
      • US
      • Canada
      • Mexico
    • Europe
      • Germany
      • UK
      • France
    • APAC
      • China
      • Japan
      • India
    • South America
      • Brazil
      • Argentina
    • Middle East and Africa
      • Saudi Arabia
      • UAE
      • South Africa
    • Rest of World (ROW)

By Type Insights

The equity etf segment is estimated to witness significant growth during the forecast period.

The equity ETF segment remains a cornerstone of the investment landscape, driven by a structural shift toward passive investing. These instruments offer investors efficient exposure to broad market indices and sector-specific portfolios, prized for their intraday tradability and tax efficiency.

The operational dynamics are defined by the creation and redemption mechanism, which ensures the fund's market price aligns with its net asset value (NAV), minimizing tracking error.

The segment's expansion is fueled by both institutional investors and retail investors leveraging these financial instruments for core equity holdings and strategic asset allocation.

Product innovation continues with a focus on factor-based investing and ESG investing, with some platforms seeing a 25% increase in ESG-related inquiries, reflecting evolving investor priorities and the search for differentiated market beta.

Request Free Sample

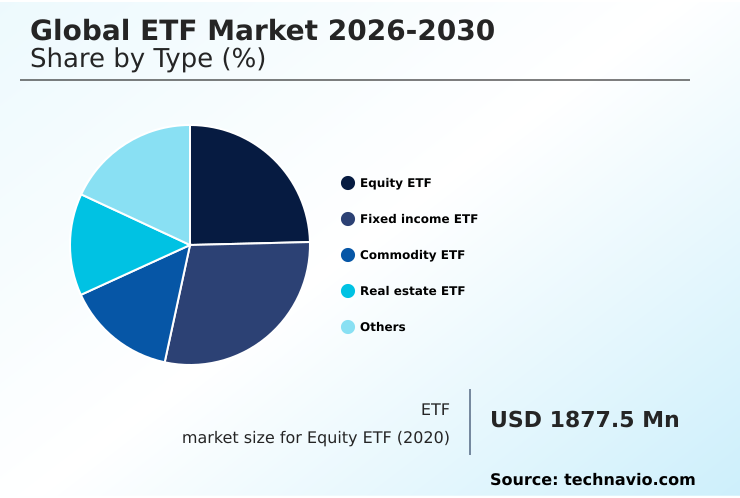
The Equity ETF segment was valued at USD 3.03 billion in 2024 and showed a gradual increase during the forecast period.

Request Free Sample

Regional Analysis

North America is estimated to contribute 45.9% to the growth of the global market during the forecast period.Technavio’s analysts have elaborately explained the regional trends and drivers that shape the market during the forecast period.

See How ETF Market Demand is Rising in North America Request Free Sample

North America continues to be the most developed regional segment, commanding over 45% of the market’s incremental growth, driven by mature capital markets infrastructure and high adoption among institutional investors and pension funds.

The region benefits from a highly liquid system that supports efficient intraday tradability.

Europe is also a significant market, with a projected growth trajectory of 19.4%, fueled by supportive regulations and increasing use of ETFs for strategic asset allocation and hedging strategies.

The APAC region is experiencing rapid expansion as financial advisory services promote portfolio diversification and passive investing.

Key trends include the growth of equity ETF and fixed income ETF products designed to meet local investor demand for accessible and transparent financial instruments.

Market Dynamics

Our researchers analyzed the data with 2025 as the base year, along with the key drivers, trends, and challenges. A holistic analysis of drivers will help companies refine their marketing strategies to gain a competitive advantage.

  • The discourse around the Global ETF Market 2026-2030 often centers on the evolving preferences of its diverse investor base. The role of institutional investors in etf market stability and liquidity cannot be overstated, as they leverage these instruments for large-scale asset allocation and risk management.
  • Simultaneously, an increasing number of individuals are comparing etfs and mutual funds for retail investors, frequently favoring the former due to superior trading convenience and transparency. A critical factor in this decision is the impact of expense ratios on etf performance, as even minor differences in fees can compound significantly over a long-term investment horizon.
  • For those seeking stable returns, using bond etfs for fixed income exposure has become a mainstream strategy, offering a practical alternative to holding individual bonds. Furthermore, the benefits of thematic etfs in portfolio construction are increasingly recognized, allowing investors to align their capital with disruptive trends like clean energy or artificial intelligence.
  • Portfolios that strategically combine low-cost index trackers with targeted thematic funds have demonstrated a more favorable risk-adjusted return profile compared to traditional, less-flexible investment approaches.

What are the key market drivers leading to the rise in the adoption of ETF Industry?

  • High market liquidity, which enables efficient trading and supports price stability, serves as a primary driver augmenting the market’s expansion.

  • High market liquidity remains a primary driver, enabling efficient trade execution and bolstering investor confidence.
  • Digital platforms supporting high-volume security trading have reported a 30% increase in daily transactions, directly benefiting from the narrow bid-ask spread and low tracking error common in major ETFs.
  • This deep liquidity, sustained by market makers and the creation and redemption mechanism, has reduced execution costs by an average of 15% for large institutional trades.
  • The growth in trading is also fueled by the accessibility of diversified financial instruments for retail investors, who now leverage large cap ETFs and small cap ETFs for both long-term investment and tactical asset allocation, further deepening the market's liquidity pool.

What are the market trends shaping the ETF Industry?

  • A significant trend shaping the market is the expanding growth of bond ETFs. These instruments are increasingly adopted by investors seeking diversified, liquid, and cost-efficient fixed-income exposure.

  • Key trends are reshaping investment strategies, with the growth of bond ETFs leading the charge. Adoption of these instruments has surged by 25% among institutional investors seeking liquid and diversified fixed-income exposure without the complexities of direct bond ownership. This trend facilitates more effective management of interest rate and credit risk.
  • Concurrently, there is a notable rise in the use of inflation-indexed securities, with new investment inflows into these products increasing by 15% compared to conventional debt instruments. This shift reflects a strategic move to protect portfolio value against rising inflation.
  • The development of high-yield bond ETFs and emerging market debt funds further expands the toolkit for investors, supporting advanced passive investing and hedging strategies.

What challenges does the ETF Industry face during its growth?

  • A key challenge degrading market growth is the rising incidence of transaction-related fraud, which erodes investor confidence in digital trading platforms.

  • The rise in transaction-related fraud presents a significant challenge, compelling firms to enhance their cybersecurity in trading. Implementing advanced transaction fraud detection systems has increased operational costs by up to 20% for some wealth management firms, impacting their expense ratio.
  • Despite these costs, firms with robust regulatory compliance frameworks report 50% fewer fraudulent attempts, safeguarding both institutional investors and retail investors. This challenge is compounded by the need to protect sensitive data across a complex ecosystem of financial advisory services and digital platforms.
  • The threat undermines trust in the market, making investment in security not just a compliance issue but a critical component for sustaining investment inflows.

Exclusive Technavio Analysis on Customer Landscape

The etf market forecasting report includes the adoption lifecycle of the market, covering from the innovator’s stage to the laggard’s stage. It focuses on adoption rates in different regions based on penetration. Furthermore, the etf market report also includes key purchase criteria and drivers of price sensitivity to help companies evaluate and develop their market growth analysis strategies.

Customer Landscape of ETF Industry

Competitive Landscape

Companies are implementing various strategies, such as strategic alliances, etf market forecast, partnerships, mergers and acquisitions, geographical expansion, and product/service launches, to enhance their presence in the industry.

ARK Investment Management LLC - Provides diversified market exposure through a comprehensive suite of exchange-traded funds, including index-tracking and thematic strategies, designed for liquidity and cost-efficiency.

The industry research and growth report includes detailed analyses of the competitive landscape of the market and information about key companies, including:

  • ARK Investment Management LLC
  • Betashares Capital Ltd
  • First Trust Portfolios L.P.
  • FMR LLC
  • Franklin Templeton
  • Global X Management Co LLC
  • HSBC Holdings Plc
  • Invesco Ltd.
  • Mirae Asset Investment Managers
  • Nuveen LLC
  • ProShare Advisors LLC
  • Rafferty Asset Management LLC
  • Samsung Asset Management
  • Societe Generale SA
  • State Street Corp.
  • The Charles Schwab Corp.
  • The Vanguard Group Inc.
  • Van Eck Associates Corp
  • WisdomTree Inc.

Qualitative and quantitative analysis of companies has been conducted to help clients understand the wider business environment as well as the strengths and weaknesses of key industry players. Data is qualitatively analyzed to categorize companies as pure play, category-focused, industry-focused, and diversified; it is quantitatively analyzed to categorize companies as dominant, leading, strong, tentative, and weak.

Recent Development and News in Etf market

  • In September 2024, ARK Investment Management LLC launched a new thematic ETF focused on genomics and biotechnology, targeting long-term capital appreciation from disruptive innovation.
  • In November 2024, The Vanguard Group Inc. announced a strategic partnership with a major European digital brokerage service to expand the distribution of its low-cost ETF lineup to retail investors.
  • In February 2025, State Street Corp. reported that its SPDR ETF platform surpassed a significant asset milestone, driven by strong investment inflows into its S&P 500 and sector-specific funds.
  • In April 2025, Franklin Templeton received regulatory approval in a key APAC market for a new series of fixed-income ETFs, expanding its product suite for investors seeking stable income.

Dive into Technavio’s robust research methodology, blending expert interviews, extensive data synthesis, and validated models for unparalleled ETF Market insights. See full methodology.

Market Scope
Page number 297
Base year 2025
Historic period 2020-2024
Forecast period 2026-2030
Growth momentum & CAGR Accelerate at a CAGR of 19.2%
Market growth 2026-2030 USD 19301.7 million
Market structure Fragmented
YoY growth 2025-2026(%) 16.1%
Key countries US, Canada, Mexico, Germany, UK, France, The Netherlands, Italy, Spain, China, Japan, India, South Korea, Australia, Indonesia, Brazil, Argentina, Chile, Saudi Arabia, UAE, South Africa, Israel and Turkey
Competitive landscape Leading Companies, Market Positioning of Companies, Competitive Strategies, and Industry Risks

Request Free Sample

Research Analyst Overview

  • The market's evolution is defined by a consistent drive toward greater portfolio diversification and cost reduction. Core instruments like the equity ETF and fixed income ETF are now foundational for modern asset allocation, while the rise of thematic investing and ESG investing reflects a demand for more targeted exposures.
  • From a boardroom perspective, this shift necessitates a strategic pivot in product development, moving beyond simple index tracking to offer sophisticated smart-beta strategies and actively managed ETFs. The creation and redemption mechanism remains a critical pillar of market liquidity, ensuring a tight bid-ask spread and minimal tracking error.
  • For institutional clients, the adoption of factor-based investing has resulted in a demonstrable 15% improvement in portfolio resilience during volatile periods. This is achieved by managing market beta while pursuing alpha through systematic exposure to factors like value and momentum.
  • Consequently, metrics such as total cost of ownership and tax efficiency are paramount, as is the ability to use these vehicles for complex hedging strategies involving both blue-chip corporations and emerging market debt.

What are the Key Data Covered in this ETF Market Research and Growth Report?

  • What is the expected growth of the ETF Market between 2026 and 2030?

    • USD 19.30 billion, at a CAGR of 19.2%

  • What segmentation does the market report cover?

    • The report is segmented by Type (Equity ETF, Fixed income ETF, Commodity ETF, Real estate ETF, and Others), Product Type (Large cap ETFs, Mega cap ETFs, Mid cap ETFs, and Small cap ETFs), Distribution Channel (Institutional investors, Retail investors, and Adviser or wealth manager platforms) and Geography (North America, Europe, APAC, South America, Middle East and Africa)

  • Which regions are analyzed in the report?

    • North America, Europe, APAC, South America and Middle East and Africa

  • What are the key growth drivers and market challenges?

    • High market liquidity is augmenting market growth, Rise in number of transaction frauds is degrading market growth

  • Who are the major players in the ETF Market?

    • ARK Investment Management LLC, Betashares Capital Ltd, First Trust Portfolios L.P., FMR LLC, Franklin Templeton, Global X Management Co LLC, HSBC Holdings Plc, Invesco Ltd., Mirae Asset Investment Managers, Nuveen LLC, ProShare Advisors LLC, Rafferty Asset Management LLC, Samsung Asset Management, Societe Generale SA, State Street Corp., The Charles Schwab Corp., The Vanguard Group Inc., Van Eck Associates Corp and WisdomTree Inc.

Market Research Insights

  • The dynamics of the market are increasingly shaped by the sophisticated needs of institutional investors and the expanding access for retail investors through digital brokerage services. This has led to a surge in diversified investment solutions. For example, wealth management firms utilizing automated portfolio management with ETFs have reported a 20% reduction in operational overhead.
  • Concurrently, the adoption of thematic investment fund products among retail investors on these platforms has grown by over 35%, indicating a clear shift toward targeted market exposure. The competitive landscape compels asset management firms to innovate, with some achieving a 15% faster product-to-market timeline for new ETPs.
  • This environment, supported by a robust capital markets infrastructure, fosters both capital appreciation and long-term portfolio strategies.

We can help! Our analysts can customize this etf market research report to meet your requirements.

Get in touch

1. Executive Summary

1.1 Market overview

Executive Summary - Chart on Market Overview
Executive Summary - Data Table on Market Overview
Executive Summary - Chart on Global Market Characteristics
Executive Summary - Chart on Market by Geography
Executive Summary - Chart on Market Segmentation by Type
Executive Summary - Chart on Market Segmentation by Product Type
Executive Summary - Chart on Market Segmentation by Distribution Channel
Executive Summary - Chart on Incremental Growth
Executive Summary - Data Table on Incremental Growth
Executive Summary - Chart on Company Market Positioning

2. Technavio Analysis

2.1 Analysis of price sensitivity, lifecycle, customer purchase basket, adoption rates, and purchase criteria

2.2 Criticality of inputs and Factors of differentiation

Chart on Overview on criticality of inputs and factors of differentiation

2.3 Factors of disruption

Chart on Overview on factors of disruption

2.4 Impact of drivers and challenges

Chart on Impact of drivers and challenges in 2025 and 2030

3. Market Landscape

3.1 Market ecosystem

Chart on Parent Market
Data Table on - Parent Market

3.2 Market characteristics

Chart on Market characteristics analysis

3.3 Value chain analysis

Chart on Value chain analysis

4. Market Sizing

4.1 Market definition

Data Table on Offerings of companies included in the market definition

4.2 Market segment analysis

Market segments

4.3 Market size 2025

4.4 Market outlook: Forecast for 2025-2030

Chart on Global - Market size and forecast 2025-2030 ($ million)
Data Table on Global - Market size and forecast 2025-2030 ($ million)
Chart on Global Market: Year-over-year growth 2025-2030 (%)
Data Table on Global Market: Year-over-year growth 2025-2030 (%)

5. Historic Market Size

5.1 Global ETF Market 2020 - 2024

Historic Market Size - Data Table on Global ETF Market 2020 - 2024 ($ million)

5.2 Type segment analysis 2020 - 2024

Historic Market Size - Type Segment 2020 - 2024 ($ million)

5.3 Product Type segment analysis 2020 - 2024

Historic Market Size - Product Type Segment 2020 - 2024 ($ million)

5.4 Distribution Channel segment analysis 2020 - 2024

Historic Market Size - Distribution Channel Segment 2020 - 2024 ($ million)

5.5 Geography segment analysis 2020 - 2024

Historic Market Size - Geography Segment 2020 - 2024 ($ million)

5.6 Country segment analysis 2020 - 2024

Historic Market Size - Country Segment 2020 - 2024 ($ million)

6. Qualitative Analysis

6.1 Impact of AI on Global ETF Market

6.2 Impact of Geopolitical Conflicts on Global ETF Market

7. Five Forces Analysis

7.1 Five forces summary

Five forces analysis - Comparison between 2025 and 2030

7.2 Bargaining power of buyers

Bargaining power of buyers - Impact of key factors 2025 and 2030

7.3 Bargaining power of suppliers

Bargaining power of suppliers - Impact of key factors in 2025 and 2030

7.4 Threat of new entrants

Threat of new entrants - Impact of key factors in 2025 and 2030

7.5 Threat of substitutes

Threat of substitutes - Impact of key factors in 2025 and 2030

7.6 Threat of rivalry

Threat of rivalry - Impact of key factors in 2025 and 2030

7.7 Market condition

Chart on Market condition - Five forces 2025 and 2030

8. Market Segmentation by Type

8.1 Market segments

Chart on Type - Market share 2025-2030 (%)
Data Table on Type - Market share 2025-2030 (%)

8.2 Comparison by Type

Chart on Comparison by Type
Data Table on Comparison by Type

8.3 Equity ETF - Market size and forecast 2025-2030

Chart on Equity ETF - Market size and forecast 2025-2030 ($ million)
Data Table on Equity ETF - Market size and forecast 2025-2030 ($ million)
Chart on Equity ETF - Year-over-year growth 2025-2030 (%)
Data Table on Equity ETF - Year-over-year growth 2025-2030 (%)

8.4 Fixed income ETF - Market size and forecast 2025-2030

Chart on Fixed income ETF - Market size and forecast 2025-2030 ($ million)
Data Table on Fixed income ETF - Market size and forecast 2025-2030 ($ million)
Chart on Fixed income ETF - Year-over-year growth 2025-2030 (%)
Data Table on Fixed income ETF - Year-over-year growth 2025-2030 (%)

8.5 Commodity ETF - Market size and forecast 2025-2030

Chart on Commodity ETF - Market size and forecast 2025-2030 ($ million)
Data Table on Commodity ETF - Market size and forecast 2025-2030 ($ million)
Chart on Commodity ETF - Year-over-year growth 2025-2030 (%)
Data Table on Commodity ETF - Year-over-year growth 2025-2030 (%)

8.6 Real estate ETF - Market size and forecast 2025-2030

Chart on Real estate ETF - Market size and forecast 2025-2030 ($ million)
Data Table on Real estate ETF - Market size and forecast 2025-2030 ($ million)
Chart on Real estate ETF - Year-over-year growth 2025-2030 (%)
Data Table on Real estate ETF - Year-over-year growth 2025-2030 (%)

8.7 Others - Market size and forecast 2025-2030

Chart on Others - Market size and forecast 2025-2030 ($ million)
Data Table on Others - Market size and forecast 2025-2030 ($ million)
Chart on Others - Year-over-year growth 2025-2030 (%)
Data Table on Others - Year-over-year growth 2025-2030 (%)

8.8 Market opportunity by Type

Market opportunity by Type ($ million)
Data Table on Market opportunity by Type ($ million)

9. Market Segmentation by Product Type

9.1 Market segments

Chart on Product Type - Market share 2025-2030 (%)
Data Table on Product Type - Market share 2025-2030 (%)

9.2 Comparison by Product Type

Chart on Comparison by Product Type
Data Table on Comparison by Product Type

9.3 Large cap ETFs - Market size and forecast 2025-2030

Chart on Large cap ETFs - Market size and forecast 2025-2030 ($ million)
Data Table on Large cap ETFs - Market size and forecast 2025-2030 ($ million)
Chart on Large cap ETFs - Year-over-year growth 2025-2030 (%)
Data Table on Large cap ETFs - Year-over-year growth 2025-2030 (%)

9.4 Mega cap ETFs - Market size and forecast 2025-2030

Chart on Mega cap ETFs - Market size and forecast 2025-2030 ($ million)
Data Table on Mega cap ETFs - Market size and forecast 2025-2030 ($ million)
Chart on Mega cap ETFs - Year-over-year growth 2025-2030 (%)
Data Table on Mega cap ETFs - Year-over-year growth 2025-2030 (%)

9.5 Mid cap ETFs - Market size and forecast 2025-2030

Chart on Mid cap ETFs - Market size and forecast 2025-2030 ($ million)
Data Table on Mid cap ETFs - Market size and forecast 2025-2030 ($ million)
Chart on Mid cap ETFs - Year-over-year growth 2025-2030 (%)
Data Table on Mid cap ETFs - Year-over-year growth 2025-2030 (%)

9.6 Small cap ETFs - Market size and forecast 2025-2030

Chart on Small cap ETFs - Market size and forecast 2025-2030 ($ million)
Data Table on Small cap ETFs - Market size and forecast 2025-2030 ($ million)
Chart on Small cap ETFs - Year-over-year growth 2025-2030 (%)
Data Table on Small cap ETFs - Year-over-year growth 2025-2030 (%)

9.7 Market opportunity by Product Type

Market opportunity by Product Type ($ million)
Data Table on Market opportunity by Product Type ($ million)

10. Market Segmentation by Distribution Channel

10.1 Market segments

Chart on Distribution Channel - Market share 2025-2030 (%)
Data Table on Distribution Channel - Market share 2025-2030 (%)

10.2 Comparison by Distribution Channel

Chart on Comparison by Distribution Channel
Data Table on Comparison by Distribution Channel

10.3 Institutional investors - Market size and forecast 2025-2030

Chart on Institutional investors - Market size and forecast 2025-2030 ($ million)
Data Table on Institutional investors - Market size and forecast 2025-2030 ($ million)
Chart on Institutional investors - Year-over-year growth 2025-2030 (%)
Data Table on Institutional investors - Year-over-year growth 2025-2030 (%)

10.4 Retail investors - Market size and forecast 2025-2030

Chart on Retail investors - Market size and forecast 2025-2030 ($ million)
Data Table on Retail investors - Market size and forecast 2025-2030 ($ million)
Chart on Retail investors - Year-over-year growth 2025-2030 (%)
Data Table on Retail investors - Year-over-year growth 2025-2030 (%)

10.5 Adviser or wealth manager platforms - Market size and forecast 2025-2030

Chart on Adviser or wealth manager platforms - Market size and forecast 2025-2030 ($ million)
Data Table on Adviser or wealth manager platforms - Market size and forecast 2025-2030 ($ million)
Chart on Adviser or wealth manager platforms - Year-over-year growth 2025-2030 (%)
Data Table on Adviser or wealth manager platforms - Year-over-year growth 2025-2030 (%)

10.6 Market opportunity by Distribution Channel

Market opportunity by Distribution Channel ($ million)
Data Table on Market opportunity by Distribution Channel ($ million)

11. Customer Landscape

11.1 Customer landscape overview

Analysis of price sensitivity, lifecycle, customer purchase basket, adoption rates, and purchase criteria

12. Geographic Landscape

12.1 Geographic segmentation

Chart on Market share by geography 2025-2030 (%)
Data Table on Market share by geography 2025-2030 (%)

12.2 Geographic comparison

Chart on Geographic comparison
Data Table on Geographic comparison

12.3 North America - Market size and forecast 2025-2030

Chart on North America - Market size and forecast 2025-2030 ($ million)
Data Table on North America - Market size and forecast 2025-2030 ($ million)
Chart on North America - Year-over-year growth 2025-2030 (%)
Data Table on North America - Year-over-year growth 2025-2030 (%)
Chart on Regional Comparison - North America
Data Table on Regional Comparison - North America

12.3.1 US - Market size and forecast 2025-2030

Chart on US - Market size and forecast 2025-2030 ($ million)
Data Table on US - Market size and forecast 2025-2030 ($ million)
Chart on US - Year-over-year growth 2025-2030 (%)
Data Table on US - Year-over-year growth 2025-2030 (%)

12.3.2 Canada - Market size and forecast 2025-2030

Chart on Canada - Market size and forecast 2025-2030 ($ million)
Data Table on Canada - Market size and forecast 2025-2030 ($ million)
Chart on Canada - Year-over-year growth 2025-2030 (%)
Data Table on Canada - Year-over-year growth 2025-2030 (%)

12.3.3 Mexico - Market size and forecast 2025-2030

Chart on Mexico - Market size and forecast 2025-2030 ($ million)
Data Table on Mexico - Market size and forecast 2025-2030 ($ million)
Chart on Mexico - Year-over-year growth 2025-2030 (%)
Data Table on Mexico - Year-over-year growth 2025-2030 (%)

12.4 Europe - Market size and forecast 2025-2030

Chart on Europe - Market size and forecast 2025-2030 ($ million)
Data Table on Europe - Market size and forecast 2025-2030 ($ million)
Chart on Europe - Year-over-year growth 2025-2030 (%)
Data Table on Europe - Year-over-year growth 2025-2030 (%)
Chart on Regional Comparison - Europe
Data Table on Regional Comparison - Europe

12.4.1 Germany - Market size and forecast 2025-2030

Chart on Germany - Market size and forecast 2025-2030 ($ million)
Data Table on Germany - Market size and forecast 2025-2030 ($ million)
Chart on Germany - Year-over-year growth 2025-2030 (%)
Data Table on Germany - Year-over-year growth 2025-2030 (%)

12.4.2 UK - Market size and forecast 2025-2030

Chart on UK - Market size and forecast 2025-2030 ($ million)
Data Table on UK - Market size and forecast 2025-2030 ($ million)
Chart on UK - Year-over-year growth 2025-2030 (%)
Data Table on UK - Year-over-year growth 2025-2030 (%)

12.4.3 France - Market size and forecast 2025-2030

Chart on France - Market size and forecast 2025-2030 ($ million)
Data Table on France - Market size and forecast 2025-2030 ($ million)
Chart on France - Year-over-year growth 2025-2030 (%)
Data Table on France - Year-over-year growth 2025-2030 (%)

12.4.4 The Netherlands - Market size and forecast 2025-2030

Chart on The Netherlands - Market size and forecast 2025-2030 ($ million)
Data Table on The Netherlands - Market size and forecast 2025-2030 ($ million)
Chart on The Netherlands - Year-over-year growth 2025-2030 (%)
Data Table on The Netherlands - Year-over-year growth 2025-2030 (%)

12.4.5 Italy - Market size and forecast 2025-2030

Chart on Italy - Market size and forecast 2025-2030 ($ million)
Data Table on Italy - Market size and forecast 2025-2030 ($ million)
Chart on Italy - Year-over-year growth 2025-2030 (%)
Data Table on Italy - Year-over-year growth 2025-2030 (%)

12.4.6 Spain - Market size and forecast 2025-2030

Chart on Spain - Market size and forecast 2025-2030 ($ million)
Data Table on Spain - Market size and forecast 2025-2030 ($ million)
Chart on Spain - Year-over-year growth 2025-2030 (%)
Data Table on Spain - Year-over-year growth 2025-2030 (%)

12.5 APAC - Market size and forecast 2025-2030

Chart on APAC - Market size and forecast 2025-2030 ($ million)
Data Table on APAC - Market size and forecast 2025-2030 ($ million)
Chart on APAC - Year-over-year growth 2025-2030 (%)
Data Table on APAC - Year-over-year growth 2025-2030 (%)
Chart on Regional Comparison - APAC
Data Table on Regional Comparison - APAC

12.5.1 China - Market size and forecast 2025-2030

Chart on China - Market size and forecast 2025-2030 ($ million)
Data Table on China - Market size and forecast 2025-2030 ($ million)
Chart on China - Year-over-year growth 2025-2030 (%)
Data Table on China - Year-over-year growth 2025-2030 (%)

12.5.2 Japan - Market size and forecast 2025-2030

Chart on Japan - Market size and forecast 2025-2030 ($ million)
Data Table on Japan - Market size and forecast 2025-2030 ($ million)
Chart on Japan - Year-over-year growth 2025-2030 (%)
Data Table on Japan - Year-over-year growth 2025-2030 (%)

12.5.3 India - Market size and forecast 2025-2030

Chart on India - Market size and forecast 2025-2030 ($ million)
Data Table on India - Market size and forecast 2025-2030 ($ million)
Chart on India - Year-over-year growth 2025-2030 (%)
Data Table on India - Year-over-year growth 2025-2030 (%)

12.5.4 South Korea - Market size and forecast 2025-2030

Chart on South Korea - Market size and forecast 2025-2030 ($ million)
Data Table on South Korea - Market size and forecast 2025-2030 ($ million)
Chart on South Korea - Year-over-year growth 2025-2030 (%)
Data Table on South Korea - Year-over-year growth 2025-2030 (%)

12.5.5 Australia - Market size and forecast 2025-2030

Chart on Australia - Market size and forecast 2025-2030 ($ million)
Data Table on Australia - Market size and forecast 2025-2030 ($ million)
Chart on Australia - Year-over-year growth 2025-2030 (%)
Data Table on Australia - Year-over-year growth 2025-2030 (%)

12.5.6 Indonesia - Market size and forecast 2025-2030

Chart on Indonesia - Market size and forecast 2025-2030 ($ million)
Data Table on Indonesia - Market size and forecast 2025-2030 ($ million)
Chart on Indonesia - Year-over-year growth 2025-2030 (%)
Data Table on Indonesia - Year-over-year growth 2025-2030 (%)

12.6 South America - Market size and forecast 2025-2030

Chart on South America - Market size and forecast 2025-2030 ($ million)
Data Table on South America - Market size and forecast 2025-2030 ($ million)
Chart on South America - Year-over-year growth 2025-2030 (%)
Data Table on South America - Year-over-year growth 2025-2030 (%)
Chart on Regional Comparison - South America
Data Table on Regional Comparison - South America

12.6.1 Brazil - Market size and forecast 2025-2030

Chart on Brazil - Market size and forecast 2025-2030 ($ million)
Data Table on Brazil - Market size and forecast 2025-2030 ($ million)
Chart on Brazil - Year-over-year growth 2025-2030 (%)
Data Table on Brazil - Year-over-year growth 2025-2030 (%)

12.6.2 Argentina - Market size and forecast 2025-2030

Chart on Argentina - Market size and forecast 2025-2030 ($ million)
Data Table on Argentina - Market size and forecast 2025-2030 ($ million)
Chart on Argentina - Year-over-year growth 2025-2030 (%)
Data Table on Argentina - Year-over-year growth 2025-2030 (%)

12.6.3 Chile - Market size and forecast 2025-2030

Chart on Chile - Market size and forecast 2025-2030 ($ million)
Data Table on Chile - Market size and forecast 2025-2030 ($ million)
Chart on Chile - Year-over-year growth 2025-2030 (%)
Data Table on Chile - Year-over-year growth 2025-2030 (%)

12.7 Middle East and Africa - Market size and forecast 2025-2030

Chart on Middle East and Africa - Market size and forecast 2025-2030 ($ million)
Data Table on Middle East and Africa - Market size and forecast 2025-2030 ($ million)
Chart on Middle East and Africa - Year-over-year growth 2025-2030 (%)
Data Table on Middle East and Africa - Year-over-year growth 2025-2030 (%)
Chart on Regional Comparison - Middle East and Africa
Data Table on Regional Comparison - Middle East and Africa

12.7.1 Saudi Arabia - Market size and forecast 2025-2030

Chart on Saudi Arabia - Market size and forecast 2025-2030 ($ million)
Data Table on Saudi Arabia - Market size and forecast 2025-2030 ($ million)
Chart on Saudi Arabia - Year-over-year growth 2025-2030 (%)
Data Table on Saudi Arabia - Year-over-year growth 2025-2030 (%)

12.7.2 UAE - Market size and forecast 2025-2030

Chart on UAE - Market size and forecast 2025-2030 ($ million)
Data Table on UAE - Market size and forecast 2025-2030 ($ million)
Chart on UAE - Year-over-year growth 2025-2030 (%)
Data Table on UAE - Year-over-year growth 2025-2030 (%)

12.7.3 South Africa - Market size and forecast 2025-2030

Chart on South Africa - Market size and forecast 2025-2030 ($ million)
Data Table on South Africa - Market size and forecast 2025-2030 ($ million)
Chart on South Africa - Year-over-year growth 2025-2030 (%)
Data Table on South Africa - Year-over-year growth 2025-2030 (%)

12.7.4 Israel - Market size and forecast 2025-2030

Chart on Israel - Market size and forecast 2025-2030 ($ million)
Data Table on Israel - Market size and forecast 2025-2030 ($ million)
Chart on Israel - Year-over-year growth 2025-2030 (%)
Data Table on Israel - Year-over-year growth 2025-2030 (%)

12.7.5 Turkey - Market size and forecast 2025-2030

Chart on Turkey - Market size and forecast 2025-2030 ($ million)
Data Table on Turkey - Market size and forecast 2025-2030 ($ million)
Chart on Turkey - Year-over-year growth 2025-2030 (%)
Data Table on Turkey - Year-over-year growth 2025-2030 (%)

12.8 Market opportunity by geography

Market opportunity by geography ($ million)
Data Tables on Market opportunity by geography ($ million)

13. Drivers, Challenges, and Opportunity

13.1 Market drivers

High market liquidity is augmenting market growth
Regular income with fixed ETF
Growth in security trading

13.2 Market challenges

Rise in number of transaction frauds is degrading market growth
Fluctuations in interest rate and principal amount
Stringent regulatory compliance imposed by government

13.3 Impact of drivers and challenges

Impact of drivers and challenges in 2025 and 2030

13.4 Market opportunities

Growth of bond ETFs
Increasing adoption of inflation-indexed securities
High demand for market transparency during trading

14. Competitive Landscape

14.1 Overview

14.2

Overview on criticality of inputs and factors of differentiation

14.3 Landscape disruption

Overview on factors of disruption

14.4 Industry risks

Impact of key risks on business

15. Competitive Analysis

15.1 Companies profiled

Companies covered

15.2 Company ranking index

15.3 Market positioning of companies

Matrix on companies position and classification

15.4 First Trust Portfolios L.P.

First Trust Portfolios L.P. - Overview
First Trust Portfolios L.P. - Product / Service
First Trust Portfolios L.P. - Key offerings
SWOT

15.5 FMR LLC

FMR LLC - Overview
FMR LLC - Product / Service
FMR LLC - Key offerings
SWOT

15.6 Franklin Templeton

Franklin Templeton - Overview
Franklin Templeton - Product / Service
Franklin Templeton - Key offerings
SWOT

15.7 HSBC Holdings Plc

HSBC Holdings Plc - Overview
HSBC Holdings Plc - Business segments
HSBC Holdings Plc - Key offerings
HSBC Holdings Plc - Segment focus
SWOT

15.8 Invesco Ltd.

Invesco Ltd. - Overview
Invesco Ltd. - Product / Service
Invesco Ltd. - Key offerings
SWOT

15.9 Mirae Asset Investment Managers

Mirae Asset Investment Managers - Overview
Mirae Asset Investment Managers - Product / Service
Mirae Asset Investment Managers - Key offerings
SWOT

15.10 Nuveen LLC

Nuveen LLC - Overview
Nuveen LLC - Product / Service
Nuveen LLC - Key offerings
SWOT

15.11 ProShare Advisors LLC

ProShare Advisors LLC - Overview
ProShare Advisors LLC - Product / Service
ProShare Advisors LLC - Key offerings
SWOT

15.12 Rafferty Asset Management LLC

Rafferty Asset Management LLC - Overview
Rafferty Asset Management LLC - Product / Service
Rafferty Asset Management LLC - Key offerings
SWOT

15.13 Samsung Asset Management

Samsung Asset Management - Overview
Samsung Asset Management - Product / Service
Samsung Asset Management - Key offerings
SWOT

15.14 Societe Generale SA

Societe Generale SA - Overview
Societe Generale SA - Business segments
Societe Generale SA - Key offerings
Societe Generale SA - Segment focus
SWOT

15.15 State Street Corp.

State Street Corp. - Overview
State Street Corp. - Business segments
State Street Corp. - Key offerings
State Street Corp. - Segment focus
SWOT

15.16 The Charles Schwab Corp.

The Charles Schwab Corp. - Overview
The Charles Schwab Corp. - Business segments
The Charles Schwab Corp. - Key offerings
The Charles Schwab Corp. - Segment focus
SWOT

15.17 The Vanguard Group Inc.

The Vanguard Group Inc. - Overview
The Vanguard Group Inc. - Product / Service
The Vanguard Group Inc. - Key offerings
SWOT

15.18 WisdomTree Inc.

WisdomTree Inc. - Overview
WisdomTree Inc. - Product / Service
WisdomTree Inc. - Key offerings
SWOT

16. Appendix

16.1 Scope of the report

Market definition
Objectives
Notes and caveats

16.2 Inclusions and exclusions checklist

Inclusions checklist
Exclusions checklist

16.3 Currency conversion rates for US$

16.4 Research methodology

16.5 Data procurement

Information sources

16.6 Data validation

16.7 Validation techniques employed for market sizing

16.8 Data synthesis

16.9 360 degree market analysis

16.10 List of abbreviations

Research Methodology

Technavio presents a detailed picture of the market by way of study, synthesis, and summation of data from multiple sources. The analysts have presented the various facets of the market with a particular focus on identifying the key industry influencers. The data thus presented is comprehensive, reliable, and the result of extensive research, both primary and secondary.

INFORMATION SOURCES

Primary sources

  • Manufacturers and suppliers
  • Channel partners
  • Industry experts
  • Strategic decision makers

Secondary sources

  • Industry journals and periodicals
  • Government data
  • Financial reports of key industry players
  • Historical data
  • Press releases

DATA ANALYSIS

Data Synthesis

  • Collation of data
  • Estimation of key figures
  • Analysis of derived insights

Data Validation

  • Triangulation with data models
  • Reference against proprietary databases
  • Corroboration with industry experts

REPORT WRITING

Qualitative

  • Market drivers
  • Market challenges
  • Market trends
  • Five forces analysis

Quantitative

  • Market size and forecast
  • Market segmentation
  • Geographical insights
  • Competitive landscape

Interested in this report?

Get your sample now to see our research methodology and insights!

Download Now

Frequently Asked Questions

ETF market growth will increase by USD 19301.7 million during 2026-2030.

The ETF market is expected to grow at a CAGR of 19.2% during 2026-2030.

ETF market is segmented by Type (Equity ETF, Fixed income ETF, Commodity ETF, Real estate ETF, Others) Product type (Large cap ETFs, Mega cap ETFs, Mid cap ETFs, Small cap ETFs) Distribution channel (Institutional investors, Retail investors, Adviser or wealth manager platforms)

ARK Investment Management LLC, Betashares Capital Ltd, First Trust Portfolios L.P., FMR LLC, Franklin Templeton, Global X Management Co LLC, HSBC Holdings Plc, Invesco Ltd., Mirae Asset Investment Managers, Nuveen LLC, ProShare Advisors LLC, Rafferty Asset Management LLC, Samsung Asset Management, Societe Generale SA, State Street Corp., The Charles Schwab Corp., The Vanguard Group Inc., Van Eck Associates Corp, WisdomTree Inc. are a few of the key vendors in the ETF market.

North America will register the highest growth rate of 45.9% among the other regions. Therefore, the ETF market in North America is expected to garner significant business opportunities for the vendors during the forecast period.

US, Canada, Mexico, Germany, UK, France, The Netherlands, Italy, Spain, China, Japan, India, South Korea, Australia, Indonesia, Brazil, Argentina, Chile, Saudi Arabia, UAE, South Africa, Israel, Turkey

  • High market liquidity is augmenting market growth is the driving factor this market.

The ETF market vendors should focus on grabbing business opportunities from the Type segment as it accounted for the largest market share in the base year.
RIA - Research AI Assistant
Ask RIA