Mutual Funds Market Size 2025-2029
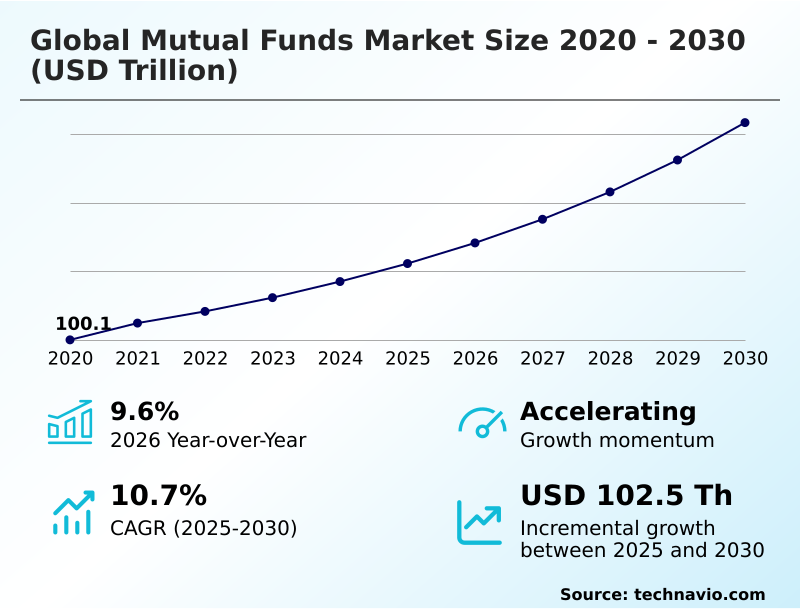
The mutual funds market size is valued to increase USD 85.5 trillion, at a CAGR of 9.9% from 2024 to 2029. Market liquidity will drive the mutual funds market.
Major Market Trends & Insights
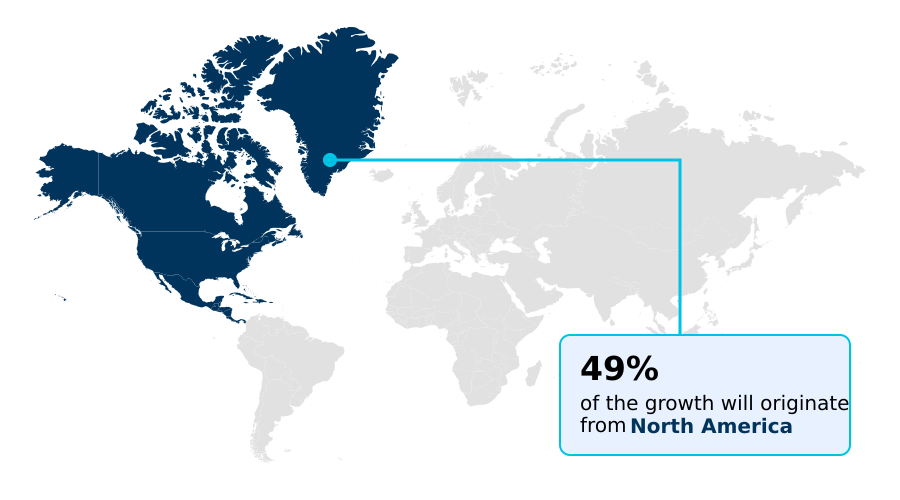
	- North America dominated the market and accounted for a 52% growth during the forecast period.
 
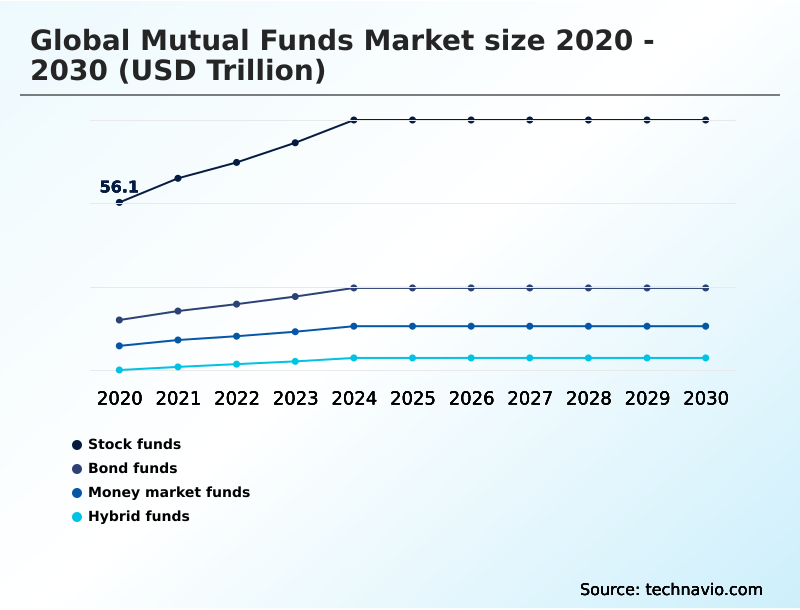
	- By Type - Stock funds segment was valued at USD 50.80 trillion in 2023
 
	- By Distribution Channel - Advice channel segment accounted for the largest market revenue share in 2023
 
Market Size & Forecast
	- Market Opportunities: USD 151.38 trillion
 
	- Market Future Opportunities: USD 85.50 trillion
 
	- CAGR : 9.9%
 
	- North America: Largest market in 2023
 
Market Summary
	- The market represents a dynamic and ever-evolving financial landscape, characterized by continuous growth and innovation. With core technologies such as artificial intelligence and machine learning increasingly shaping investment strategies, mutual funds have become a preferred choice for individual and institutional investors alike. According to recent reports, mutual fund assets under management globally reached an impressive 61.8 trillion USD as of 2021, underscoring the market's substantial size and influence. However, the market is not without challenges. Transaction risks, regulatory compliance, and competition from alternative investment vehicles remain significant hurdles.
 
	- Despite these challenges, opportunities abound, particularly in developing nations where mutual fund adoption rates have been on the rise. For instance, mutual fund assets in Asia Pacific grew by 15.3% in 2020, outpacing the global average. As market liquidity continues to improve and regulatory frameworks evolve, the market is poised for further expansion and transformation.
 
What will be the Size of the Mutual Funds Market during the forecast period?

Get Key Insights on Market Forecast (PDF) Request Free Sample
How is the Mutual Funds Market Segmented and what are the key trends of market segmentation?
The mutual funds industry research report provides comprehensive data (region-wise segment analysis), with forecasts and estimates in "USD trillion" for the period 2025-2029, as well as historical data from 2019-2023 for the following segments.
	- Type
	
		- Stock funds
 
		- Bond funds
 
		- Money market funds
 
		- Hybrid funds


	- Distribution Channel
	
		- Advice channel
 
		- Retirement plan channel
 
		- Institutional channel
 
		- Direct channel
 
		- Supermarket channel


	- Geography
	
		- North America


		- Europe
		
			- France
 
			- Germany
 
			- Italy
 
			- Spain
 
			- UK


		- APAC


		- Rest of World (ROW)


By Type Insights
The stock funds segment is estimated to witness significant growth during the forecast period.
Mutual funds, specifically those investing in stocks, constitute a significant segment of the financial market. These funds exhibit diverse characteristics, catering to various investor preferences. For instance, growth funds prioritize stocks with high growth potential, while income funds focus on securities yielding regular dividends. Index funds mirror a specific market index, such as the S&P 500, and sector funds zero in on a particular industry sector. Share classes within mutual funds differ based on the share of investment. For example, large-cap funds allocate a minimum of 80% of their assets to large-cap companies, which represent the top 100 firms in terms of market capitalization.
Investors can opt for dividend reinvestment plans, enabling them to reinvest their dividends to maximize returns. Tax-efficient investing strategies, such as tax-loss harvesting, help minimize tax liabilities. Bond fund yields and currency exchange risk are essential considerations for investors in bond funds. Risk management strategies, including diversification and asset allocation models, play a crucial role in mitigating potential losses. Fund manager expertise and regulatory compliance frameworks are essential factors for investors. Hedge fund strategies, financial statement audits, actively managed funds, and passive investment strategies all contribute to the evolving mutual fund landscape. Expense ratios, asset allocation models, capital gains distributions, and portfolio rebalancing techniques are essential metrics for evaluating mutual fund performance.
Inflation-adjusted returns and equity fund volatility are crucial for long-term investment planning. Alternative investment funds and exchange-traded funds (ETFs) offer additional investment opportunities, with global diversification benefits and passive investment strategies gaining popularity. Nav calculation methods and passive investment strategies further broaden the scope of mutual fund investments. According to recent studies, stock mutual fund adoption stands at 35%, with expectations of a 21% increase in industry participation over the next five years. Meanwhile, the bond fund sector anticipates a 17% expansion in the same timeframe. These figures underscore the ongoing growth and evolution of the mutual fund market.

Request Free Sample
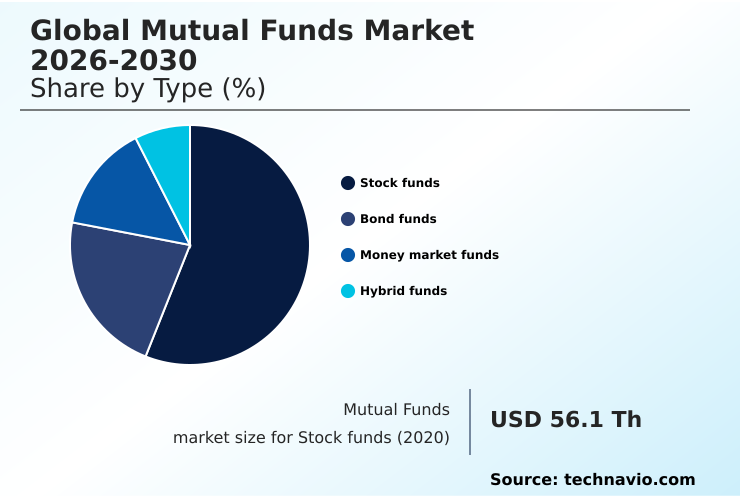
The Stock funds segment was valued at USD 50.80 trillion in 2019 and showed a gradual increase during the forecast period.

Request Free Sample
Regional Analysis
North America is estimated to contribute 52% to the growth of the global market during the forecast period.Technavio's analysts have elaborately explained the regional trends and drivers that shape the market during the forecast period.

See How Mutual Funds Market Demand is Rising in North America Request Free Sample
The market in North America holds a substantial market share in 2023, driven by persistent trading activities and the dominance of the US equity market. With over 40% of the global equity market share as of August 2021, the US offers investors tax efficiency, transparency, and access to centralized stock exchange platforms. Given the cost-conscious nature of most investors, mutual funds have become an attractive investment option due to their elimination of brokerage commissions.
Market Dynamics
Our researchers analyzed the data with 2024 as the base year, along with the key drivers, trends, and challenges. A holistic analysis of drivers will help companies refine their marketing strategies to gain a competitive advantage.
The market encompasses a diverse range of investment vehicles that cater to various investor profiles and risk appetites. This market is characterized by a multitude of fund categories, each with distinct investment strategies and expense ratios. Comparing fund expense ratios across categories is crucial for investors, as they can significantly impact returns over the long term. Market volatility plays a pivotal role in shaping fund performance. The correlation between different asset classes during volatile periods can influence portfolio diversification and risk management strategies. Efficient frontier portfolio optimization is a popular approach to balancing risk and return, ensuring optimal asset allocation for different investor profiles.
Fund manager tenure and performance correlation is another essential consideration. Long-term performance can be influenced by a manager's investment philosophy, experience, and ability to adapt to market conditions. Conversely, fund size and returns exhibit a relationship, with larger funds often facing challenges in maintaining agility and generating outsized returns. Different types of investment strategies, such as active and passive, offer unique advantages and disadvantages. Active management fees are typically higher than passive funds, but they may provide opportunities for superior returns through individual security selection. Tax implications of mutual fund investments are also essential, as they can impact overall returns and investor experience.
Measuring fund risk-adjusted performance is vital for assessing the value of investment options. This assessment involves comparing returns to the associated risks, providing a more comprehensive evaluation of fund performance. Determining optimal asset allocation for different investors requires a deep understanding of their financial goals, risk tolerance, and investment horizon. Evaluating a fund manager's investment philosophy is crucial in selecting suitable investment options. Regulatory compliance plays a significant role in ensuring fair business practices and investor protection. Prospectus transparency is essential, as it allows investors to make informed decisions based on accurate and complete information. Calculating net asset value per share (NAV) and its implications is a fundamental aspect of mutual fund investing.
Understanding the types of fund share classes and related costs, such as load fees, is crucial in optimizing investment returns. Comparing returns for different fund share classes can provide valuable insights into the impact of fees on overall performance. The market is dynamic, with ongoing developments in investment strategies, regulatory requirements, and investor preferences. Understanding these trends and their implications is essential for investors seeking to maximize returns and minimize risks. For instance, the adoption of alternative investment strategies, such as exchange-traded funds (ETFs) and index funds, has gained significant traction in recent years, offering unique benefits and challenges for investors.
(Comparison: Approximately 60% of new investment flows in the market are directed towards passive investment vehicles, while active funds account for the remaining 40%.)

What are the key market drivers leading to the rise in the adoption of Mutual Funds Industry?
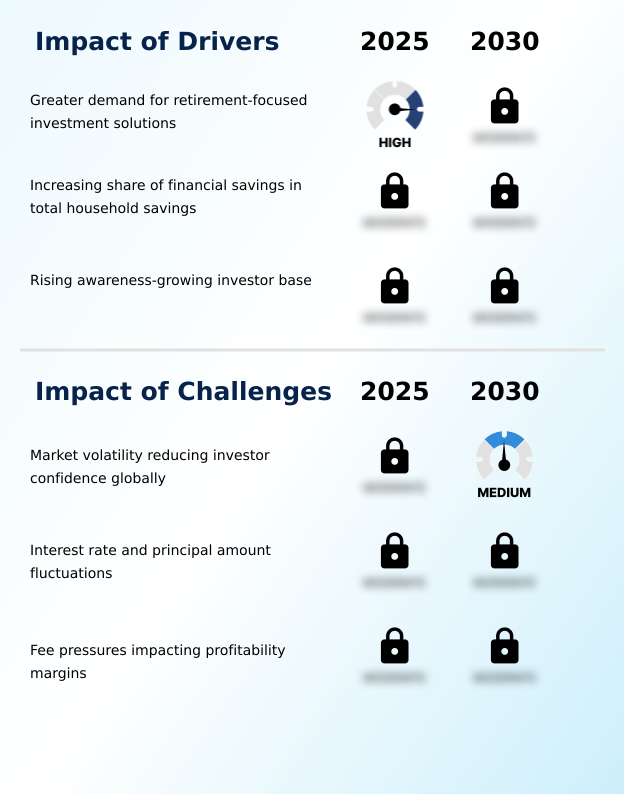
	- Market liquidity plays a pivotal role in driving market functionality and efficiency by facilitating the buying and selling of securities in a timely and orderly manner. 
 
	- Liquidity is a crucial factor in financial markets, particularly in the context of mutual funds. Mutual funds, as collectively managed investment vehicles, offer investors the advantage of high liquidity due to their large trading volumes and diverse investment compositions. The mutual fund market encompasses various capital markets, with large-cap investments leading in liquidity. Moreover, mutual funds provide investors with an extensive selection of asset classes, primarily equities and fixed income, which are inherently liquid. Mutual fund liquidity offers several benefits to investors.
 
	- Firstly, it enables easy switching between funds, providing flexibility to adjust investment portfolios based on market conditions. Secondly, it allows investors to withdraw their funds during market volatility without significantly impacting the price. This liquidity is a significant advantage for mutual fund investors, making them an attractive investment option in the financial market landscape.
 
What are the market trends shaping the Mutual Funds Industry?
	- In developing nations, the trend indicates a significant growth in mutual fund assets. This upward trend is a notable market development.
 
	- The mutual fund (MF) sector has experienced significant growth due to the thriving equity markets and inflows to equity schemes in developing economies. For instance, the average assets under management (AAUM) in India reached USD0.48 trillion for the December 2021 quarter, marking a notable increase of nearly 30% compared to the previous year. Moreover, individual investor assets held by mutual funds surged from USD0.23 trillion in February 2021 to USD0.28 trillion in February 2022, signifying a rise of 22.32%.
 
	- Institutional assets also expanded by 16.08%, from USD0.20 trillion to USD0.23 trillion, during the same period. This trend underscores the continuous expansion and dynamic nature of the mutual fund sector, as it adapts to evolving market conditions and investor preferences.
 
What challenges does the Mutual Funds Industry face during its growth?
	- Transaction risks pose a significant challenge to the industry's growth. In order to mitigate these risks and ensure business continuity, it is essential for organizations to implement robust risk management strategies and adhere to regulatory compliance. This includes the use of secure payment systems, fraud detection tools, and data encryption techniques. By addressing transaction risks effectively, businesses can foster trust with their customers and stakeholders, ultimately contributing to sustainable industry growth. 
 
	- Transaction risks refer to the uncertainties corporations face when engaging in financial dealings across different currencies. For instance, a Canadian company operating in China encounters foreign exchange risks due to transactions conducted in Chinese yuan and reporting in Canadian dollars. These risks materialize when currency exchange rates fluctuate between the initiation and completion of a financial transaction. The time gap between a transaction and its settlement is the primary cause of such risks.
 
	- The magnitude of these risks can significantly impact a corporation's financial performance, necessitating the need for effective risk management strategies. Currency exchange rates are subject to continuous change due to various economic factors, making it essential for businesses to stay informed and adapt accordingly.
 
Exclusive Technavio Analysis on Customer Landscape
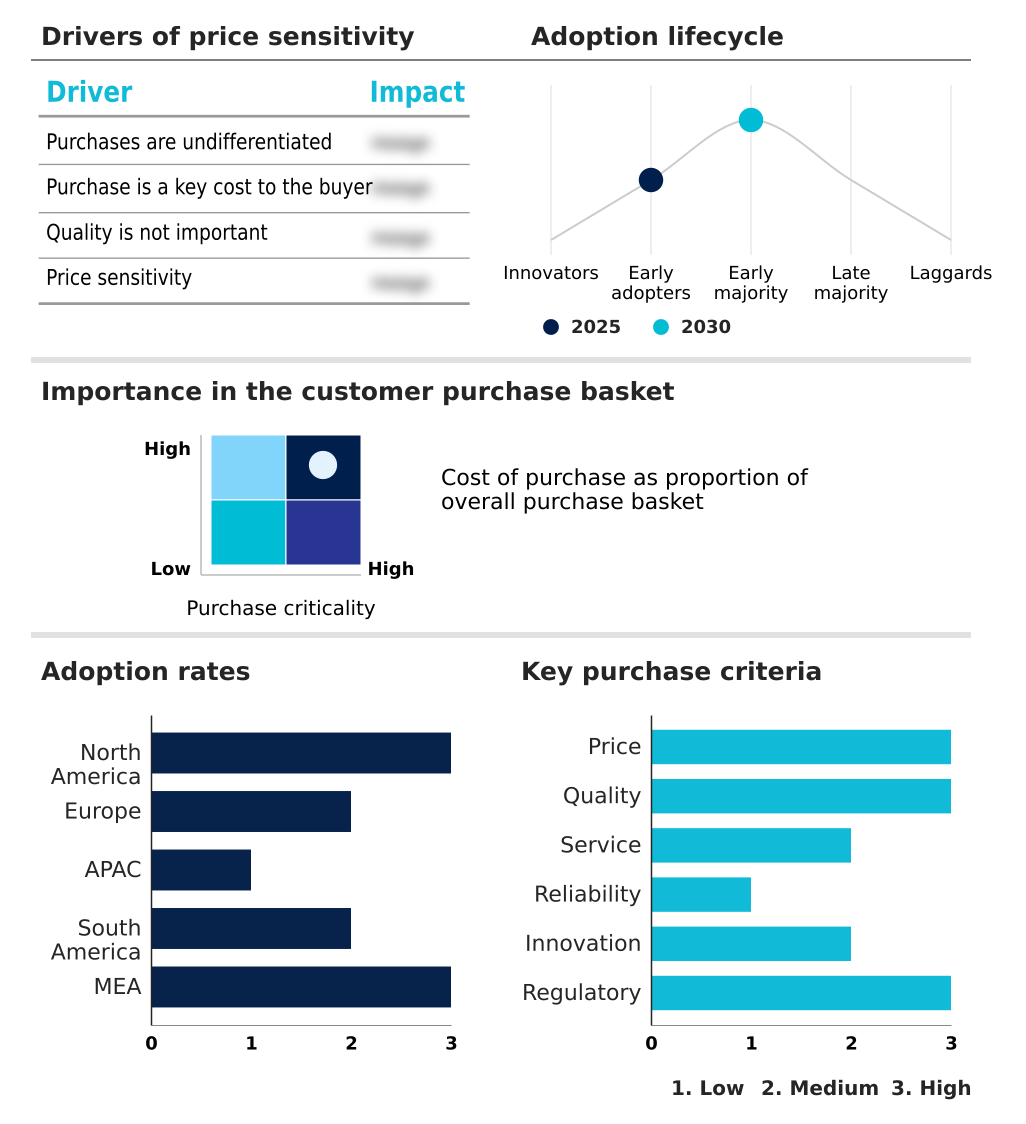
The mutual funds market forecasting report includes the adoption lifecycle of the market, covering from the innovator's stage to the laggard's stage. It focuses on adoption rates in different regions based on penetration. Furthermore, the mutual funds market report also includes key purchase criteria and drivers of price sensitivity to help companies evaluate and develop their market growth analysis strategies.

 Customer Landscape of Mutual Funds Industry
Competitive Landscape
Companies are implementing various strategies, such as strategic alliances, mutual funds market forecast, partnerships, mergers and acquisitions, geographical expansion, and product/service launches, to enhance their presence in the industry.
Aditya Birla Management Corp. Pvt. Ltd. - This company specializes in mutual funds, providing investors with tax savings opportunities and access to the SGX Nifty index. Through these funds, investors can diversify their portfolios and potentially maximize returns. The company's offerings cater to various investment strategies, allowing clients to save for future financial goals.
The industry research and growth report includes detailed analyses of the competitive landscape of the market and information about key companies, including:
	- Aditya Birla Management Corp. Pvt. Ltd.
 
	- Amundi Austria GmbH
 
	- Axis Asset Management Co. Ltd.
 
	- Baroda BNP Paribas Asset Management India Pvt. Ltd.
 
	- BlackRock Inc.
 
	- Canara Robeco Asset Management Co.
 
	- Edelweiss Asset Management Ltd
 
	- FMR LLC
 
	- Franklin Templeton
 
	- GLP Pte Ltd.
 
	- HDFC Ltd.
 
	- ICICI Prudential Asset Management Co. Ltd.
 
	- IDFC Mutual Fund
 
	- JPMorgan Chase and Co.
 
	- PIMCO
 
	- State Street Global Advisors
 
	- The Bank of New York Mellon Corp.
 
	- The Capital Group Companies Inc.
 
	- The Charles Schwab Corp.
 
	- The Vanguard Group Inc.
 
Qualitative and quantitative analysis of companies has been conducted to help clients understand the wider business environment as well as the strengths and weaknesses of key industry players. Data is qualitatively analyzed to categorize companies as pure play, category-focused, industry-focused, and diversified; it is quantitatively analyzed to categorize companies as dominant, leading, strong, tentative, and weak.
Recent Development and News in Mutual Funds Market
	- In January 2024, Vanguard Group, the world's second-largest mutual fund manager, announced the launch of its first actively managed cryptocurrency fund, marking a significant entry of traditional asset managers into the digital asset space (Vanguard Press Release). In March 2024, BlackRock, the largest asset manager, formed a strategic partnership with iShares MSCI to launch a series of sustainable mutual funds, reflecting growing investor demand for environmentally responsible investment options (BlackRock Press Release).
 
	- In April 2025, Fidelity Investments, the fourth-largest mutual fund manager, completed the acquisition of Institutional Shareholder Services (ISS), a leading provider of corporate governance and responsible investment research, expanding Fidelity's capabilities in the ESG (Environmental, Social, and Governance) investing sector (Fidelity Press Release). In May 2025, the Securities and Exchange Commission (SEC) approved the first Bitcoin-linked exchange-traded fund (ETF) by ProShares, paving the way for more institutional investment in digital assets through mutual funds and ETFs (SEC Press Release).
 
Dive into Technavio's robust research methodology, blending expert interviews, extensive data synthesis, and validated models for unparalleled Mutual Funds Market insights. See full methodology.
	
		
			| 
			 Market Scope 
			 | 
		
		
			| 
			 Report Coverage 
			 | 
			
			 Details 
			 | 
		
		
			| 
			 Page number 
			 | 
			
			 193 
			 | 
		
		
			| 
			 Base year 
			 | 
			
			 2024 
			 | 
		
		
			| 
			 Historic period 
			 | 
			2019-2023 | 
		
		
			| 
			 Forecast period 
			 | 
			
			 2025-2029 
			 | 
		
		
			| 
			 Growth momentum & CAGR 
			 | 
			
			 Accelerate at a CAGR of 9.9% 
			 | 
		
		
			| 
			 Market growth 2025-2029 
			 | 
			
			 USD 85.5 trillion 
			 | 
		
		
			| 
			 Market structure 
			 | 
			
			 Fragmented 
			 | 
		
		
			| 
			 YoY growth 2024-2025(%) 
			 | 
			
			 9.2 
			 | 
		
		
			| 
			 Key countries 
			 | 
			
			 US, China, Germany, France, Australia, Canada, UK, Italy, Spain, and India 
			 | 
		
		
			| 
			 Competitive landscape 
			 | 
			
			 Leading Companies, Market Positioning of Companies, Competitive Strategies, and Industry Risks 
			 | 
		
	
Request Free Sample
Research Analyst Overview
	- In the dynamic and intricate realm of mutual funds, various factors continually shape market activities and evolving patterns. Commodity funds, for instance, have experienced fluctuating performance due to the volatile nature of commodity markets. Share classes, with their distinct fee structures and features, have gained increasing attention from investors. Dividend reinvestment plans have become popular tools for enhancing returns, while sector-specific funds cater to investors seeking specialized exposure. Tax-efficient investing strategies have emerged as crucial considerations for minimizing tax liabilities. Bond fund yields have witnessed shifts, impacting investor decisions. Currency exchange risk and load fees are essential factors influencing mutual fund investments.
 
	- Risk management strategies, including those employing fund manager expertise, are vital in navigating market uncertainties. Regulatory compliance frameworks shape the industry landscape, with SEC regulations being a significant influence. Hedge fund strategies and financial statement audits add complexity to the mutual fund market. Actively managed funds contrast with passive investment strategies, with expense ratios comparison being a key differentiator. Asset allocation models, capital gains distributions, and portfolio rebalancing techniques are essential elements of effective investment management. Investment return metrics, alternative investment funds, and exchange-traded funds (ETFs) offer diverse investment opportunities. Global diversification benefits and inflation-adjusted returns are essential for long-term wealth creation.
 
	- Nav calculation methods and passive investment strategies further expand the investment universe. Equity fund volatility and fund performance benchmarks serve as important indicators of investment risk and potential returns. Despite these complexities, mutual funds remain a popular investment vehicle, offering investors a wide range of choices and opportunities.
 
What are the Key Data Covered in this Mutual Funds Market Research and Growth Report?
	- 
	
What is the expected growth of the Mutual Funds Market between 2025 and 2029?
	
	 
	- 
	
What segmentation does the market report cover?
	
		- 
		
The report segmented by Type (Stock funds, Bond funds, Money market funds, and Hybrid funds), Distribution Channel (Advice channel, Retirement plan channel, Institutional channel, Direct channel, and Supermarket channel), and Geography (North America, Europe, APAC, South America, and Middle East and Africa)


	- 
	
Which regions are analyzed in the report?
	
		- 
		
North America, Europe, APAC, South America, and Middle East and Africa


	- 
	
What are the key growth drivers and market challenges?
	
	 
	- 
	
Who are the major players in the Mutual Funds Market?
	
		- 
		
Key Companies Aditya Birla Management Corp. Pvt. Ltd., Amundi Austria GmbH, Axis Asset Management Co. Ltd., Baroda BNP Paribas Asset Management India Pvt. Ltd., BlackRock Inc., Canara Robeco Asset Management Co., Edelweiss Asset Management Ltd, FMR LLC, Franklin Templeton, GLP Pte Ltd., HDFC Ltd., ICICI Prudential Asset Management Co. Ltd., IDFC Mutual Fund, JPMorgan Chase and Co., PIMCO, State Street Global Advisors, The Bank of New York Mellon Corp., The Capital Group Companies Inc., The Charles Schwab Corp., and The Vanguard Group Inc.


Market Research Insights
	- The market encompasses a diverse range of investment vehicles, including those employing ESG investing factors and debt fund strategies. According to recent estimates, assets under management in ESG mutual funds surpassed USD1 trillion in 2021, representing a significant growth from USD500 billion in 2018. In contrast, the average portfolio turnover rate for debt mutual funds hovers around 30%, indicating a more passive investment approach. Fund liquidity assessment plays a crucial role in the mutual fund landscape, with risk tolerance questionnaires helping investors determine their suitability for various investment vehicles. Beta measurement methods provide insights into a fund's volatility relative to the market, while ethical investing principles guide funds that prioritize socially responsible investments.
 
	- The Sharpe ratio calculation and information ratio are essential performance metrics, offering insights into risk-adjusted returns. Investors seeking capital preservation can explore principal protection funds, while those focused on income generation may consider tax loss harvesting and income-generating investments. Dollar cost averaging is a popular investment strategy for managing risk and optimizing long-term returns. Private equity funds, maximum drawdown, alpha generation strategies, and Jensen's alpha calculation are other essential aspects of the market. The Treynor ratio analysis, standard deviation calculation, and venture capital funds further illustrate the market's complexity and adaptability to various investment objectives and risk profiles.
 
We can help! Our analysts can customize this mutual funds market research report to meet your requirements. 
Get in touch
                        
          
            1 Executive Summary
- 1.1 Market overview
- Executive Summary - Chart on Market Overview
 - Executive Summary - Data Table on Market Overview
 - Executive Summary - Chart on Global Market Characteristics
 - Executive Summary - Chart on Market by Geography
 - Executive Summary - Chart on Market Segmentation by Type
 - Executive Summary - Chart on Market Segmentation by Distribution Channel
 - Executive Summary - Chart on Incremental Growth
 - Executive Summary - Data Table on Incremental Growth
 - Executive Summary - Chart on Company Market Positioning
 
 
2 Technavio Analysis
- 2.1 Analysis of price sensitivity, lifecycle, customer purchase basket, adoption rates, and purchase criteria
- Analysis of price sensitivity, lifecycle, customer purchase basket, adoption rates, and purchase criteria
 
 
- 2.2 Criticality of inputs and Factors of differentiation
- Overview on criticality of inputs and factors of differentiation
 
 
- 2.3 Factors of disruption
- Overview on factors of disruption
 
 
- 2.4 Impact of drivers and challenges
- Impact of drivers and challenges in 2024 and 2029
 
 
3 Market Landscape
- 3.1 Market ecosystem
- Parent Market
 - Data Table on - Parent Market
 
 
- 3.2 Market characteristics
- Market characteristics analysis
 
 
4 Market Sizing
- 4.1 Market definition
- Offerings of companies included in the market definition
 
 
- 4.2 Market segment analysis
 
- 4.4 Market outlook: Forecast for 2024-2029
- Chart on Global - Market size and forecast 2024-2029 ($ trillion)
 - Data Table on Global - Market size and forecast 2024-2029 ($ trillion)
 - Chart on Global Market: Year-over-year growth 2024-2029 (%)
 - Data Table on Global Market: Year-over-year growth 2024-2029 (%)
 
 
5 Historic Market Size
- 5.1 Global Mutual Funds Market 2019 - 2023
- Historic Market Size - Data Table on Global Mutual Funds Market 2019 - 2023 ($ trillion)
 
 
- 5.2 Type segment analysis 2019 - 2023
- Historic Market Size - Type Segment 2019 - 2023 ($ trillion)
 
 
- 5.3 Distribution Channel segment analysis 2019 - 2023
- Historic Market Size - Distribution Channel Segment 2019 - 2023 ($ trillion)
 
 
- 5.4 Geography segment analysis 2019 - 2023
- Historic Market Size - Geography Segment 2019 - 2023 ($ trillion)
 
 
- 5.5 Country segment analysis 2019 - 2023
- Historic Market Size - Country Segment 2019 - 2023 ($ trillion)
 
 
6 Qualitative Analysis
- 6.1 Impact of AI on the Global Mutual Funds Market
 
7 Five Forces Analysis
- 7.1 Five forces summary
- Five forces analysis - Comparison between 2024 and 2029
 
 
- 7.2 Bargaining power of buyers
- Bargaining power of buyers - Impact of key factors 2024 and 2029
 
 
- 7.3 Bargaining power of suppliers
- Bargaining power of suppliers - Impact of key factors in 2024 and 2029
 
 
- 7.4 Threat of new entrants
- Threat of new entrants - Impact of key factors in 2024 and 2029
 
 
- 7.5 Threat of substitutes
- Threat of substitutes - Impact of key factors in 2024 and 2029
 
 
- 7.6 Threat of rivalry
- Threat of rivalry - Impact of key factors in 2024 and 2029
 
 
- 7.7 Market condition
- Chart on Market condition - Five forces 2024 and 2029
 
 
8 Market Segmentation by Type
- 8.1 Market segments
- Chart on Type - Market share 2024-2029 (%)
 - Data Table on Type - Market share 2024-2029 (%)
 
 
- 8.2 Comparison by Type
- Chart on Comparison by Type
 - Data Table on Comparison by Type
 
 
- 8.3 Stock funds - Market size and forecast 2024-2029
- Chart on Stock funds - Market size and forecast 2024-2029 ($ trillion)
 - Data Table on Stock funds - Market size and forecast 2024-2029 ($ trillion)
 - Chart on Stock funds - Year-over-year growth 2024-2029 (%)
 - Data Table on Stock funds - Year-over-year growth 2024-2029 (%)
 
 
- 8.4 Bond funds - Market size and forecast 2024-2029
- Chart on Bond funds - Market size and forecast 2024-2029 ($ trillion)
 - Data Table on Bond funds - Market size and forecast 2024-2029 ($ trillion)
 - Chart on Bond funds - Year-over-year growth 2024-2029 (%)
 - Data Table on Bond funds - Year-over-year growth 2024-2029 (%)
 
 
- 8.5 Money market funds - Market size and forecast 2024-2029
- Chart on Money market funds - Market size and forecast 2024-2029 ($ trillion)
 - Data Table on Money market funds - Market size and forecast 2024-2029 ($ trillion)
 - Chart on Money market funds - Year-over-year growth 2024-2029 (%)
 - Data Table on Money market funds - Year-over-year growth 2024-2029 (%)
 
 
- 8.6 Hybrid funds - Market size and forecast 2024-2029
- Chart on Hybrid funds - Market size and forecast 2024-2029 ($ trillion)
 - Data Table on Hybrid funds - Market size and forecast 2024-2029 ($ trillion)
 - Chart on Hybrid funds - Year-over-year growth 2024-2029 (%)
 - Data Table on Hybrid funds - Year-over-year growth 2024-2029 (%)
 
 
- 8.7 Market opportunity by Type
- Market opportunity by Type ($ trillion)
 - Data Table on Market opportunity by Type ($ trillion)
 
 
9 Market Segmentation by Distribution Channel
- 9.1 Market segments
- Chart on Distribution Channel - Market share 2024-2029 (%)
 - Data Table on Distribution Channel - Market share 2024-2029 (%)
 
 
- 9.2 Comparison by Distribution Channel
- Chart on Comparison by Distribution Channel
 - Data Table on Comparison by Distribution Channel
 
 
- 9.3 Advice channel - Market size and forecast 2024-2029
- Chart on Advice channel - Market size and forecast 2024-2029 ($ trillion)
 - Data Table on Advice channel - Market size and forecast 2024-2029 ($ trillion)
 - Chart on Advice channel - Year-over-year growth 2024-2029 (%)
 - Data Table on Advice channel - Year-over-year growth 2024-2029 (%)
 
 
- 9.4 Retirement plan channel - Market size and forecast 2024-2029
- Chart on Retirement plan channel - Market size and forecast 2024-2029 ($ trillion)
 - Data Table on Retirement plan channel - Market size and forecast 2024-2029 ($ trillion)
 - Chart on Retirement plan channel - Year-over-year growth 2024-2029 (%)
 - Data Table on Retirement plan channel - Year-over-year growth 2024-2029 (%)
 
 
- 9.5 Institutional channel - Market size and forecast 2024-2029
- Chart on Institutional channel - Market size and forecast 2024-2029 ($ trillion)
 - Data Table on Institutional channel - Market size and forecast 2024-2029 ($ trillion)
 - Chart on Institutional channel - Year-over-year growth 2024-2029 (%)
 - Data Table on Institutional channel - Year-over-year growth 2024-2029 (%)
 
 
- 9.6 Direct channel - Market size and forecast 2024-2029
- Chart on Direct channel - Market size and forecast 2024-2029 ($ trillion)
 - Data Table on Direct channel - Market size and forecast 2024-2029 ($ trillion)
 - Chart on Direct channel - Year-over-year growth 2024-2029 (%)
 - Data Table on Direct channel - Year-over-year growth 2024-2029 (%)
 
 
- 9.7 Supermarket channel - Market size and forecast 2024-2029
- Chart on Supermarket channel - Market size and forecast 2024-2029 ($ trillion)
 - Data Table on Supermarket channel - Market size and forecast 2024-2029 ($ trillion)
 - Chart on Supermarket channel - Year-over-year growth 2024-2029 (%)
 - Data Table on Supermarket channel - Year-over-year growth 2024-2029 (%)
 
 
- 9.8 Market opportunity by Distribution Channel
- Market opportunity by Distribution Channel ($ trillion)
 - Data Table on Market opportunity by Distribution Channel ($ trillion)
 
 
10 Customer Landscape
- 10.1 Customer landscape overview
- Analysis of price sensitivity, lifecycle, customer purchase basket, adoption rates, and purchase criteria
 
 
11 Geographic Landscape
- 11.1 Geographic segmentation
- Chart on Market share by geography 2024-2029 (%)
 - Data Table on Market share by geography 2024-2029 (%)
 
 
- 11.2 Geographic comparison
- Chart on Geographic comparison
 - Data Table on Geographic comparison
 
 
- 11.3 North America - Market size and forecast 2024-2029
- Chart on North America - Market size and forecast 2024-2029 ($ trillion)
 - Data Table on North America - Market size and forecast 2024-2029 ($ trillion)
 - Chart on North America - Year-over-year growth 2024-2029 (%)
 - Data Table on North America - Year-over-year growth 2024-2029 (%)
 
 
- 11.4 Europe - Market size and forecast 2024-2029
- Chart on Europe - Market size and forecast 2024-2029 ($ trillion)
 - Data Table on Europe - Market size and forecast 2024-2029 ($ trillion)
 - Chart on Europe - Year-over-year growth 2024-2029 (%)
 - Data Table on Europe - Year-over-year growth 2024-2029 (%)
 
 
- 11.5 APAC - Market size and forecast 2024-2029
- Chart on APAC - Market size and forecast 2024-2029 ($ trillion)
 - Data Table on APAC - Market size and forecast 2024-2029 ($ trillion)
 - Chart on APAC - Year-over-year growth 2024-2029 (%)
 - Data Table on APAC - Year-over-year growth 2024-2029 (%)
 
 
- 11.6 South America - Market size and forecast 2024-2029
- Chart on South America - Market size and forecast 2024-2029 ($ trillion)
 - Data Table on South America - Market size and forecast 2024-2029 ($ trillion)
 - Chart on South America - Year-over-year growth 2024-2029 (%)
 - Data Table on South America - Year-over-year growth 2024-2029 (%)
 
 
- 11.7 Middle East and Africa - Market size and forecast 2024-2029
- Chart on Middle East and Africa - Market size and forecast 2024-2029 ($ trillion)
 - Data Table on Middle East and Africa - Market size and forecast 2024-2029 ($ trillion)
 - Chart on Middle East and Africa - Year-over-year growth 2024-2029 (%)
 - Data Table on Middle East and Africa - Year-over-year growth 2024-2029 (%)
 
 
- 11.8 US - Market size and forecast 2024-2029
- Chart on US - Market size and forecast 2024-2029 ($ trillion)
 - Data Table on US - Market size and forecast 2024-2029 ($ trillion)
 - Chart on US - Year-over-year growth 2024-2029 (%)
 - Data Table on US - Year-over-year growth 2024-2029 (%)
 
 
- 11.9 China - Market size and forecast 2024-2029
- Chart on China - Market size and forecast 2024-2029 ($ trillion)
 - Data Table on China - Market size and forecast 2024-2029 ($ trillion)
 - Chart on China - Year-over-year growth 2024-2029 (%)
 - Data Table on China - Year-over-year growth 2024-2029 (%)
 
 
- 11.10 Germany - Market size and forecast 2024-2029
- Chart on Germany - Market size and forecast 2024-2029 ($ trillion)
 - Data Table on Germany - Market size and forecast 2024-2029 ($ trillion)
 - Chart on Germany - Year-over-year growth 2024-2029 (%)
 - Data Table on Germany - Year-over-year growth 2024-2029 (%)
 
 
- 11.11 France - Market size and forecast 2024-2029
- Chart on France - Market size and forecast 2024-2029 ($ trillion)
 - Data Table on France - Market size and forecast 2024-2029 ($ trillion)
 - Chart on France - Year-over-year growth 2024-2029 (%)
 - Data Table on France - Year-over-year growth 2024-2029 (%)
 
 
- 11.12 Australia - Market size and forecast 2024-2029
- Chart on Australia - Market size and forecast 2024-2029 ($ trillion)
 - Data Table on Australia - Market size and forecast 2024-2029 ($ trillion)
 - Chart on Australia - Year-over-year growth 2024-2029 (%)
 - Data Table on Australia - Year-over-year growth 2024-2029 (%)
 
 
- 11.13 Canada - Market size and forecast 2024-2029
- Chart on Canada - Market size and forecast 2024-2029 ($ trillion)
 - Data Table on Canada - Market size and forecast 2024-2029 ($ trillion)
 - Chart on Canada - Year-over-year growth 2024-2029 (%)
 - Data Table on Canada - Year-over-year growth 2024-2029 (%)
 
 
- 11.14 UK - Market size and forecast 2024-2029
- Chart on UK - Market size and forecast 2024-2029 ($ trillion)
 - Data Table on UK - Market size and forecast 2024-2029 ($ trillion)
 - Chart on UK - Year-over-year growth 2024-2029 (%)
 - Data Table on UK - Year-over-year growth 2024-2029 (%)
 
 
- 11.15 Italy - Market size and forecast 2024-2029
- Chart on Italy - Market size and forecast 2024-2029 ($ trillion)
 - Data Table on Italy - Market size and forecast 2024-2029 ($ trillion)
 - Chart on Italy - Year-over-year growth 2024-2029 (%)
 - Data Table on Italy - Year-over-year growth 2024-2029 (%)
 
 
- 11.16 Spain - Market size and forecast 2024-2029
- Chart on Spain - Market size and forecast 2024-2029 ($ trillion)
 - Data Table on Spain - Market size and forecast 2024-2029 ($ trillion)
 - Chart on Spain - Year-over-year growth 2024-2029 (%)
 - Data Table on Spain - Year-over-year growth 2024-2029 (%)
 
 
- 11.17 India - Market size and forecast 2024-2029
- Chart on India - Market size and forecast 2024-2029 ($ trillion)
 - Data Table on India - Market size and forecast 2024-2029 ($ trillion)
 - Chart on India - Year-over-year growth 2024-2029 (%)
 - Data Table on India - Year-over-year growth 2024-2029 (%)
 
 
- 11.18 Market opportunity by geography
- Market opportunity by geography ($ trillion)
 - Data Tables on Market opportunity by geography ($ trillion)
 
 
12 Drivers, Challenges, and Opportunity/Restraints
- 12.3 Impact of drivers and challenges
- Impact of drivers and challenges in 2024 and 2029
 
 
- 12.4 Market opportunities/restraints
 
13 Competitive Landscape
- 13.2 Competitive Landscape
- Overview on criticality of inputs and factors of differentiation
 
 
- 13.3 Landscape disruption
- Overview on factors of disruption
 
 
- 13.4 Industry risks
- Impact of key risks on business
 
 
14 Competitive Analysis
- 14.2 Company ranking index
 
- 14.3 Market positioning of companies
- Matrix on companies position and classification
 
 
- 14.4 Aditya Birla Management Corp. Pvt. Ltd.
- Aditya Birla Management Corp. Pvt. Ltd. - Overview
 - Aditya Birla Management Corp. Pvt. Ltd. - Product / Service
 - Aditya Birla Management Corp. Pvt. Ltd. - Key news
 - Aditya Birla Management Corp. Pvt. Ltd. - Key offerings
 - SWOT
 
 
- 14.5 Amundi Austria GmbH
- Amundi Austria GmbH - Overview
 - Amundi Austria GmbH - Product / Service
 - Amundi Austria GmbH - Key offerings
 - SWOT
 
 
- 14.6 Axis Asset Management Co. Ltd.
- Axis Asset Management Co. Ltd. - Overview
 - Axis Asset Management Co. Ltd. - Product / Service
 - Axis Asset Management Co. Ltd. - Key offerings
 - SWOT
 
 
- 14.7 Baroda BNP Paribas Asset Management India Pvt. Ltd.
- Baroda BNP Paribas Asset Management India Pvt. Ltd. - Overview
 - Baroda BNP Paribas Asset Management India Pvt. Ltd. - Product / Service
 - Baroda BNP Paribas Asset Management India Pvt. Ltd. - Key offerings
 - SWOT
 
 
- 14.8 BlackRock Inc.
- BlackRock Inc. - Overview
 - BlackRock Inc. - Product / Service
 - BlackRock Inc. - Key news
 - BlackRock Inc. - Key offerings
 - SWOT
 
 
- 14.9 Canara Robeco Asset Management Co.
- Canara Robeco Asset Management Co. - Overview
 - Canara Robeco Asset Management Co. - Product / Service
 - Canara Robeco Asset Management Co. - Key offerings
 - SWOT
 
 
- 14.10 FMR LLC
- FMR LLC - Overview
 - FMR LLC - Product / Service
 - FMR LLC - Key offerings
 - SWOT
 
 
- 14.11 GLP Pte Ltd.
- GLP Pte Ltd. - Overview
 - GLP Pte Ltd. - Product / Service
 - GLP Pte Ltd. - Key offerings
 - SWOT
 
 
- 14.12 JPMorgan Chase and Co.
- JPMorgan Chase and Co. - Overview
 - JPMorgan Chase and Co. - Business segments
 - JPMorgan Chase and Co. - Key offerings
 - JPMorgan Chase and Co. - Segment focus
 - SWOT
 
 
- 14.13 PIMCO
- PIMCO - Overview
 - PIMCO - Product / Service
 - PIMCO - Key offerings
 - SWOT
 
 
- 14.14 State Street Global Advisors
- State Street Global Advisors - Overview
 - State Street Global Advisors - Business segments
 - State Street Global Advisors - Key offerings
 - State Street Global Advisors - Segment focus
 - SWOT
 
 
- 14.15 The Bank of New York Mellon Corp.
- The Bank of New York Mellon Corp. - Overview
 - The Bank of New York Mellon Corp. - Product / Service
 - The Bank of New York Mellon Corp. - Key offerings
 - SWOT
 
 
- 14.16 The Capital Group Companies Inc.
- The Capital Group Companies Inc. - Overview
 - The Capital Group Companies Inc. - Product / Service
 - The Capital Group Companies Inc. - Key offerings
 - SWOT
 
 
- 14.17 The Charles Schwab Corp.
- The Charles Schwab Corp. - Overview
 - The Charles Schwab Corp. - Business segments
 - The Charles Schwab Corp. - Key offerings
 - The Charles Schwab Corp. - Segment focus
 - SWOT
 
 
- 14.18 The Vanguard Group Inc.
- The Vanguard Group Inc. - Overview
 - The Vanguard Group Inc. - Product / Service
 - The Vanguard Group Inc. - Key offerings
 - SWOT
 
 
15 Appendix
- 15.2 Inclusions and exclusions checklist
- Inclusions checklist
 - Exclusions checklist
 
 
- 15.3 Currency conversion rates for US$
- Currency conversion rates for US$
 
 
- 15.4 Research methodology
 
- 15.7 Validation techniques employed for market sizing
- Validation techniques employed for market sizing
 
 
- 15.9 360 degree market analysis
- 360 degree market analysis
 
 
- 15.10 List of abbreviations