Wealth Management Market Analysis, Size, and Forecast 2026-2030: North America (US, Canada, and Mexico), APAC (China, Japan, and India), Europe (Germany, UK, and France), South America (Brazil and Argentina), Middle East and Africa (Saudi Arabia, UAE, and South Africa), and Rest of World (ROW)

Wealth Management Market Analysis, Size, and Forecast 2026-2030:
North America (US, Canada, and Mexico), APAC (China, Japan, and India), Europe (Germany, UK, and France), South America (Brazil and Argentina), Middle East and Africa (Saudi Arabia, UAE, and South Africa), and Rest of World (ROW)

Published: Mar 2026 310 Pages SKU: IRTNTR70101

Market Overview at a Glance

$469.1 B
Market Opportunity
8.1%
CAGR 2025 - 2030
44.7%
North America Growth
$464.5 B
Human advisory segment 2024

Wealth Management Market Size 2026-2030

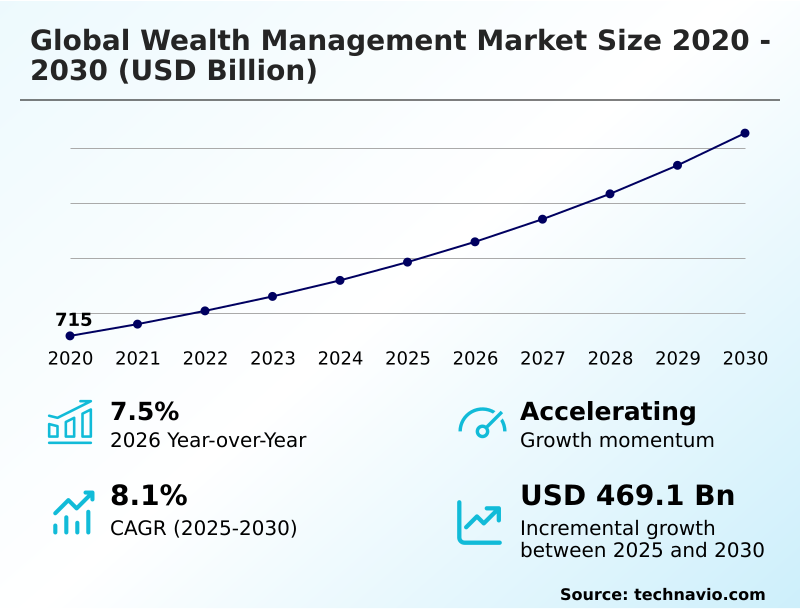
The wealth management market size is valued to increase by USD 469.1 billion, at a CAGR of 8.1% from 2025 to 2030. Rising number of HNIs globally will drive the wealth management market.

Major Market Trends & Insights

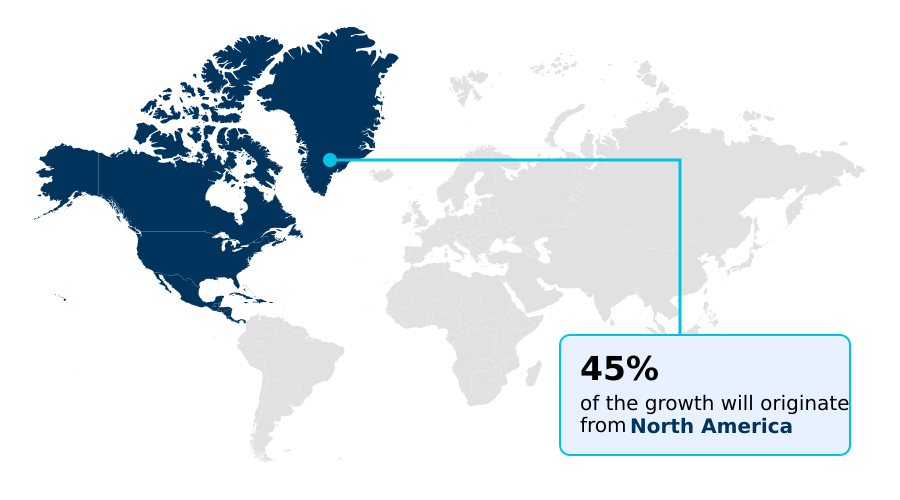
  • North America dominated the market and accounted for a 44.7% growth during the forecast period.
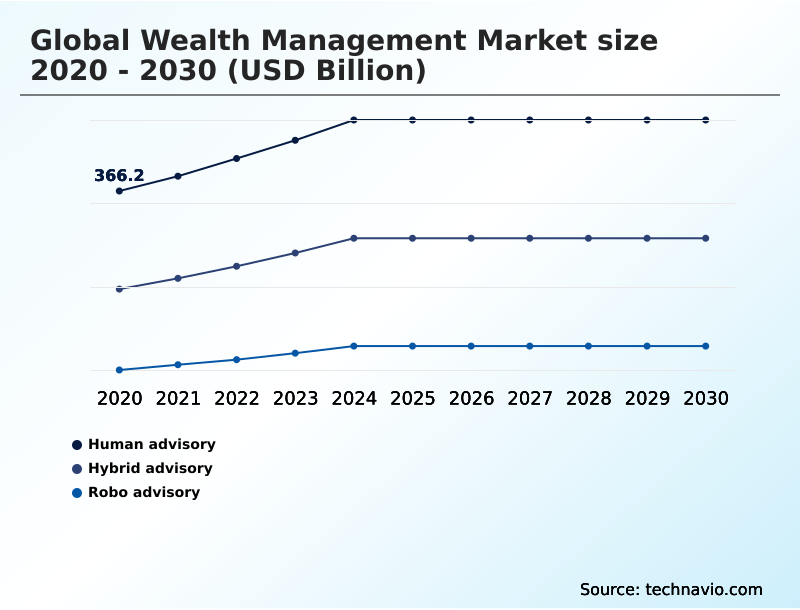
  • By Business Segment - Human advisory segment was valued at USD 464.5 billion in 2024
  • By End-user - Banks segment accounted for the largest market revenue share in 2024

Market Size & Forecast

  • Market Opportunities: USD 737.3 billion
  • Market Future Opportunities: USD 469.1 billion
  • CAGR from 2025 to 2030 : 8.1%

Market Summary

  • The wealth management market is undergoing a significant structural transformation, driven by technological integration and evolving client expectations. Firms are moving beyond traditional advisory to provide hyper-personalized services at scale, increasingly leveraging unified client platforms that consolidate diverse financial data.
  • The deployment of generative ai is becoming instrumental in this shift, enabling advisors to automate complex tasks and focus on high-value strategic guidance. For instance, an advisory firm can utilize an integrated platform to model a client's complete financial lifecycle, simulating outcomes based on various market conditions, tax implications, and personal goals in real time.
  • This enhances operational efficiency and allows for proactive, data-driven decision-making. The industry is also contending with challenges such as fee compression and the need for robust cybersecurity measures.
  • To remain competitive, participants are focusing on delivering holistic solutions that encompass not just investment management but also comprehensive financial wellness, adapting to the demands for transparency and digital-first engagement from a new generation of investors.

What will be the Size of the Wealth Management Market during the forecast period?

Get Key Insights on Market Forecast (PDF) Request Free Sample

How is the Wealth Management Market Segmented?

The wealth management industry research report provides comprehensive data (region-wise segment analysis), with forecasts and estimates in "USD billion" for the period 2026-2030, as well as historical data from 2020-2024 for the following segments.

  • Business segment
    • Human advisory
    • Hybrid advisory
    • Robo advisory
  • End-user
    • Banks
    • Trading and exchange firms
    • Investment management firms
    • Brokerage firms
    • Others
  • Service
    • Asset management
    • Portfolio management
    • Others
  • Geography
    • North America
      • US
      • Canada
      • Mexico
    • APAC
      • China
      • Japan
      • India
    • Europe
      • Germany
      • UK
      • France
    • South America
      • Brazil
      • Argentina
    • Middle East and Africa
      • Saudi Arabia
      • UAE
      • South Africa
    • Rest of World (ROW)

By Business Segment Insights

The human advisory segment is estimated to witness significant growth during the forecast period.

The human advisory segment is adapting through holistic life-goal orchestration, especially for managing intergenerational wealth transfer. Advisors now leverage sophisticated platforms providing private market access and tools for cross-border tax treatments, enabling them to deliver high-conviction advice.

The integration of low-code ai tools and embedded finance strategies facilitates the creation of customized portfolios incorporating active fixed-income and smart beta products. This evolution supports complex digital asset management and multi-jurisdictional regulatory compliance, addressing client needs for geographic diversification.

By using data-driven esg assessment, advisors are also managing systematic withdrawal plans more effectively, with top-tier firms demonstrating client retention rates exceeding 95%. This approach increasingly involves planning for digital executors, reflecting the modern complexities of wealth.

Request Free Sample

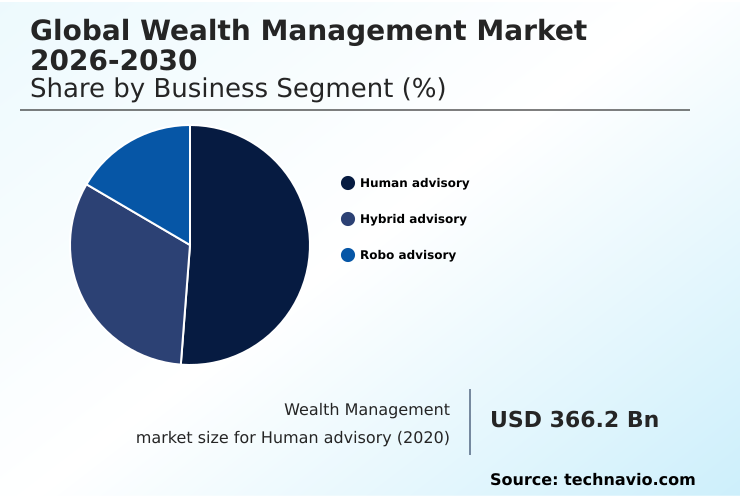
The Human advisory segment was valued at USD 464.5 billion in 2024 and showed a gradual increase during the forecast period.

Request Free Sample

Regional Analysis

North America is estimated to contribute 44.7% to the growth of the global market during the forecast period.Technavio’s analysts have elaborately explained the regional trends and drivers that shape the market during the forecast period.

See How Wealth Management Market Demand is Rising in North America Request Free Sample

The geographic landscape is shifting as firms adopt new strategies to meet diverse regional demands. In North America, the platformization of asset strategies is enabling the delivery of active outcome-oriented solutions.

In Europe, semi-liquid evergreen fund structures are gaining traction, while separately managed accounts and direct indexing are preferred for customization. The emphasis on financial model interoperability facilitates the seamless integration of systematic investment plans and mobile-centric financial tools.

Firms in APAC are seeing a 30% faster adoption of such platforms.

Meanwhile, in the Middle East, a focus on sharia-compliant wealth management and discretionary portfolio management is expanding the market for specialized financial products, including esg-compliant portfolios and impact investing, often accessed through cross-border investment platforms that ensure auditable provenance.

Market Dynamics

Our researchers analyzed the data with 2025 as the base year, along with the key drivers, trends, and challenges. A holistic analysis of drivers will help companies refine their marketing strategies to gain a competitive advantage.

  • The wealth management market is rapidly evolving due to several interconnected dynamics. The rise of ai-augmented advisors for wealth management is changing service delivery, while a strong focus on sustainable investing in wealth management reflects new investor priorities. Key technological advances in wealth management are enabling diversified wealth management service offerings that increasingly include alternative investments in wealth portfolios.
  • These changes are fueled by the rising high net worth individuals globally, though the fintech company growth impact creates a more competitive environment. This necessitates a focus on personalized digital client experiences to mitigate pricing pressure on wealth managers.
  • The market is segmenting, with robo advisory for retail investors gaining share, while hybrid advisory models for affluents and traditional human advisory for ultra-high-net-worth clients continue to be refined. The banks role in wealth management is shifting, as are the strategies for trading firms in a wealth ecosystem and investment management firms strategies.
  • The brokerage firms advisory evolution toward holistic planning is notable. Innovations in asset management product innovation and portfolio management hyper-personalization are critical. This includes advanced solutions for estate planning for digital assets and tax planning for mobile hnw is.
  • Firms are also strengthening compliance for cross-border wealth and integrating private markets into portfolios to meet demand, navigating the impact of regulation on advisory. Ultimately, the expanded use of ai for investment decision-making is central to the ongoing digital transformation in private banking, reducing time-to-insight by more than half compared to legacy methods.

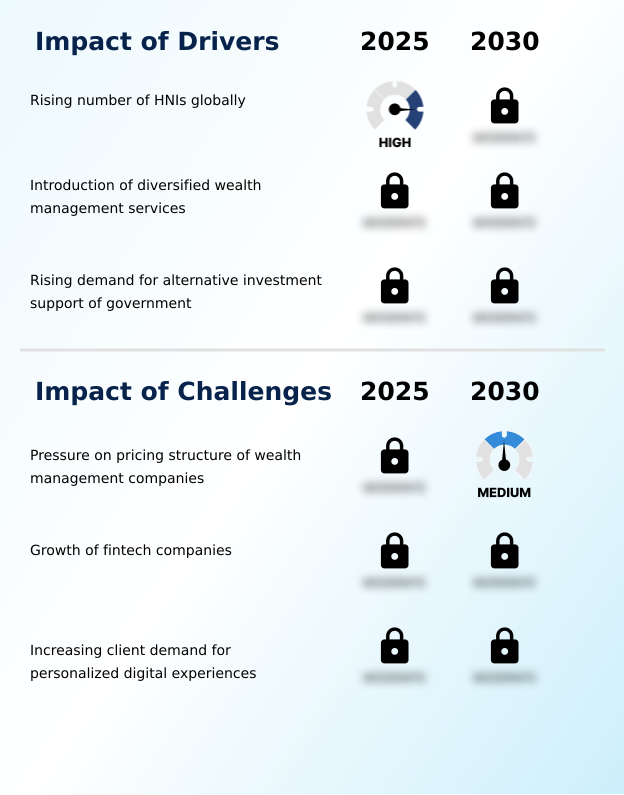
What are the key market drivers leading to the rise in the adoption of Wealth Management Industry?

  • The rising number of high-net-worth individuals globally is a key driver propelling market growth.

  • Market growth is propelled by the deployment of advanced technology to enhance client engagement and operational efficiency. The adoption of enterprise-grade ai systems is enabling the creation of unified client platforms that serve as a unified client brain for advisors.
  • These platforms utilize predictive analytics and generative ai to power ai copilots that assist with complex scenario modeling and provide conversational user interfaces.
  • This technological push is also facilitating an open banking framework, which supports the proliferation of democratized investment tools. The integration of ai-driven compliance programs within these systems is essential for managing the complexities of cross-border transactions.
  • Deployment of such platforms has shown to increase cross-selling opportunities by 35%, while the use of ai copilots for scenario modeling reduces report generation time by over 50%.

What are the market trends shaping the Wealth Management Industry?

  • Technological advances are reshaping the industry, representing a significant upcoming trend in the wealth management market.

  • Key market trends are centered on balancing high-touch services with scalable technology. The industry is seeing a sophisticated blend of human-centric advisory and high-velocity technological integration, driven by persistent fee compression. The deployment of agentic artificial intelligence is moving beyond experimentation to become a core operational layer ai for wealth lifecycle management.
  • This enables firms to offer institutional-grade infrastructure and democratize access to alternative assets, including private equity and hedge funds. Firms utilizing this approach have reported a 25% reduction in client onboarding time.
  • Furthermore, the development of digital asset custodial frameworks is crucial for providing lifestyle-related financial advice and executing real-time investment actions, enhancing efficiency by automating up to 40% of routine middle-office tasks.

What challenges does the Wealth Management Industry face during its growth?

  • Intense pressure on the pricing structures of wealth management companies presents a key challenge affecting industry growth.

  • Firms face significant challenges in modernizing front-office operations to meet demands for digital-first engagement while managing costs. Integrating advanced tools for real-time portfolio analysis, such as those for esg-integrated investing and cross-border wealth structuring, strains IT budgets.
  • The operational complexities are significant; for instance, integrating multi-asset capabilities for the tokenization of real-world assets and fractional exchange-traded funds can increase IT spending by 15-20%. The need to offer ai-augmented advisory services and specialized family office services further complicates the technology stack. Addressing the private savings gap through open finance initiatives requires robust yet flexible platforms.
  • Furthermore, the demand for digital-first engagement requires firms to enhance cybersecurity, raising compliance costs by an average of 10% annually.

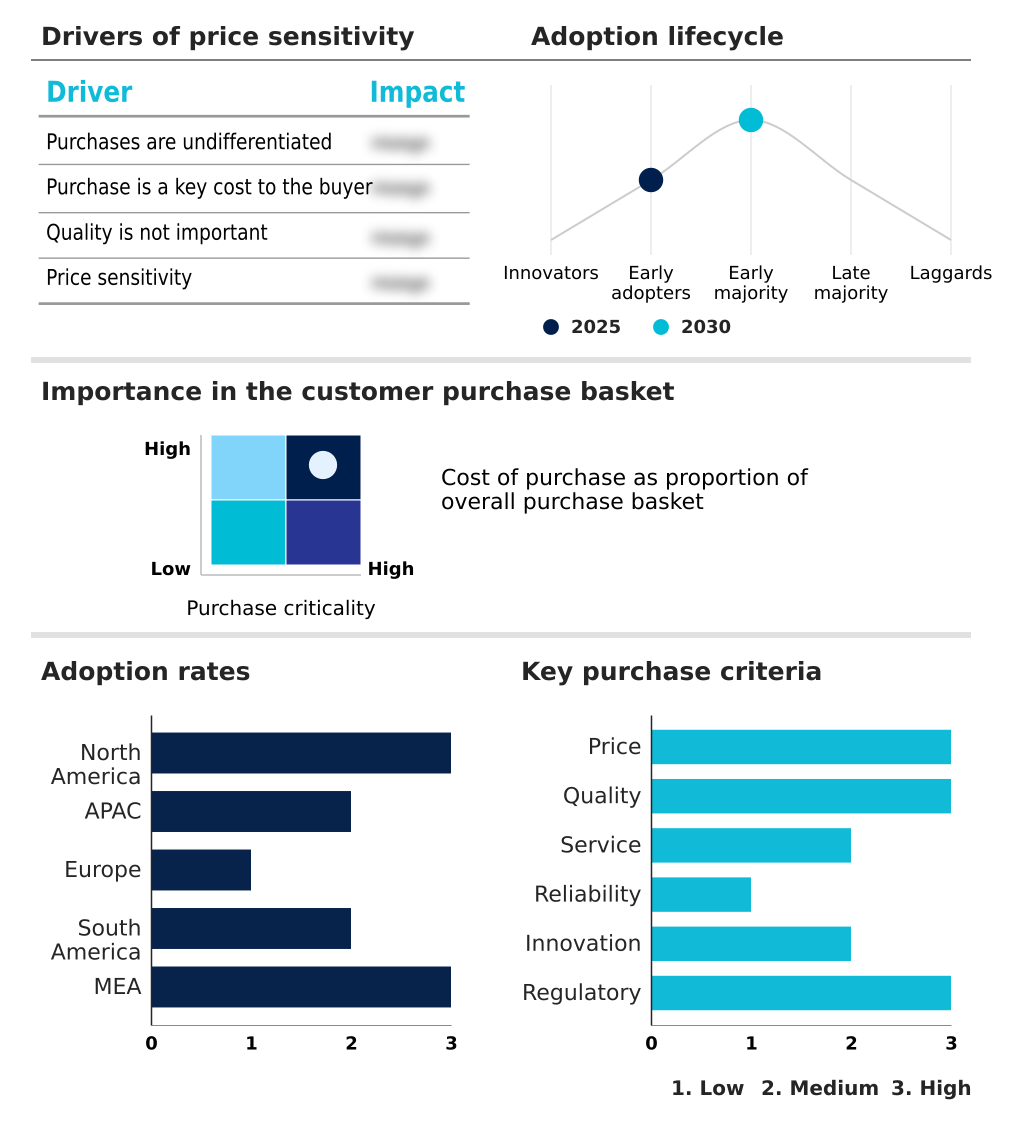
Exclusive Technavio Analysis on Customer Landscape

The wealth management market forecasting report includes the adoption lifecycle of the market, covering from the innovator’s stage to the laggard’s stage. It focuses on adoption rates in different regions based on penetration. Furthermore, the wealth management market report also includes key purchase criteria and drivers of price sensitivity to help companies evaluate and develop their market growth analysis strategies.

Customer Landscape of Wealth Management Industry

Competitive Landscape

Companies are implementing various strategies, such as strategic alliances, wealth management market forecast, partnerships, mergers and acquisitions, geographical expansion, and product/service launches, to enhance their presence in the industry.

Ameriprise Financial Inc. - Delivering financial planning and investment advisory solutions tailored to address the comprehensive needs of individuals and institutional clients.

The industry research and growth report includes detailed analyses of the competitive landscape of the market and information about key companies, including:

  • Ameriprise Financial Inc.
  • Banco Santander SA
  • Bank of America Corp.
  • Bank of New York Mellon Corp.
  • Barclays PLC
  • Citigroup Inc.
  • DBS Group Holdings Ltd.
  • HSBC Holdings Plc
  • Jones Financial Companies LLLP
  • JPMorgan Chase and Co.
  • Lombard Odier Group
  • Morgan Stanley
  • Nomura Holdings Inc.
  • Northern Trust Corp.
  • Pictet Group
  • Raymond James Financial Inc.
  • The Charles Schwab Corp.
  • The Goldman Sachs Group Inc.
  • UBS Group AG
  • Wells Fargo and Co.

Qualitative and quantitative analysis of companies has been conducted to help clients understand the wider business environment as well as the strengths and weaknesses of key industry players. Data is qualitatively analyzed to categorize companies as pure play, category-focused, industry-focused, and diversified; it is quantitatively analyzed to categorize companies as dominant, leading, strong, tentative, and weak.

Recent Development and News in Wealth management market

  • In October 2025, HSBC Private Bank unveiled its Wealth Intelligence platform, an in-house tool leveraging large language models to provide advisors with real-time, customized investment advice.
  • In January 2026, The UK's Financial Conduct Authority finalized the Consumer Composite Investments regime, set to replace the previous PRIIPs framework, offering product manufacturers greater flexibility in customer communications.
  • In February 2026, Nuveen reached a definitive agreement to acquire Schroders plc for approximately $13.5 billion, creating a global asset management entity with nearly $2.5 trillion in assets under management.
  • In May 2025, The UAE and the United States announced an AI Acceleration Partnership, a move designed to catalyze deep technological cooperation and foster innovation in AI applications within the financial services sector.

Dive into Technavio’s robust research methodology, blending expert interviews, extensive data synthesis, and validated models for unparalleled Wealth Management Market insights. See full methodology.

Market Scope
Page number 310
Base year 2025
Historic period 2020-2024
Forecast period 2026-2030
Growth momentum & CAGR Accelerate at a CAGR of 8.1%
Market growth 2026-2030 USD 469.1 billion
Market structure Fragmented
YoY growth 2025-2026(%) 7.5%
Key countries US, Canada, Mexico, China, Japan, India, South Korea, Australia, Indonesia, Germany, UK, France, Italy, Spain, The Netherlands, Brazil, Argentina, Chile, Saudi Arabia, UAE, South Africa, Israel and Turkey
Competitive landscape Leading Companies, Market Positioning of Companies, Competitive Strategies, and Industry Risks

Request Free Sample

Research Analyst Overview

  • The market is undergoing a structural pivot defined by high-velocity technological integration and a strategic shift toward alternative assets like private equity and hedge funds. The democratization of private markets is being realized through institutional-grade infrastructure, including semi-liquid evergreen fund structures that make non-traditional investments accessible.
  • This evolution is powered by agentic artificial intelligence and enterprise-grade ai systems, which facilitate everything from predictive analytics to ai-driven compliance programs for complex cross-border transactions and multi-jurisdictional regulatory compliance. Firms are building unified client platforms to deliver a seamless omnichannel client experience, leveraging generative ai for front-office operations and real-time portfolio analysis.
  • The move toward platformization of asset strategies supports active outcome-oriented solutions, with separately managed accounts and direct indexing offering deep personalization. Technology is also enabling the tokenization of real-world assets and the management of tokenized assets, on-chain cash, and fractional exchange-traded funds through advanced multi-asset capabilities with auditable provenance.
  • In a key boardroom-level decision, firms are prioritizing financial model interoperability to support this ecosystem. This technological adoption enables a 15% improvement in the efficiency of portfolio rebalancing and supports holistic life-goal orchestration, which is crucial for managing intergenerational wealth transfer and providing high-conviction advice.

What are the Key Data Covered in this Wealth Management Market Research and Growth Report?

  • What is the expected growth of the Wealth Management Market between 2026 and 2030?

    • USD 469.1 billion, at a CAGR of 8.1%

  • What segmentation does the market report cover?

    • The report is segmented by Business Segment (Human advisory, Hybrid advisory, and Robo advisory), End-user (Banks, Trading and exchange firms, Investment management firms, Brokerage firms, and Others), Service (Asset management, Portfolio management, and Others) and Geography (North America, APAC, Europe, South America, Middle East and Africa)

  • Which regions are analyzed in the report?

    • North America, APAC, Europe, South America and Middle East and Africa

  • What are the key growth drivers and market challenges?

    • Rising number of HNIs globally, Pressure on pricing structure of wealth management companies

  • Who are the major players in the Wealth Management Market?

    • Ameriprise Financial Inc., Banco Santander SA, Bank of America Corp., Bank of New York Mellon Corp., Barclays PLC, Citigroup Inc., DBS Group Holdings Ltd., HSBC Holdings Plc, Jones Financial Companies LLLP, JPMorgan Chase and Co., Lombard Odier Group, Morgan Stanley, Nomura Holdings Inc., Northern Trust Corp., Pictet Group, Raymond James Financial Inc., The Charles Schwab Corp., The Goldman Sachs Group Inc., UBS Group AG and Wells Fargo and Co.

Market Research Insights

  • The market is being reshaped by a focus on comprehensive wealth lifecycle management to counter persistent fee compression. Key strategies include developing digital asset custodial frameworks for real-time investment actions and offering lifestyle-related financial advice through operational layer ai. The use of ai copilots for advanced scenario modeling is becoming standard.
  • Firms are deploying democratized investment tools with conversational user interfaces, all powered by a unified client brain that integrates with the broader open banking framework. This shift enables enhanced family office services with a focus on esg-integrated investing and complex cross-border wealth structuring to address the private savings gap.
  • An emphasis on open finance supports digital-first engagement, with ai-augmented advisory services becoming crucial. Firms adopting these strategies report up to a 20% increase in client engagement and a 30% reduction in administrative overhead.

We can help! Our analysts can customize this wealth management market research report to meet your requirements.

Get in touch

1. Executive Summary

1.1 Market overview

Executive Summary - Chart on Market Overview
Executive Summary - Data Table on Market Overview
Executive Summary - Chart on Global Market Characteristics
Executive Summary - Chart on Market by Geography
Executive Summary - Chart on Market Segmentation by Business Segment
Executive Summary - Chart on Market Segmentation by End-user
Executive Summary - Chart on Market Segmentation by Service
Executive Summary - Chart on Incremental Growth
Executive Summary - Data Table on Incremental Growth
Executive Summary - Chart on Company Market Positioning

2. Technavio Analysis

2.1 Analysis of price sensitivity, lifecycle, customer purchase basket, adoption rates, and purchase criteria

2.2 Criticality of inputs and Factors of differentiation

Chart on Overview on criticality of inputs and factors of differentiation

2.3 Factors of disruption

Chart on Overview on factors of disruption

2.4 Impact of drivers and challenges

Chart on Impact of drivers and challenges in 2025 and 2030

3. Market Landscape

3.1 Market ecosystem

Chart on Parent Market
Data Table on - Parent Market

3.2 Market characteristics

Chart on Market characteristics analysis

3.3 Value chain analysis

Chart on Value chain analysis

4. Market Sizing

4.1 Market definition

Data Table on Offerings of companies included in the market definition

4.2 Market segment analysis

Market segments

4.3 Market size 2025

4.4 Market outlook: Forecast for 2025-2030

Chart on Global - Market size and forecast 2025-2030 ($ billion)
Data Table on Global - Market size and forecast 2025-2030 ($ billion)
Chart on Global Market: Year-over-year growth 2025-2030 (%)
Data Table on Global Market: Year-over-year growth 2025-2030 (%)

5. Historic Market Size

5.1 Global Wealth Management Market 2020 - 2024

Historic Market Size - Data Table on Global Wealth Management Market 2020 - 2024 ($ billion)

5.2 Business segment analysis 2020 - 2024

Historic Market Size - Business Segment 2020 - 2024 ($ billion)

5.3 End-user segment analysis 2020 - 2024

Historic Market Size - End-user Segment 2020 - 2024 ($ billion)

5.4 Service segment analysis 2020 - 2024

Historic Market Size - Service Segment 2020 - 2024 ($ billion)

5.5 Geography segment analysis 2020 - 2024

Historic Market Size - Geography Segment 2020 - 2024 ($ billion)

5.6 Country segment analysis 2020 - 2024

Historic Market Size - Country Segment 2020 - 2024 ($ billion)

6. Qualitative Analysis

6.1 Impact of AI in Global Wealth Management Market

7. Five Forces Analysis

7.1 Five forces summary

Five forces analysis - Comparison between 2025 and 2030

7.2 Bargaining power of buyers

Bargaining power of buyers - Impact of key factors 2025 and 2030

7.3 Bargaining power of suppliers

Bargaining power of suppliers - Impact of key factors in 2025 and 2030

7.4 Threat of new entrants

Threat of new entrants - Impact of key factors in 2025 and 2030

7.5 Threat of substitutes

Threat of substitutes - Impact of key factors in 2025 and 2030

7.6 Threat of rivalry

Threat of rivalry - Impact of key factors in 2025 and 2030

7.7 Market condition

Chart on Market condition - Five forces 2025 and 2030

8. Market Segmentation by Business Segment

8.1 Market segments

Chart on Market Segmentation by Business Segment - Market share 2025-2030 (%)
Data Table on Market Segmentation by Business Segment - Market share 2025-2030 (%)

8.2 Comparison by Market Segmentation by Business Segment

Chart on Comparison by Market Segmentation by Business Segment
Data Table on Comparison by Market Segmentation by Business Segment

8.3 Human advisory - Market size and forecast 2025-2030

Chart on Human advisory - Market size and forecast 2025-2030 ($ billion)
Data Table on Human advisory - Market size and forecast 2025-2030 ($ billion)
Chart on Human advisory - Year-over-year growth 2025-2030 (%)
Data Table on Human advisory - Year-over-year growth 2025-2030 (%)

8.4 Hybrid advisory - Market size and forecast 2025-2030

Chart on Hybrid advisory - Market size and forecast 2025-2030 ($ billion)
Data Table on Hybrid advisory - Market size and forecast 2025-2030 ($ billion)
Chart on Hybrid advisory - Year-over-year growth 2025-2030 (%)
Data Table on Hybrid advisory - Year-over-year growth 2025-2030 (%)

8.5 Robo advisory - Market size and forecast 2025-2030

Chart on Robo advisory - Market size and forecast 2025-2030 ($ billion)
Data Table on Robo advisory - Market size and forecast 2025-2030 ($ billion)
Chart on Robo advisory - Year-over-year growth 2025-2030 (%)
Data Table on Robo advisory - Year-over-year growth 2025-2030 (%)

8.6 Market opportunity by Market Segmentation by Business Segment

Market opportunity by Market Segmentation by Business Segment ($ billion)
Data Table on Market opportunity by Market Segmentation by Business Segment ($ billion)

9. Market Segmentation by End-user

9.1 Market segments

Chart on End-user - Market share 2025-2030 (%)
Data Table on End-user - Market share 2025-2030 (%)

9.2 Comparison by End-user

Chart on Comparison by End-user
Data Table on Comparison by End-user

9.3 Banks - Market size and forecast 2025-2030

Chart on Banks - Market size and forecast 2025-2030 ($ billion)
Data Table on Banks - Market size and forecast 2025-2030 ($ billion)
Chart on Banks - Year-over-year growth 2025-2030 (%)
Data Table on Banks - Year-over-year growth 2025-2030 (%)

9.4 Trading and exchange firms - Market size and forecast 2025-2030

Chart on Trading and exchange firms - Market size and forecast 2025-2030 ($ billion)
Data Table on Trading and exchange firms - Market size and forecast 2025-2030 ($ billion)
Chart on Trading and exchange firms - Year-over-year growth 2025-2030 (%)
Data Table on Trading and exchange firms - Year-over-year growth 2025-2030 (%)

9.5 Investment management firms - Market size and forecast 2025-2030

Chart on Investment management firms - Market size and forecast 2025-2030 ($ billion)
Data Table on Investment management firms - Market size and forecast 2025-2030 ($ billion)
Chart on Investment management firms - Year-over-year growth 2025-2030 (%)
Data Table on Investment management firms - Year-over-year growth 2025-2030 (%)

9.6 Brokerage firms - Market size and forecast 2025-2030

Chart on Brokerage firms - Market size and forecast 2025-2030 ($ billion)
Data Table on Brokerage firms - Market size and forecast 2025-2030 ($ billion)
Chart on Brokerage firms - Year-over-year growth 2025-2030 (%)
Data Table on Brokerage firms - Year-over-year growth 2025-2030 (%)

9.7 Others - Market size and forecast 2025-2030

Chart on Others - Market size and forecast 2025-2030 ($ billion)
Data Table on Others - Market size and forecast 2025-2030 ($ billion)
Chart on Others - Year-over-year growth 2025-2030 (%)
Data Table on Others - Year-over-year growth 2025-2030 (%)

9.8 Market opportunity by End-user

Market opportunity by End-user ($ billion)
Data Table on Market opportunity by End-user ($ billion)

10. Market Segmentation by Service

10.1 Market segments

Chart on Service - Market share 2025-2030 (%)
Data Table on Service - Market share 2025-2030 (%)

10.2 Comparison by Service

Chart on Comparison by Service
Data Table on Comparison by Service

10.3 Asset management - Market size and forecast 2025-2030

Chart on Asset management - Market size and forecast 2025-2030 ($ billion)
Data Table on Asset management - Market size and forecast 2025-2030 ($ billion)
Chart on Asset management - Year-over-year growth 2025-2030 (%)
Data Table on Asset management - Year-over-year growth 2025-2030 (%)

10.4 Portfolio management - Market size and forecast 2025-2030

Chart on Portfolio management - Market size and forecast 2025-2030 ($ billion)
Data Table on Portfolio management - Market size and forecast 2025-2030 ($ billion)
Chart on Portfolio management - Year-over-year growth 2025-2030 (%)
Data Table on Portfolio management - Year-over-year growth 2025-2030 (%)

10.5 Others - Market size and forecast 2025-2030

Chart on Others - Market size and forecast 2025-2030 ($ billion)
Data Table on Others - Market size and forecast 2025-2030 ($ billion)
Chart on Others - Year-over-year growth 2025-2030 (%)
Data Table on Others - Year-over-year growth 2025-2030 (%)

10.6 Market opportunity by Service

Market opportunity by Service ($ billion)
Data Table on Market opportunity by Service ($ billion)

11. Customer Landscape

11.1 Customer landscape overview

Analysis of price sensitivity, lifecycle, customer purchase basket, adoption rates, and purchase criteria

12. Geographic Landscape

12.1 Geographic segmentation

Chart on Market share by geography 2025-2030 (%)
Data Table on Market share by geography 2025-2030 (%)

12.2 Geographic comparison

Chart on Geographic comparison
Data Table on Geographic comparison

12.3 North America - Market size and forecast 2025-2030

Chart on North America - Market size and forecast 2025-2030 ($ billion)
Data Table on North America - Market size and forecast 2025-2030 ($ billion)
Chart on North America - Year-over-year growth 2025-2030 (%)
Data Table on North America - Year-over-year growth 2025-2030 (%)
Chart on Regional Comparison - North America
Data Table on Regional Comparison - North America

12.3.1 US - Market size and forecast 2025-2030

Chart on US - Market size and forecast 2025-2030 ($ billion)
Data Table on US - Market size and forecast 2025-2030 ($ billion)
Chart on US - Year-over-year growth 2025-2030 (%)
Data Table on US - Year-over-year growth 2025-2030 (%)

12.3.2 Canada - Market size and forecast 2025-2030

Chart on Canada - Market size and forecast 2025-2030 ($ billion)
Data Table on Canada - Market size and forecast 2025-2030 ($ billion)
Chart on Canada - Year-over-year growth 2025-2030 (%)
Data Table on Canada - Year-over-year growth 2025-2030 (%)

12.3.3 Mexico - Market size and forecast 2025-2030

Chart on Mexico - Market size and forecast 2025-2030 ($ billion)
Data Table on Mexico - Market size and forecast 2025-2030 ($ billion)
Chart on Mexico - Year-over-year growth 2025-2030 (%)
Data Table on Mexico - Year-over-year growth 2025-2030 (%)

12.4 APAC - Market size and forecast 2025-2030

Chart on APAC - Market size and forecast 2025-2030 ($ billion)
Data Table on APAC - Market size and forecast 2025-2030 ($ billion)
Chart on APAC - Year-over-year growth 2025-2030 (%)
Data Table on APAC - Year-over-year growth 2025-2030 (%)
Chart on Regional Comparison - APAC
Data Table on Regional Comparison - APAC

12.4.1 China - Market size and forecast 2025-2030

Chart on China - Market size and forecast 2025-2030 ($ billion)
Data Table on China - Market size and forecast 2025-2030 ($ billion)
Chart on China - Year-over-year growth 2025-2030 (%)
Data Table on China - Year-over-year growth 2025-2030 (%)

12.4.2 Japan - Market size and forecast 2025-2030

Chart on Japan - Market size and forecast 2025-2030 ($ billion)
Data Table on Japan - Market size and forecast 2025-2030 ($ billion)
Chart on Japan - Year-over-year growth 2025-2030 (%)
Data Table on Japan - Year-over-year growth 2025-2030 (%)

12.4.3 India - Market size and forecast 2025-2030

Chart on India - Market size and forecast 2025-2030 ($ billion)
Data Table on India - Market size and forecast 2025-2030 ($ billion)
Chart on India - Year-over-year growth 2025-2030 (%)
Data Table on India - Year-over-year growth 2025-2030 (%)

12.4.4 South Korea - Market size and forecast 2025-2030

Chart on South Korea - Market size and forecast 2025-2030 ($ billion)
Data Table on South Korea - Market size and forecast 2025-2030 ($ billion)
Chart on South Korea - Year-over-year growth 2025-2030 (%)
Data Table on South Korea - Year-over-year growth 2025-2030 (%)

12.4.5 Australia - Market size and forecast 2025-2030

Chart on Australia - Market size and forecast 2025-2030 ($ billion)
Data Table on Australia - Market size and forecast 2025-2030 ($ billion)
Chart on Australia - Year-over-year growth 2025-2030 (%)
Data Table on Australia - Year-over-year growth 2025-2030 (%)

12.4.6 Indonesia - Market size and forecast 2025-2030

Chart on Indonesia - Market size and forecast 2025-2030 ($ billion)
Data Table on Indonesia - Market size and forecast 2025-2030 ($ billion)
Chart on Indonesia - Year-over-year growth 2025-2030 (%)
Data Table on Indonesia - Year-over-year growth 2025-2030 (%)

12.5 Europe - Market size and forecast 2025-2030

Chart on Europe - Market size and forecast 2025-2030 ($ billion)
Data Table on Europe - Market size and forecast 2025-2030 ($ billion)
Chart on Europe - Year-over-year growth 2025-2030 (%)
Data Table on Europe - Year-over-year growth 2025-2030 (%)
Chart on Regional Comparison - Europe
Data Table on Regional Comparison - Europe

12.5.1 Germany - Market size and forecast 2025-2030

Chart on Germany - Market size and forecast 2025-2030 ($ billion)
Data Table on Germany - Market size and forecast 2025-2030 ($ billion)
Chart on Germany - Year-over-year growth 2025-2030 (%)
Data Table on Germany - Year-over-year growth 2025-2030 (%)

12.5.2 UK - Market size and forecast 2025-2030

Chart on UK - Market size and forecast 2025-2030 ($ billion)
Data Table on UK - Market size and forecast 2025-2030 ($ billion)
Chart on UK - Year-over-year growth 2025-2030 (%)
Data Table on UK - Year-over-year growth 2025-2030 (%)

12.5.3 France - Market size and forecast 2025-2030

Chart on France - Market size and forecast 2025-2030 ($ billion)
Data Table on France - Market size and forecast 2025-2030 ($ billion)
Chart on France - Year-over-year growth 2025-2030 (%)
Data Table on France - Year-over-year growth 2025-2030 (%)

12.5.4 Italy - Market size and forecast 2025-2030

Chart on Italy - Market size and forecast 2025-2030 ($ billion)
Data Table on Italy - Market size and forecast 2025-2030 ($ billion)
Chart on Italy - Year-over-year growth 2025-2030 (%)
Data Table on Italy - Year-over-year growth 2025-2030 (%)

12.5.5 Spain - Market size and forecast 2025-2030

Chart on Spain - Market size and forecast 2025-2030 ($ billion)
Data Table on Spain - Market size and forecast 2025-2030 ($ billion)
Chart on Spain - Year-over-year growth 2025-2030 (%)
Data Table on Spain - Year-over-year growth 2025-2030 (%)

12.5.6 The Netherlands - Market size and forecast 2025-2030

Chart on The Netherlands - Market size and forecast 2025-2030 ($ billion)
Data Table on The Netherlands - Market size and forecast 2025-2030 ($ billion)
Chart on The Netherlands - Year-over-year growth 2025-2030 (%)
Data Table on The Netherlands - Year-over-year growth 2025-2030 (%)

12.6 South America - Market size and forecast 2025-2030

Chart on South America - Market size and forecast 2025-2030 ($ billion)
Data Table on South America - Market size and forecast 2025-2030 ($ billion)
Chart on South America - Year-over-year growth 2025-2030 (%)
Data Table on South America - Year-over-year growth 2025-2030 (%)
Chart on Regional Comparison - South America
Data Table on Regional Comparison - South America

12.6.1 Brazil - Market size and forecast 2025-2030

Chart on Brazil - Market size and forecast 2025-2030 ($ billion)
Data Table on Brazil - Market size and forecast 2025-2030 ($ billion)
Chart on Brazil - Year-over-year growth 2025-2030 (%)
Data Table on Brazil - Year-over-year growth 2025-2030 (%)

12.6.2 Argentina - Market size and forecast 2025-2030

Chart on Argentina - Market size and forecast 2025-2030 ($ billion)
Data Table on Argentina - Market size and forecast 2025-2030 ($ billion)
Chart on Argentina - Year-over-year growth 2025-2030 (%)
Data Table on Argentina - Year-over-year growth 2025-2030 (%)

12.6.3 Chile - Market size and forecast 2025-2030

Chart on Chile - Market size and forecast 2025-2030 ($ billion)
Data Table on Chile - Market size and forecast 2025-2030 ($ billion)
Chart on Chile - Year-over-year growth 2025-2030 (%)
Data Table on Chile - Year-over-year growth 2025-2030 (%)

12.7 Middle East and Africa - Market size and forecast 2025-2030

Chart on Middle East and Africa - Market size and forecast 2025-2030 ($ billion)
Data Table on Middle East and Africa - Market size and forecast 2025-2030 ($ billion)
Chart on Middle East and Africa - Year-over-year growth 2025-2030 (%)
Data Table on Middle East and Africa - Year-over-year growth 2025-2030 (%)
Chart on Regional Comparison - Middle East and Africa
Data Table on Regional Comparison - Middle East and Africa

12.7.1 Saudi Arabia - Market size and forecast 2025-2030

Chart on Saudi Arabia - Market size and forecast 2025-2030 ($ billion)
Data Table on Saudi Arabia - Market size and forecast 2025-2030 ($ billion)
Chart on Saudi Arabia - Year-over-year growth 2025-2030 (%)
Data Table on Saudi Arabia - Year-over-year growth 2025-2030 (%)

12.7.2 UAE - Market size and forecast 2025-2030

Chart on UAE - Market size and forecast 2025-2030 ($ billion)
Data Table on UAE - Market size and forecast 2025-2030 ($ billion)
Chart on UAE - Year-over-year growth 2025-2030 (%)
Data Table on UAE - Year-over-year growth 2025-2030 (%)

12.7.3 South Africa - Market size and forecast 2025-2030

Chart on South Africa - Market size and forecast 2025-2030 ($ billion)
Data Table on South Africa - Market size and forecast 2025-2030 ($ billion)
Chart on South Africa - Year-over-year growth 2025-2030 (%)
Data Table on South Africa - Year-over-year growth 2025-2030 (%)

12.7.4 Israel - Market size and forecast 2025-2030

Chart on Israel - Market size and forecast 2025-2030 ($ billion)
Data Table on Israel - Market size and forecast 2025-2030 ($ billion)
Chart on Israel - Year-over-year growth 2025-2030 (%)
Data Table on Israel - Year-over-year growth 2025-2030 (%)

12.7.5 Turkey - Market size and forecast 2025-2030

Chart on Turkey - Market size and forecast 2025-2030 ($ billion)
Data Table on Turkey - Market size and forecast 2025-2030 ($ billion)
Chart on Turkey - Year-over-year growth 2025-2030 (%)
Data Table on Turkey - Year-over-year growth 2025-2030 (%)

12.8 Market opportunity by geography

Market opportunity by geography ($ billion)
Data Tables on Market opportunity by geography ($ billion)

13. Drivers, Challenges, and Opportunity

13.1 Market drivers

Rising number of HNIs globally
Introduction of diversified wealth management services
Rising demand for alternative investment support of government

13.2 Market challenges

Pressure on pricing structure of wealth management companies
Growth of fintech companies
Increasing client demand for personalized digital experiences

13.3 Impact of drivers and challenges

Impact of drivers and challenges in 2025 and 2030

13.4 Market opportunities

Technological advances in global wealth management market
Growing focus on sustainable investing
AI-Augmented advisors transform wealth management

14. Competitive Landscape

14.1 Overview

14.2

Overview on criticality of inputs and factors of differentiation

14.3 Landscape disruption

Overview on factors of disruption

14.4 Industry risks

Impact of key risks on business

15. Competitive Analysis

15.1 Companies profiled

Companies covered

15.2 Company ranking index

15.3 Market positioning of companies

Matrix on companies position and classification

15.4 Ameriprise Financial Inc.

Ameriprise Financial Inc. - Overview
Ameriprise Financial Inc. - Business segments
Ameriprise Financial Inc. - Key offerings
Ameriprise Financial Inc. - Segment focus
SWOT

15.5 Bank of America Corp.

Bank of America Corp. - Overview
Bank of America Corp. - Business segments
Bank of America Corp. - Key news
Bank of America Corp. - Key offerings
Bank of America Corp. - Segment focus
SWOT

15.6 Bank of New York Mellon Corp.

Bank of New York Mellon Corp. - Overview
Bank of New York Mellon Corp. - Business segments
Bank of New York Mellon Corp. - Key offerings
Bank of New York Mellon Corp. - Segment focus
SWOT

15.7 Barclays PLC

Barclays PLC - Overview
Barclays PLC - Business segments
Barclays PLC - Key offerings
Barclays PLC - Segment focus
SWOT

15.8 Citigroup Inc.

Citigroup Inc. - Overview
Citigroup Inc. - Business segments
Citigroup Inc. - Key news
Citigroup Inc. - Key offerings
Citigroup Inc. - Segment focus
SWOT

15.9 HSBC Holdings Plc

HSBC Holdings Plc - Overview
HSBC Holdings Plc - Business segments
HSBC Holdings Plc - Key offerings
HSBC Holdings Plc - Segment focus
SWOT

15.10 JPMorgan Chase and Co.

JPMorgan Chase and Co. - Overview
JPMorgan Chase and Co. - Business segments
JPMorgan Chase and Co. - Key offerings
JPMorgan Chase and Co. - Segment focus
SWOT

15.11 Lombard Odier Group

Lombard Odier Group - Overview
Lombard Odier Group - Product / Service
Lombard Odier Group - Key offerings
SWOT

15.12 Morgan Stanley

Morgan Stanley - Overview
Morgan Stanley - Business segments
Morgan Stanley - Key offerings
Morgan Stanley - Segment focus
SWOT

15.13 Northern Trust Corp.

Northern Trust Corp. - Overview
Northern Trust Corp. - Business segments
Northern Trust Corp. - Key offerings
Northern Trust Corp. - Segment focus
SWOT

15.14 Raymond James Financial Inc.

Raymond James Financial Inc. - Overview
Raymond James Financial Inc. - Business segments
Raymond James Financial Inc. - Key offerings
Raymond James Financial Inc. - Segment focus
SWOT

15.15 The Charles Schwab Corp.

The Charles Schwab Corp. - Overview
The Charles Schwab Corp. - Business segments
The Charles Schwab Corp. - Key offerings
The Charles Schwab Corp. - Segment focus
SWOT

15.16 The Goldman Sachs Group Inc.

The Goldman Sachs Group Inc. - Overview
The Goldman Sachs Group Inc. - Business segments
The Goldman Sachs Group Inc. - Key news
The Goldman Sachs Group Inc. - Key offerings
The Goldman Sachs Group Inc. - Segment focus
SWOT

15.17 UBS Group AG

UBS Group AG - Overview
UBS Group AG - Business segments
UBS Group AG - Key offerings
UBS Group AG - Segment focus
SWOT

15.18 Wells Fargo and Co.

Wells Fargo and Co. - Overview
Wells Fargo and Co. - Business segments
Wells Fargo and Co. - Key offerings
Wells Fargo and Co. - Segment focus
SWOT

16. Appendix

16.1 Scope of the report

Market definition
Objectives
Notes and caveats

16.2 Inclusions and exclusions checklist

Inclusions checklist
Exclusions checklist

16.3 Currency conversion rates for US$

16.4 Research methodology

16.5 Data procurement

Information sources

16.6 Data validation

16.7 Validation techniques employed for market sizing

16.8 Data synthesis

16.9 360 degree market analysis

16.10 List of abbreviations

Research Methodology

Technavio presents a detailed picture of the market by way of study, synthesis, and summation of data from multiple sources. The analysts have presented the various facets of the market with a particular focus on identifying the key industry influencers. The data thus presented is comprehensive, reliable, and the result of extensive research, both primary and secondary.

INFORMATION SOURCES

Primary sources

  • Manufacturers and suppliers
  • Channel partners
  • Industry experts
  • Strategic decision makers

Secondary sources

  • Industry journals and periodicals
  • Government data
  • Financial reports of key industry players
  • Historical data
  • Press releases

DATA ANALYSIS

Data Synthesis

  • Collation of data
  • Estimation of key figures
  • Analysis of derived insights

Data Validation

  • Triangulation with data models
  • Reference against proprietary databases
  • Corroboration with industry experts

REPORT WRITING

Qualitative

  • Market drivers
  • Market challenges
  • Market trends
  • Five forces analysis

Quantitative

  • Market size and forecast
  • Market segmentation
  • Geographical insights
  • Competitive landscape

Interested in this report?

Get your sample now to see our research methodology and insights!

Download Now

Frequently Asked Questions

Wealth Management market growth will increase by USD 469.1 billion during 2026-2030.

The Wealth Management market is expected to grow at a CAGR of 8.1% during 2026-2030.

Wealth Management market is segmented by Business segment (Human advisory, Hybrid advisory, Robo advisory) End-user (Banks, Trading and exchange firms, Investment management firms, Brokerage firms, Others) Service (Asset management, Portfolio management, Others)

Ameriprise Financial Inc., Banco Santander SA, Bank of America Corp., Bank of New York Mellon Corp., Barclays PLC, Citigroup Inc., DBS Group Holdings Ltd., HSBC Holdings Plc, Jones Financial Companies LLLP, JPMorgan Chase and Co., Lombard Odier Group, Morgan Stanley, Nomura Holdings Inc., Northern Trust Corp., Pictet Group, Raymond James Financial Inc., The Charles Schwab Corp., The Goldman Sachs Group Inc., UBS Group AG, Wells Fargo and Co. are a few of the key vendors in the Wealth Management market.

North America will register the highest growth rate of 44.7% among the other regions. Therefore, the Wealth Management market in North America is expected to garner significant business opportunities for the vendors during the forecast period.

US, Canada, Mexico, China, Japan, India, South Korea, Australia, Indonesia, Germany, UK, France, Italy, Spain, The Netherlands, Brazil, Argentina, Chile, Saudi Arabia, UAE, South Africa, Israel, Turkey

  • Rising number of HNIs globally is the driving factor this market.

The Wealth Management market vendors should focus on grabbing business opportunities from the Business segment segment as it accounted for the largest market share in the base year.
RIA - Research AI Assistant
Ask RIA