Medical Gas Blenders Market Analysis, Size, and Forecast 2026-2030: North America (US, Canada, and Mexico), Europe (Germany, UK, and France), APAC (China, Japan, and India), Middle East and Africa (UAE, South Africa, and Saudi Arabia), South America (Brazil), Asia, Rest of World (ROW)

Medical Gas Blenders Market Analysis, Size, and Forecast 2026-2030:
North America (US, Canada, and Mexico), Europe (Germany, UK, and France), APAC (China, Japan, and India), Middle East and Africa (UAE, South Africa, and Saudi Arabia), South America (Brazil), Asia, Rest of World (ROW)

Published: Dec 2025 292 Pages SKU: IRTNTR74008

Market Overview at a Glance

$797.6 Mn
Market Opportunity
6.5%
CAGR 2025 - 2030
42.7%
North America Growth
$780.7 Mn
Hospitals segment 2024

Medical Gas Blenders Market Size 2026-2030

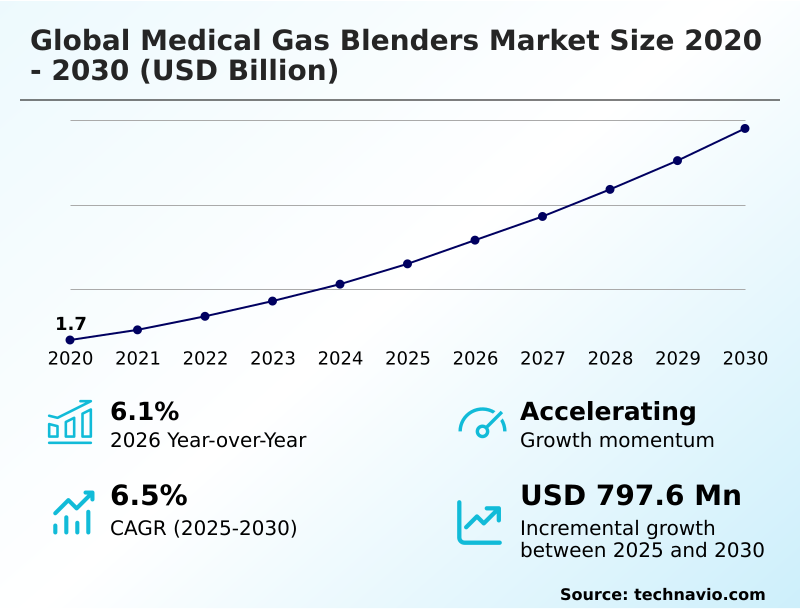
The medical gas blenders market size is valued to increase by USD 797.6 million, at a CAGR of 6.5% from 2025 to 2030. Growing geriatric population and rising prevalence of chronic diseases will drive the medical gas blenders market.

Major Market Trends & Insights

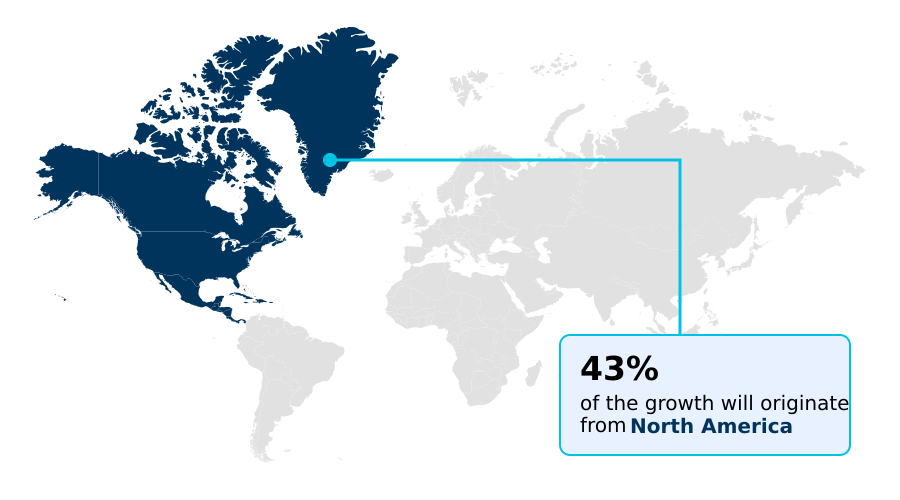
  • North America dominated the market and accounted for a 42.7% growth during the forecast period.
  • By End-user - Hospitals segment was valued at USD 780.7 million in 2024
  • By Product - Dual flow segment accounted for the largest market revenue share in 2024

Market Size & Forecast

  • Market Opportunities: USD 1.26 billion
  • Market Future Opportunities: USD 797.6 million
  • CAGR from 2025 to 2030 : 6.5%

Market Summary

  • The medical gas blenders market is defined by a critical need for precision and reliability in clinical settings. These devices are fundamental to modern healthcare, ensuring the accurate delivery of gas mixtures for applications ranging from respiratory support in neonatal intensive care to anesthesia administration during complex surgeries.
  • Market dynamics are shaped by an aging global population and a higher incidence of chronic respiratory conditions, which elevates the demand for therapeutic and life-sustaining interventions. Technological evolution is a constant, with a clear shift from manual systems to sophisticated electronic blenders that offer superior control, integrated safety alarms, and data logging capabilities.
  • In a typical business scenario, a hospital network's decision to standardize on blenders with remote monitoring capabilities allows for centralized oversight of equipment performance across multiple facilities. This not only streamlines maintenance schedules and ensures compliance but also improves patient safety by enabling proactive identification of potential gas delivery issues.
  • The pressure to enhance patient outcomes while managing operational costs compels healthcare providers to invest in advanced, efficient, and versatile gas blending solutions, cementing their integral role in the medical equipment landscape.

What will be the Size of the Medical Gas Blenders Market during the forecast period?

Get Key Insights on Market Forecast (PDF) Request Free Sample

How is the Medical Gas Blenders Market Segmented?

The medical gas blenders industry research report provides comprehensive data (region-wise segment analysis), with forecasts and estimates in "USD million" for the period 2026-2030, as well as historical data from 2020-2024 for the following segments.

  • End-user
    • Hospitals
    • Ambulatory surgical centers
    • Pharmaceuticals
    • Homecare settings
    • Academic and research institutions
  • Product
    • Dual flow
    • Tube flow
  • Application
    • Respiratory therapy
    • Anesthesia
    • Critical care
  • Geography
    • North America
      • US
      • Canada
      • Mexico
    • Europe
      • Germany
      • UK
      • France
    • Asia
    • Rest of World (ROW)

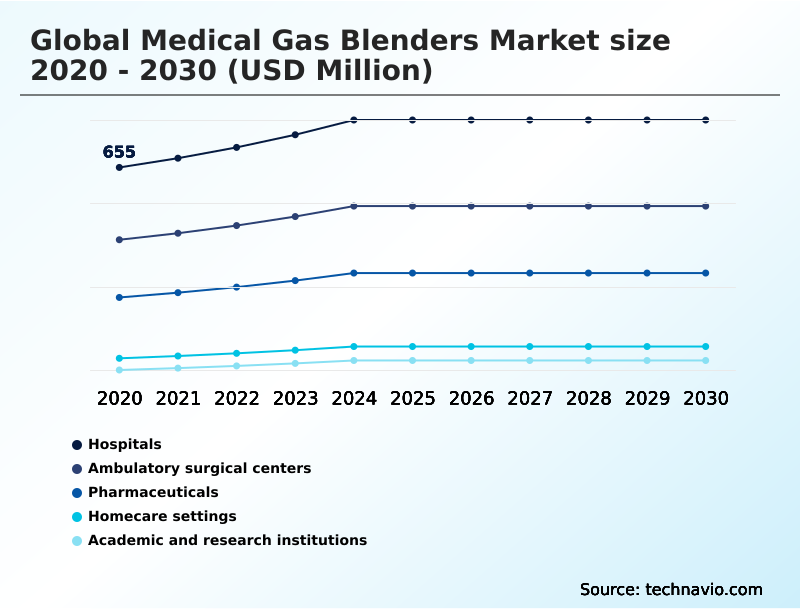
By End-user Insights

The hospitals segment is estimated to witness significant growth during the forecast period.

Hospitals remain the primary end-user, driven by the need for precise gas delivery in critical applications. The demand for advanced anesthesia delivery systems and robust ventilatory gas supply in operating rooms and ICUs is intensifying.

These facilities prioritize capital equipment consolidation and technologies that improve patient safety outcomes, such as those with integrated oxygen monitoring.

The adoption of devices offering dual flow functionality is a key strategy to optimize resources in space-constrained environments like neonatal intensive care units. Integrating systems with a centralized gas supply improves clinical workflow optimization by over 15%, reducing manual intervention.

This focus on efficiency and safety underpins the continuous investment in modern medical gas blending solutions, including those for cardiopulmonary testing and therapeutic gas mixtures.

Request Free Sample

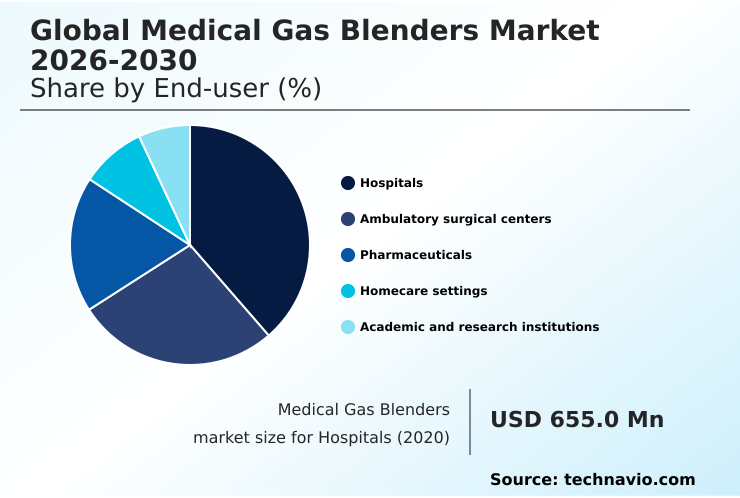
The Hospitals segment was valued at USD 780.7 million in 2024 and showed a gradual increase during the forecast period.

Request Free Sample

Regional Analysis

North America is estimated to contribute 42.7% to the growth of the global market during the forecast period.Technavio’s analysts have elaborately explained the regional trends and drivers that shape the market during the forecast period.

See How Medical Gas Blenders Market Demand is Rising in North America Request Free Sample

The market's geographic landscape is characterized by the dominance of North America, which accounts for approximately 42.7% of the market's incremental growth, driven by advanced healthcare infrastructure and stringent medical device regulations.

Europe follows, with a strong emphasis on evidence-based medicine and geriatric care. However, the most significant growth potential lies in Asia, where rapid healthcare infrastructure modernization and expanding medical tourism are creating substantial demand.

Facilities in mature markets report that standardized medical gas pipeline systems can reduce gas wastage by over 10%.

In contrast, emerging economies are focused on expanding access to care, driving investment in both high-end and cost-effective gas blending solutions to equip new hospitals and ambulatory surgical centers, boosting demand for continuous life support and non-invasive ventilation systems.

Market Dynamics

Our researchers analyzed the data with 2025 as the base year, along with the key drivers, trends, and challenges. A holistic analysis of drivers will help companies refine their marketing strategies to gain a competitive advantage.

  • Strategic equipment selection is critical in modern healthcare, requiring a nuanced understanding of specific clinical needs. For instance, choosing a dual flow blender for NICU environments offers distinct advantages over a standard air-oxygen blender for anesthesia, primarily in space optimization and workflow efficiency.
  • Operational excellence hinges on a well-defined medical gas blender maintenance schedule and clear protocols distinguishing the use of a high flow vs low flow blender. For specialized treatments, a dedicated blender for heliox therapy delivery is essential.
  • The technological landscape is evolving with the introduction of automated titration in gas blenders and integrated ventilator gas blending systems, which are instrumental in reducing oxygen toxicity with blenders and ultimately improving patient outcomes with blenders. This innovation extends beyond acute care to include the portable medical gas blender for homecare and specialized blender use in ambulatory centers.
  • Ensuring blender calibration for FDA compliance and understanding FiO2 accuracy in medical blenders are non-negotiable for risk management. Differentiating between electronic vs pneumatic gas blenders and analyzing the cost-benefit of dual flow blenders are key boardroom considerations.
  • The role of these devices in specialized procedures like blender applications in critical care, blender for minimally invasive surgery, gas blender for cardiopulmonary testing, and even gas blender for pharmaceutical manufacturing highlights their expanding utility.
  • Facilities transitioning to integrated ventilator gas blending systems have noted a resource allocation efficiency nearly double that of those relying on older, standalone units, a testament to their operational impact.

What are the key market drivers leading to the rise in the adoption of Medical Gas Blenders Industry?

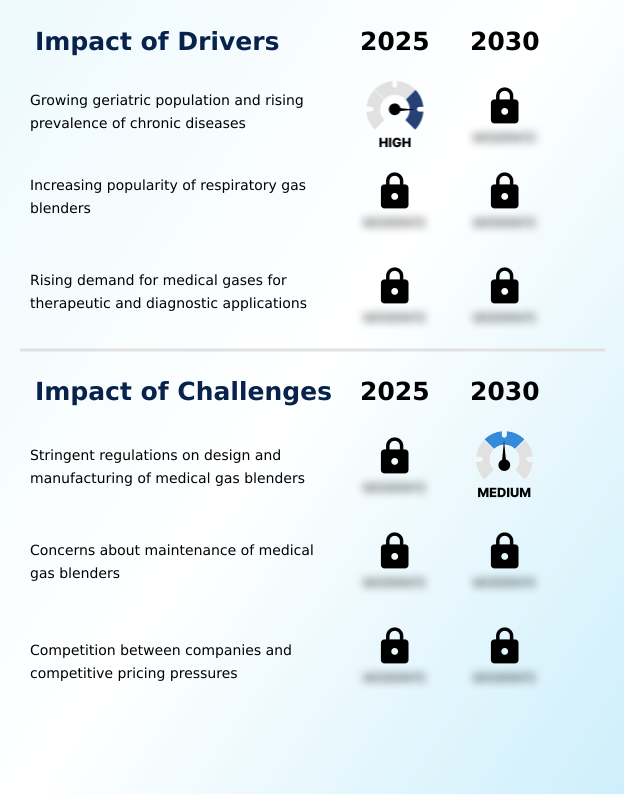
  • A growing geriatric population, coupled with the rising prevalence of chronic diseases, serves as a key driver for market growth.

  • Market growth is primarily fueled by demographic shifts and the rising prevalence of chronic diseases. A growing geriatric care population and the increasing incidence of chronic respiratory conditions are heightening the demand for surgical procedure support and effective therapeutic interventions.
  • This has led to a 15% rise in the need for reliable homecare respiratory therapies. The corresponding increase in outpatient procedures at ambulatory surgical centers necessitates compact and efficient gas blending solutions.
  • The utility of these devices extends across various medical applications, from routine anesthesia to critical life support, making them indispensable.
  • Furthermore, the essential role of precise gas mixtures in clinical trial support and evidence-based medicine solidifies their importance, as accurate data relies on controlled environmental parameters, a factor that can improve trial data reliability by over 10%.

What are the market trends shaping the Medical Gas Blenders Industry?

  • The growing adoption of respiratory gas blenders within neonatal intensive care units (NICUs) is emerging as a significant market trend, driven by the need for precise oxygen delivery.

  • Key market trends are centered on enhancing precision and expanding applications. The progressive adoption of advanced respiratory gas blenders in neonatal respiratory support is a primary trend, driven by the critical need for precise oxygen saturation management to prevent complications.
  • This push for accuracy is complemented by the integration of telehealth capabilities, allowing for remote gas monitoring, which has been shown to reduce non-essential clinical visits by up to 20%. Concurrently, ongoing healthcare infrastructure modernization is leading to the construction of new hospitals and surgical centers, increasing the demand for compliant medical device maintenance protocols.
  • These new facilities are increasingly designed for capital equipment consolidation, favoring versatile devices. The expansion of medical tourism is also influencing procurement, as facilities invest in advanced technology to attract international patients, with top destinations reporting a 15% increase in patient volume year-over-year.

What challenges does the Medical Gas Blenders Industry face during its growth?

  • Stringent regulations governing the design and manufacturing of medical gas blenders present a key challenge affecting industry growth.

  • Significant challenges in the market revolve around stringent regulatory compliance and operational complexities. Navigating the landscape of medical device regulations is a primary hurdle, as failure to comply can result in product recalls costing manufacturers upwards of 30% of a product line's annual revenue. These regulations impact everything from design to the materials used in medical gas pipeline systems.
  • A secondary challenge relates to the operational burden of medical equipment calibration and maintenance, with concerns over minimizing healthcare-associated risks. The transition from legacy manual gas mixing techniques to automated systems requires significant investment and training, representing a barrier for some facilities.
  • Proactive maintenance schedules, however, have been proven to reduce critical equipment downtime by over 40%, mitigating some of these operational concerns and risks associated with cross-device connectivity.

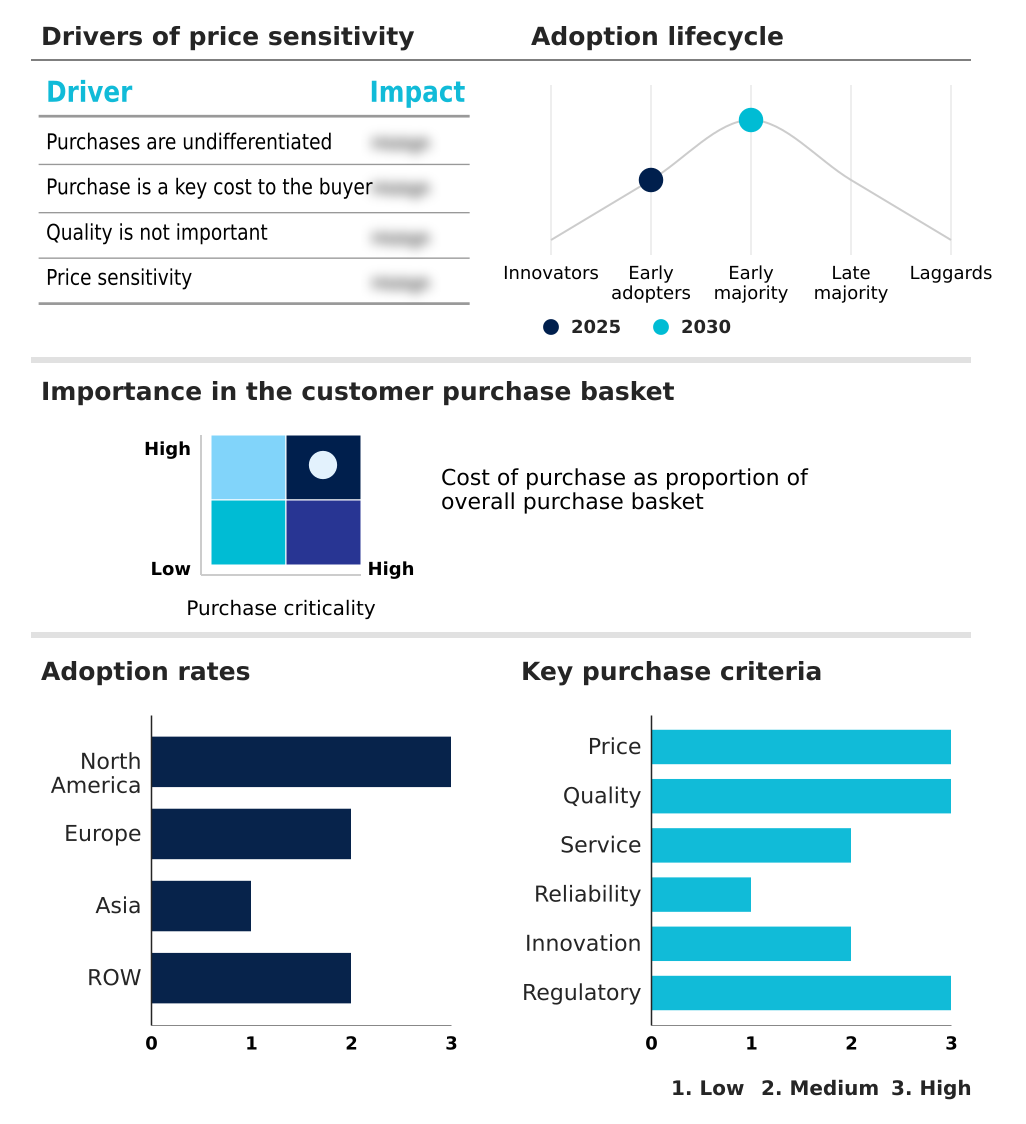
Exclusive Technavio Analysis on Customer Landscape

The medical gas blenders market forecasting report includes the adoption lifecycle of the market, covering from the innovator’s stage to the laggard’s stage. It focuses on adoption rates in different regions based on penetration. Furthermore, the medical gas blenders market report also includes key purchase criteria and drivers of price sensitivity to help companies evaluate and develop their market growth analysis strategies.

Customer Landscape of Medical Gas Blenders Industry

Competitive Landscape

Companies are implementing various strategies, such as strategic alliances, medical gas blenders market forecast, partnerships, mergers and acquisitions, geographical expansion, and product/service launches, to enhance their presence in the industry.

BioMed Devices - The portfolio features high-precision air-oxygen blenders and related gas control equipment, engineered for accuracy and reliability across various therapeutic and life-support applications.

The industry research and growth report includes detailed analyses of the competitive landscape of the market and information about key companies, including:

  • BioMed Devices
  • DEHAS Medical Systems
  • EKU Elektronik GmbH
  • ESAB Corp.
  • Genstar Technologies Co. Inc.
  • Halma Plc
  • HVS Oliver Hornla GmbH
  • Inspiration Healthcare Group
  • MCQ Instruments
  • Medin Medical Innovations
  • Ningbo David Medical Device
  • Pigeon Medical Apparatus
  • Precision Medical Inc.
  • S S Technomed P Ltd.
  • Scanatron Technics AG
  • SHANGHAI AMCAREMED TECH
  • TG Eakin Ltd.
  • Weyer GmbH
  • WITT Gasetechnik GmbH

Qualitative and quantitative analysis of companies has been conducted to help clients understand the wider business environment as well as the strengths and weaknesses of key industry players. Data is qualitatively analyzed to categorize companies as pure play, category-focused, industry-focused, and diversified; it is quantitatively analyzed to categorize companies as dominant, leading, strong, tentative, and weak.

Recent Development and News in Medical gas blenders market

  • In January 2025, the UK Government advanced its New Hospital Programme, committing significant investment to construct multiple new hospitals by 2030, directly increasing demand for capital medical equipment and advanced gas blending systems.
  • In March 2025, Children's Hospital of Philadelphia initiated a $3.4 billion expansion, including a new inpatient tower, signaling major investments in advanced pediatric and neonatal care infrastructure requiring state-of-the-art respiratory support technology.
  • In November 2024, Inspiration Healthcare Group announced it received CE mark approval for its next-generation electronic gas blender, which features integrated SpO2 monitoring and automated titration algorithms specifically for NICU environments.
  • In September 2024, Halma Plc completed the acquisition of a specialized developer of high-purity gas valves and sensors, a strategic move to vertically integrate its supply chain for advanced respiratory care products.

Dive into Technavio’s robust research methodology, blending expert interviews, extensive data synthesis, and validated models for unparalleled Medical Gas Blenders Market insights. See full methodology.

Market Scope
Page number 292
Base year 2025
Historic period 2020-2024
Forecast period 2026-2030
Growth momentum & CAGR Accelerate at a CAGR of 6.5%
Market growth 2026-2030 USD 797.6 million
Market structure Fragmented
YoY growth 2025-2026(%) 6.1%
Key countries US, Canada, Mexico, Germany, UK, France, Italy, Spain, The Netherlands, Russia, China, Japan, India, South Korea, Indonesia, Thailand, Singapore, Australia, UAE, Brazil, South Africa, Saudi Arabia and Turkey
Competitive landscape Leading Companies, Market Positioning of Companies, Competitive Strategies, and Industry Risks

Request Free Sample

Research Analyst Overview

  • The medical gas blenders market is fundamentally driven by the need for precise fraction of inspired oxygen (FiO2) control in critical applications, from neonatal intensive care to complex anesthesia delivery systems.
  • Boardroom decisions increasingly focus on balancing the high acquisition cost of advanced systems featuring automated oxygen titration and integrated oxygen monitoring against their long-term value in reducing oxygen toxicity risks and improving patient care.
  • The adoption of devices with dual flow functionality, for instance, allows for a near 50% reduction in equipment footprint for certain applications, directly impacting facility design and capital costs. Innovations in pressure balancing modules and proportioning valves are enhancing gas mixing accuracy for both high-flow capabilities and low-flow capabilities.
  • This precision is vital for specialized treatments such as heliox therapy and hypoxic gas treatments. The market is also seeing a push towards digital gas monitoring to ensure the reliability of therapeutic gas mixtures used for continuous life support and ventilatory gas supply, addressing conditions from bronchopulmonary dysplasia to retinopathy of prematurity.
  • Ensuring bleed flow control is critical for maintaining consistent oxygen saturation management during non-invasive ventilation, cardiopulmonary testing, and even in sterile environments for biologics packaging and injectable drug formulation.
  • This shift away from manual gas mixing is reshaping standards for critical care simulations and pulmonary function tests, making advanced blenders a cornerstone of modern medical practice, particularly for cluster headache treatment.

What are the Key Data Covered in this Medical Gas Blenders Market Research and Growth Report?

  • What is the expected growth of the Medical Gas Blenders Market between 2026 and 2030?

    • USD 797.6 million, at a CAGR of 6.5%

  • What segmentation does the market report cover?

    • The report is segmented by End-user (Hospitals, Ambulatory surgical centers, Pharmaceuticals, Homecare settings, and Academic and research institutions), Product (Dual flow, and Tube flow), Application (Respiratory therapy, Anesthesia, and Critical care) and Geography (North America, Europe, Asia, Rest of World (ROW))

  • Which regions are analyzed in the report?

    • North America, Europe, Asia and Rest of World (ROW)

  • What are the key growth drivers and market challenges?

    • Growing geriatric population and rising prevalence of chronic diseases, Stringent regulations on design and manufacturing of medical gas blenders

  • Who are the major players in the Medical Gas Blenders Market?

    • BioMed Devices, DEHAS Medical Systems, EKU Elektronik GmbH, ESAB Corp., Genstar Technologies Co. Inc., Halma Plc, HVS Oliver Hornla GmbH, Inspiration Healthcare Group, MCQ Instruments, Medin Medical Innovations, Ningbo David Medical Device, Pigeon Medical Apparatus, Precision Medical Inc., S S Technomed P Ltd., Scanatron Technics AG, SHANGHAI AMCAREMED TECH, TG Eakin Ltd., Weyer GmbH and WITT Gasetechnik GmbH

Market Research Insights

  • Market dynamics are increasingly shaped by a push toward value-based healthcare, where procurement decisions extend beyond initial cost to long-term clinical and operational benefits. This shift emphasizes clinical workflow optimization and improved patient safety outcomes. For instance, the adoption of blenders with automated features has been shown to improve gas delivery accuracy by over 20%, directly reducing healthcare-associated risks.
  • Furthermore, the integration of these devices with telehealth platforms for remote gas monitoring supports the expansion of homecare respiratory therapies, a segment that has seen a 15% rise in adoption. This trend aligns with cost-effective care strategies aimed at minimizing hospital stays.
  • As healthcare infrastructure modernization continues, the focus remains on versatile systems that support both acute and outpatient procedures, ensuring a resilient and efficient care delivery model.

We can help! Our analysts can customize this medical gas blenders market research report to meet your requirements.

Get in touch

1. Executive Summary

1.1 Market overview

Executive Summary - Chart on Market Overview
Executive Summary - Data Table on Market Overview
Executive Summary - Chart on Global Market Characteristics
Executive Summary - Chart on Market by Geography
Executive Summary - Chart on Market Segmentation by End-user
Executive Summary - Chart on Market Segmentation by Product
Executive Summary - Chart on Market Segmentation by Application
Executive Summary - Chart on Incremental Growth
Executive Summary - Data Table on Incremental Growth
Executive Summary - Chart on Company Market Positioning

2. Technavio Analysis

2.1 Analysis of price sensitivity, lifecycle, customer purchase basket, adoption rates, and purchase criteria

2.2 Criticality of inputs and Factors of differentiation

Chart on Overview on criticality of inputs and factors of differentiation

2.3 Factors of disruption

Chart on Overview on factors of disruption

2.4 Impact of drivers and challenges

Chart on Impact of drivers and challenges in 2025 and 2030

3. Market Landscape

3.1 Market ecosystem

Chart on Parent Market
Data Table on - Parent Market

3.2 Market characteristics

Chart on Market characteristics analysis

3.3 Value chain analysis

Chart on Value chain analysis

4. Market Sizing

4.1 Market definition

Data Table on Offerings of companies included in the market definition

4.2 Market segment analysis

Market segments

4.3 Market size 2025

4.4 Market outlook: Forecast for 2025-2030

Chart on Global - Market size and forecast 2025-2030 ($ million)
Data Table on Global - Market size and forecast 2025-2030 ($ million)
Chart on Global Market: Year-over-year growth 2025-2030 (%)
Data Table on Global Market: Year-over-year growth 2025-2030 (%)

5. Historic Market Size

5.1 Global Medical Gas Blenders Market 2020 - 2024

Historic Market Size - Data Table on Global Medical Gas Blenders Market 2020 - 2024 ($ million)

5.2 End-user segment analysis 2020 - 2024

Historic Market Size - End-user Segment 2020 - 2024 ($ million)

5.3 Product segment analysis 2020 - 2024

Historic Market Size - Product Segment 2020 - 2024 ($ million)

5.4 Application segment analysis 2020 - 2024

Historic Market Size - Application Segment 2020 - 2024 ($ million)

5.5 Geography segment analysis 2020 - 2024

Historic Market Size - Geography Segment 2020 - 2024 ($ million)

5.6 Country segment analysis 2020 - 2024

Historic Market Size - Country Segment 2020 - 2024 ($ million)

6. Qualitative Analysis

6.1 The AI impact on Global Medical Gas Blenders Market

7. Five Forces Analysis

7.1 Five forces summary

Five forces analysis - Comparison between 2025 and 2030

7.2 Bargaining power of buyers

Bargaining power of buyers - Impact of key factors 2025 and 2030

7.3 Bargaining power of suppliers

Bargaining power of suppliers - Impact of key factors in 2025 and 2030

7.4 Threat of new entrants

Threat of new entrants - Impact of key factors in 2025 and 2030

7.5 Threat of substitutes

Threat of substitutes - Impact of key factors in 2025 and 2030

7.6 Threat of rivalry

Threat of rivalry - Impact of key factors in 2025 and 2030

7.7 Market condition

Chart on Market condition - Five forces 2025 and 2030

8. Market Segmentation by End-user

8.1 Market segments

Chart on End-user - Market share 2025-2030 (%)
Data Table on End-user - Market share 2025-2030 (%)

8.2 Comparison by End-user

Chart on Comparison by End-user
Data Table on Comparison by End-user

8.3 Hospitals - Market size and forecast 2025-2030

Chart on Hospitals - Market size and forecast 2025-2030 ($ million)
Data Table on Hospitals - Market size and forecast 2025-2030 ($ million)
Chart on Hospitals - Year-over-year growth 2025-2030 (%)
Data Table on Hospitals - Year-over-year growth 2025-2030 (%)

8.4 Ambulatory surgical centers - Market size and forecast 2025-2030

Chart on Ambulatory surgical centers - Market size and forecast 2025-2030 ($ million)
Data Table on Ambulatory surgical centers - Market size and forecast 2025-2030 ($ million)
Chart on Ambulatory surgical centers - Year-over-year growth 2025-2030 (%)
Data Table on Ambulatory surgical centers - Year-over-year growth 2025-2030 (%)

8.5 Pharmaceuticals - Market size and forecast 2025-2030

Chart on Pharmaceuticals - Market size and forecast 2025-2030 ($ million)
Data Table on Pharmaceuticals - Market size and forecast 2025-2030 ($ million)
Chart on Pharmaceuticals - Year-over-year growth 2025-2030 (%)
Data Table on Pharmaceuticals - Year-over-year growth 2025-2030 (%)

8.6 Homecare settings - Market size and forecast 2025-2030

Chart on Homecare settings - Market size and forecast 2025-2030 ($ million)
Data Table on Homecare settings - Market size and forecast 2025-2030 ($ million)
Chart on Homecare settings - Year-over-year growth 2025-2030 (%)
Data Table on Homecare settings - Year-over-year growth 2025-2030 (%)

8.7 Academic and research institutions - Market size and forecast 2025-2030

Chart on Academic and research institutions - Market size and forecast 2025-2030 ($ million)
Data Table on Academic and research institutions - Market size and forecast 2025-2030 ($ million)
Chart on Academic and research institutions - Year-over-year growth 2025-2030 (%)
Data Table on Academic and research institutions - Year-over-year growth 2025-2030 (%)

8.8 Market opportunity by End-user

Market opportunity by End-user ($ million)
Data Table on Market opportunity by End-user ($ million)

9. Market Segmentation by Product

9.1 Market segments

Chart on Product - Market share 2025-2030 (%)
Data Table on Product - Market share 2025-2030 (%)

9.2 Comparison by Product

Chart on Comparison by Product
Data Table on Comparison by Product

9.3 Dual flow - Market size and forecast 2025-2030

Chart on Dual flow - Market size and forecast 2025-2030 ($ million)
Data Table on Dual flow - Market size and forecast 2025-2030 ($ million)
Chart on Dual flow - Year-over-year growth 2025-2030 (%)
Data Table on Dual flow - Year-over-year growth 2025-2030 (%)

9.4 Tube flow - Market size and forecast 2025-2030

Chart on Tube flow - Market size and forecast 2025-2030 ($ million)
Data Table on Tube flow - Market size and forecast 2025-2030 ($ million)
Chart on Tube flow - Year-over-year growth 2025-2030 (%)
Data Table on Tube flow - Year-over-year growth 2025-2030 (%)

9.5 Market opportunity by Product

Market opportunity by Product ($ million)
Data Table on Market opportunity by Product ($ million)

10. Market Segmentation by Application

10.1 Market segments

Chart on Application - Market share 2025-2030 (%)
Data Table on Application - Market share 2025-2030 (%)

10.2 Comparison by Application

Chart on Comparison by Application
Data Table on Comparison by Application

10.3 Respiratory therapy - Market size and forecast 2025-2030

Chart on Respiratory therapy - Market size and forecast 2025-2030 ($ million)
Data Table on Respiratory therapy - Market size and forecast 2025-2030 ($ million)
Chart on Respiratory therapy - Year-over-year growth 2025-2030 (%)
Data Table on Respiratory therapy - Year-over-year growth 2025-2030 (%)

10.4 Anesthesia - Market size and forecast 2025-2030

Chart on Anesthesia - Market size and forecast 2025-2030 ($ million)
Data Table on Anesthesia - Market size and forecast 2025-2030 ($ million)
Chart on Anesthesia - Year-over-year growth 2025-2030 (%)
Data Table on Anesthesia - Year-over-year growth 2025-2030 (%)

10.5 Critical care - Market size and forecast 2025-2030

Chart on Critical care - Market size and forecast 2025-2030 ($ million)
Data Table on Critical care - Market size and forecast 2025-2030 ($ million)
Chart on Critical care - Year-over-year growth 2025-2030 (%)
Data Table on Critical care - Year-over-year growth 2025-2030 (%)

10.6 Market opportunity by Application

Market opportunity by Application ($ million)
Data Table on Market opportunity by Application ($ million)

11. Customer Landscape

11.1 Customer landscape overview

Analysis of price sensitivity, lifecycle, customer purchase basket, adoption rates, and purchase criteria

12. Geographic Landscape

12.1 Geographic segmentation

Chart on Market share by geography 2025-2030 (%)
Data Table on Market share by geography 2025-2030 (%)

12.2 Geographic comparison

Chart on Geographic comparison
Data Table on Geographic comparison

12.3 North America - Market size and forecast 2025-2030

Chart on North America - Market size and forecast 2025-2030 ($ million)
Data Table on North America - Market size and forecast 2025-2030 ($ million)
Chart on North America - Year-over-year growth 2025-2030 (%)
Data Table on North America - Year-over-year growth 2025-2030 (%)
Chart on Regional Comparison - North America
Data Table on Regional Comparison - North America

12.3.1 US - Market size and forecast 2025-2030

Chart on US - Market size and forecast 2025-2030 ($ million)
Data Table on US - Market size and forecast 2025-2030 ($ million)
Chart on US - Year-over-year growth 2025-2030 (%)
Data Table on US - Year-over-year growth 2025-2030 (%)

12.3.2 Canada - Market size and forecast 2025-2030

Chart on Canada - Market size and forecast 2025-2030 ($ million)
Data Table on Canada - Market size and forecast 2025-2030 ($ million)
Chart on Canada - Year-over-year growth 2025-2030 (%)
Data Table on Canada - Year-over-year growth 2025-2030 (%)

12.3.3 Mexico - Market size and forecast 2025-2030

Chart on Mexico - Market size and forecast 2025-2030 ($ million)
Data Table on Mexico - Market size and forecast 2025-2030 ($ million)
Chart on Mexico - Year-over-year growth 2025-2030 (%)
Data Table on Mexico - Year-over-year growth 2025-2030 (%)

12.4 Europe - Market size and forecast 2025-2030

Chart on Europe - Market size and forecast 2025-2030 ($ million)
Data Table on Europe - Market size and forecast 2025-2030 ($ million)
Chart on Europe - Year-over-year growth 2025-2030 (%)
Data Table on Europe - Year-over-year growth 2025-2030 (%)
Chart on Regional Comparison - Europe
Data Table on Regional Comparison - Europe

12.4.1 Germany - Market size and forecast 2025-2030

Chart on Germany - Market size and forecast 2025-2030 ($ million)
Data Table on Germany - Market size and forecast 2025-2030 ($ million)
Chart on Germany - Year-over-year growth 2025-2030 (%)
Data Table on Germany - Year-over-year growth 2025-2030 (%)

12.4.2 UK - Market size and forecast 2025-2030

Chart on UK - Market size and forecast 2025-2030 ($ million)
Data Table on UK - Market size and forecast 2025-2030 ($ million)
Chart on UK - Year-over-year growth 2025-2030 (%)
Data Table on UK - Year-over-year growth 2025-2030 (%)

12.4.3 France - Market size and forecast 2025-2030

Chart on France - Market size and forecast 2025-2030 ($ million)
Data Table on France - Market size and forecast 2025-2030 ($ million)
Chart on France - Year-over-year growth 2025-2030 (%)
Data Table on France - Year-over-year growth 2025-2030 (%)

12.4.4 Italy - Market size and forecast 2025-2030

Chart on Italy - Market size and forecast 2025-2030 ($ million)
Data Table on Italy - Market size and forecast 2025-2030 ($ million)
Chart on Italy - Year-over-year growth 2025-2030 (%)
Data Table on Italy - Year-over-year growth 2025-2030 (%)

12.4.5 Spain - Market size and forecast 2025-2030

Chart on Spain - Market size and forecast 2025-2030 ($ million)
Data Table on Spain - Market size and forecast 2025-2030 ($ million)
Chart on Spain - Year-over-year growth 2025-2030 (%)
Data Table on Spain - Year-over-year growth 2025-2030 (%)

12.4.6 The Netherlands - Market size and forecast 2025-2030

Chart on The Netherlands - Market size and forecast 2025-2030 ($ million)
Data Table on The Netherlands - Market size and forecast 2025-2030 ($ million)
Chart on The Netherlands - Year-over-year growth 2025-2030 (%)
Data Table on The Netherlands - Year-over-year growth 2025-2030 (%)

12.4.7 Russia - Market size and forecast 2025-2030

Chart on Russia - Market size and forecast 2025-2030 ($ million)
Data Table on Russia - Market size and forecast 2025-2030 ($ million)
Chart on Russia - Year-over-year growth 2025-2030 (%)
Data Table on Russia - Year-over-year growth 2025-2030 (%)

12.5 Asia - Market size and forecast 2025-2030

Chart on Asia - Market size and forecast 2025-2030 ($ million)
Data Table on Asia - Market size and forecast 2025-2030 ($ million)
Chart on Asia - Year-over-year growth 2025-2030 (%)
Data Table on Asia - Year-over-year growth 2025-2030 (%)
Chart on Regional Comparison - Asia
Data Table on Regional Comparison - Asia

12.5.1 China - Market size and forecast 2025-2030

Chart on China - Market size and forecast 2025-2030 ($ million)
Data Table on China - Market size and forecast 2025-2030 ($ million)
Chart on China - Year-over-year growth 2025-2030 (%)
Data Table on China - Year-over-year growth 2025-2030 (%)

12.5.2 Japan - Market size and forecast 2025-2030

Chart on Japan - Market size and forecast 2025-2030 ($ million)
Data Table on Japan - Market size and forecast 2025-2030 ($ million)
Chart on Japan - Year-over-year growth 2025-2030 (%)
Data Table on Japan - Year-over-year growth 2025-2030 (%)

12.5.3 India - Market size and forecast 2025-2030

Chart on India - Market size and forecast 2025-2030 ($ million)
Data Table on India - Market size and forecast 2025-2030 ($ million)
Chart on India - Year-over-year growth 2025-2030 (%)
Data Table on India - Year-over-year growth 2025-2030 (%)

12.5.4 South Korea - Market size and forecast 2025-2030

Chart on South Korea - Market size and forecast 2025-2030 ($ million)
Data Table on South Korea - Market size and forecast 2025-2030 ($ million)
Chart on South Korea - Year-over-year growth 2025-2030 (%)
Data Table on South Korea - Year-over-year growth 2025-2030 (%)

12.5.5 Indonesia - Market size and forecast 2025-2030

Chart on Indonesia - Market size and forecast 2025-2030 ($ million)
Data Table on Indonesia - Market size and forecast 2025-2030 ($ million)
Chart on Indonesia - Year-over-year growth 2025-2030 (%)
Data Table on Indonesia - Year-over-year growth 2025-2030 (%)

12.5.6 Thailand - Market size and forecast 2025-2030

Chart on Thailand - Market size and forecast 2025-2030 ($ million)
Data Table on Thailand - Market size and forecast 2025-2030 ($ million)
Chart on Thailand - Year-over-year growth 2025-2030 (%)
Data Table on Thailand - Year-over-year growth 2025-2030 (%)

12.5.7 Singapore - Market size and forecast 2025-2030

Chart on Singapore - Market size and forecast 2025-2030 ($ million)
Data Table on Singapore - Market size and forecast 2025-2030 ($ million)
Chart on Singapore - Year-over-year growth 2025-2030 (%)
Data Table on Singapore - Year-over-year growth 2025-2030 (%)

12.6 Rest of World (ROW) - Market size and forecast 2025-2030

Chart on Rest of World (ROW) - Market size and forecast 2025-2030 ($ million)
Data Table on Rest of World (ROW) - Market size and forecast 2025-2030 ($ million)
Chart on Rest of World (ROW) - Year-over-year growth 2025-2030 (%)
Data Table on Rest of World (ROW) - Year-over-year growth 2025-2030 (%)
Chart on Regional Comparison - Rest of World (ROW)
Data Table on Regional Comparison - Rest of World (ROW)

12.6.1 Australia - Market size and forecast 2025-2030

Chart on Australia - Market size and forecast 2025-2030 ($ million)
Data Table on Australia - Market size and forecast 2025-2030 ($ million)
Chart on Australia - Year-over-year growth 2025-2030 (%)
Data Table on Australia - Year-over-year growth 2025-2030 (%)

12.6.2 UAE - Market size and forecast 2025-2030

Chart on UAE - Market size and forecast 2025-2030 ($ million)
Data Table on UAE - Market size and forecast 2025-2030 ($ million)
Chart on UAE - Year-over-year growth 2025-2030 (%)
Data Table on UAE - Year-over-year growth 2025-2030 (%)

12.6.3 Brazil - Market size and forecast 2025-2030

Chart on Brazil - Market size and forecast 2025-2030 ($ million)
Data Table on Brazil - Market size and forecast 2025-2030 ($ million)
Chart on Brazil - Year-over-year growth 2025-2030 (%)
Data Table on Brazil - Year-over-year growth 2025-2030 (%)

12.6.4 South Africa - Market size and forecast 2025-2030

Chart on South Africa - Market size and forecast 2025-2030 ($ million)
Data Table on South Africa - Market size and forecast 2025-2030 ($ million)
Chart on South Africa - Year-over-year growth 2025-2030 (%)
Data Table on South Africa - Year-over-year growth 2025-2030 (%)

12.6.5 Saudi Arabia - Market size and forecast 2025-2030

Chart on Saudi Arabia - Market size and forecast 2025-2030 ($ million)
Data Table on Saudi Arabia - Market size and forecast 2025-2030 ($ million)
Chart on Saudi Arabia - Year-over-year growth 2025-2030 (%)
Data Table on Saudi Arabia - Year-over-year growth 2025-2030 (%)

12.6.6 Turkey - Market size and forecast 2025-2030

Chart on Turkey - Market size and forecast 2025-2030 ($ million)
Data Table on Turkey - Market size and forecast 2025-2030 ($ million)
Chart on Turkey - Year-over-year growth 2025-2030 (%)
Data Table on Turkey - Year-over-year growth 2025-2030 (%)

12.7 Market opportunity by geography

Market opportunity by geography ($ million)
Data Tables on Market opportunity by geography ($ million)

13. Drivers, Challenges, and Opportunity

13.1 Market drivers

Growing geriatric population and rising prevalence of chronic diseases
Increasing popularity of respiratory gas blenders
Rising demand for medical gases for therapeutic and diagnostic applications

13.2 Market challenges

Stringent regulations on design and manufacturing of medical gas blenders
Concerns about maintenance of medical gas blenders
Competition between companies and competitive pricing pressures

13.3 Impact of drivers and challenges

Impact of drivers and challenges in 2025 and 2030

13.4 Market opportunities

Increasing use of respiratory gas blenders in NICUs
Rise in number of hospitals and surgical centers
High growth potential in emerging markets

14. Competitive Landscape

14.1 Overview

14.2

Overview on criticality of inputs and factors of differentiation

14.3 Landscape disruption

Overview on factors of disruption

14.4 Industry risks

Impact of key risks on business

15. Competitive Analysis

15.1 Companies profiled

Companies covered

15.2 Company ranking index

15.3 Market positioning of companies

Matrix on companies position and classification

15.4 BioMed Devices

BioMed Devices - Overview
BioMed Devices - Product / Service
BioMed Devices - Key offerings
SWOT

15.5 EKU Elektronik GmbH

EKU Elektronik GmbH - Overview
EKU Elektronik GmbH - Product / Service
EKU Elektronik GmbH - Key offerings
SWOT

15.6 ESAB Corp.

ESAB Corp. - Overview
ESAB Corp. - Product / Service
ESAB Corp. - Key offerings
SWOT

15.7 Genstar Technologies Co. Inc.

Genstar Technologies Co. Inc. - Overview
Genstar Technologies Co. Inc. - Product / Service
Genstar Technologies Co. Inc. - Key offerings
SWOT

15.8 Halma Plc

Halma Plc - Overview
Halma Plc - Business segments
Halma Plc - Key news
Halma Plc - Key offerings
Halma Plc - Segment focus
SWOT

15.9 HVS Oliver Hornla GmbH

HVS Oliver Hornla GmbH - Overview
HVS Oliver Hornla GmbH - Product / Service
HVS Oliver Hornla GmbH - Key offerings
SWOT

15.10 Inspiration Healthcare Group

Inspiration Healthcare Group - Overview
Inspiration Healthcare Group - Product / Service
Inspiration Healthcare Group - Key offerings
SWOT

15.11 MCQ Instruments

MCQ Instruments - Overview
MCQ Instruments - Product / Service
MCQ Instruments - Key offerings
SWOT

15.12 Medin Medical Innovations

Medin Medical Innovations - Overview
Medin Medical Innovations - Product / Service
Medin Medical Innovations - Key offerings
SWOT

15.13 Ningbo David Medical Device

Ningbo David Medical Device - Overview
Ningbo David Medical Device - Product / Service
Ningbo David Medical Device - Key offerings
SWOT

15.14 Precision Medical Inc.

Precision Medical Inc. - Overview
Precision Medical Inc. - Product / Service
Precision Medical Inc. - Key offerings
SWOT

15.15 Scanatron Technics AG

Scanatron Technics AG - Overview
Scanatron Technics AG - Product / Service
Scanatron Technics AG - Key offerings
SWOT

15.16 TG Eakin Ltd.

TG Eakin Ltd. - Overview
TG Eakin Ltd. - Product / Service
TG Eakin Ltd. - Key offerings
SWOT

15.17 Weyer GmbH

Weyer GmbH - Overview
Weyer GmbH - Product / Service
Weyer GmbH - Key offerings
SWOT

15.18 WITT Gasetechnik GmbH

WITT Gasetechnik GmbH - Overview
WITT Gasetechnik GmbH - Product / Service
WITT Gasetechnik GmbH - Key offerings
SWOT

16. Appendix

16.1 Scope of the report

Market definition
Objectives
Notes and caveats

16.2 Inclusions and exclusions checklist

Inclusions checklist
Exclusions checklist

16.3 Currency conversion rates for US$

16.4 Research methodology

16.5 Data procurement

Information sources

16.6 Data validation

16.7 Validation techniques employed for market sizing

16.8 Data synthesis

16.9 360 degree market analysis

16.10 List of abbreviations

Research Methodology

Technavio presents a detailed picture of the market by way of study, synthesis, and summation of data from multiple sources. The analysts have presented the various facets of the market with a particular focus on identifying the key industry influencers. The data thus presented is comprehensive, reliable, and the result of extensive research, both primary and secondary.

INFORMATION SOURCES

Primary sources

  • Manufacturers and suppliers
  • Channel partners
  • Industry experts
  • Strategic decision makers

Secondary sources

  • Industry journals and periodicals
  • Government data
  • Financial reports of key industry players
  • Historical data
  • Press releases

DATA ANALYSIS

Data Synthesis

  • Collation of data
  • Estimation of key figures
  • Analysis of derived insights

Data Validation

  • Triangulation with data models
  • Reference against proprietary databases
  • Corroboration with industry experts

REPORT WRITING

Qualitative

  • Market drivers
  • Market challenges
  • Market trends
  • Five forces analysis

Quantitative

  • Market size and forecast
  • Market segmentation
  • Geographical insights
  • Competitive landscape

Interested in this report?

Get your sample now to see our research methodology and insights!

Download Now

Frequently Asked Questions

Medical Gas Blenders market growth will increase by USD 797.6 million during 2026-2030.

The Medical Gas Blenders market is expected to grow at a CAGR of 6.5% during 2026-2030.

Medical Gas Blenders market is segmented by End-user (Hospitals, Ambulatory surgical centers, Pharmaceuticals, Homecare settings, Academic and research institutions) Product (Dual flow, Tube flow) Application (Respiratory therapy, Anesthesia, Critical care)

BioMed Devices, DEHAS Medical Systems, EKU Elektronik GmbH, ESAB Corp., Genstar Technologies Co. Inc., Halma Plc, HVS Oliver Hornla GmbH, Inspiration Healthcare Group, MCQ Instruments, Medin Medical Innovations, Ningbo David Medical Device, Pigeon Medical Apparatus, Precision Medical Inc., S S Technomed P Ltd., Scanatron Technics AG, SHANGHAI AMCAREMED TECH, TG Eakin Ltd., Weyer GmbH, WITT Gasetechnik GmbH are a few of the key vendors in the Medical Gas Blenders market.

North America will register the highest growth rate of 42.7% among the other regions. Therefore, the Medical Gas Blenders market in North America is expected to garner significant business opportunities for the vendors during the forecast period.

US, Canada, Mexico, Germany, UK, France, Italy, Spain, The Netherlands, Russia, China, Japan, India, South Korea, Indonesia, Thailand, Singapore, Australia, UAE, Brazil, South Africa, Saudi Arabia, Turkey

  • Growing geriatric population and rising prevalence of chronic diseases is the driving factor this market.

The Medical Gas Blenders market vendors should focus on grabbing business opportunities from the End-user segment as it accounted for the largest market share in the base year.