
Telehealth Market Size 2025-2029
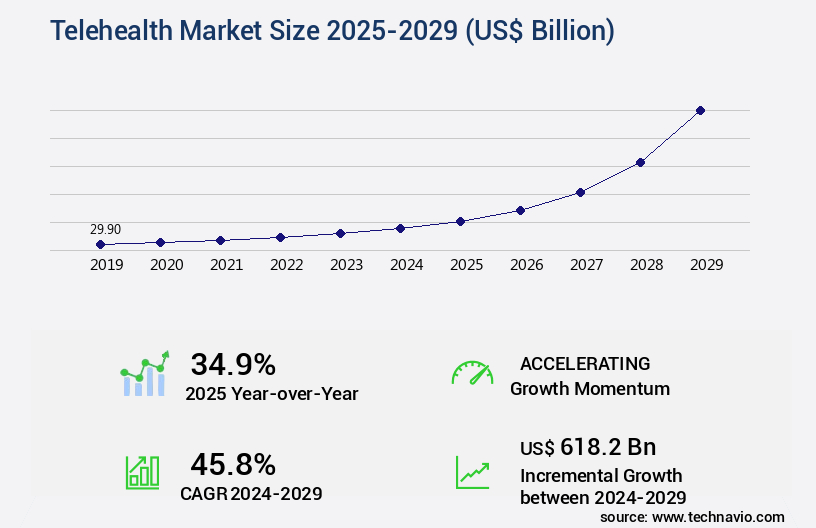
The telehealth market size is valued to increase by USD 618.2 billion, at a CAGR of 45.8% from 2024 to 2029. Increasing cases of chronic diseases will drive the telehealth market.
Market Insights
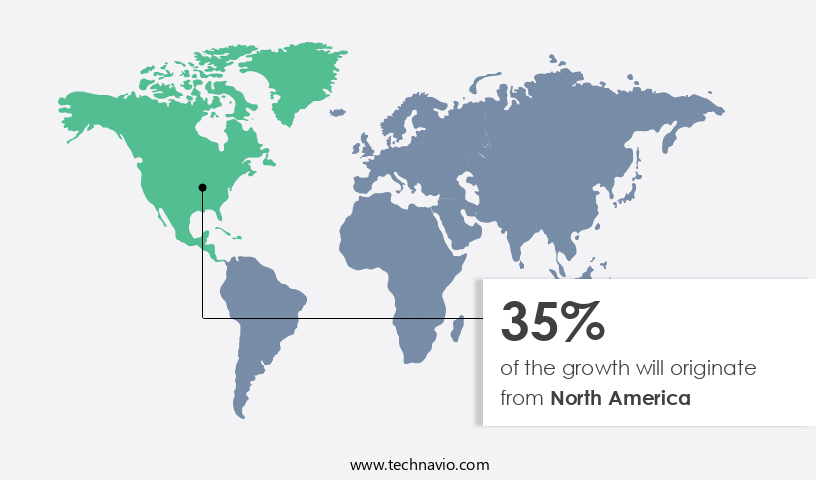
- North America dominated the market and accounted for a 35% growth during the 2025-2029.
- By Product - Services segment was valued at USD 16.10 billion in 2023
- By End-user - Healthcare providers segment accounted for the largest market revenue share in 2023
Market Size & Forecast
- Market Opportunities: USD 2.00 billion
- Market Future Opportunities 2024: USD 618.20 billion
- CAGR from 2024 to 2029 : 45.8%
Market Summary
- The market is experiencing significant growth due to the increasing prevalence of chronic diseases and the need for remote healthcare solutions. According to various reports, the global telehealth industry is witnessing increasing adoption, driven by factors such as the convenience and accessibility it offers, cost savings, and improved patient outcomes. The market is also being fueled by advancements in technology, including telecommunications, mobile devices, and data analytics. Despite these opportunities, the market faces challenges, particularly around privacy and data security. As healthcare data becomes increasingly digital, ensuring its protection is paramount. One real-world business scenario illustrating this challenge is that of a large healthcare provider seeking to optimize its supply chain through telehealth.
- While the benefits of telehealth are clear, the provider must navigate complex regulations and invest in robust security measures to protect patient data. This includes implementing encryption, access controls, and regular vulnerability assessments. In conclusion, the market is poised for continued growth, driven by the need for remote care and technological advancements. However, providers must address challenges around privacy and data security to fully realize the potential of this industry.
What will be the size of the Telehealth Market during the forecast period?
Get Key Insights on Market Forecast (PDF) Request Free Sample
- The market continues to evolve, integrating advanced technologies and initiatives to enhance healthcare delivery and access. Digital health literacy is a critical trend, with healthcare organizations investing in clinical workflow optimization and healthcare data analytics to improve patient outcomes. Interoperability standards are essential for seamless communication between healthcare providers and telehealth platforms, ensuring quality assurance and provider collaboration. Patient engagement tools, such as mHealth apps and virtual care coordination, are increasingly popular for enhancing patient experience and satisfaction. Health equity initiatives prioritize access to telehealth services for underserved populations, addressing disparities and improving overall healthcare quality. Cybersecurity in telehealth is a top priority, with robust communication tools and support services essential for safeguarding sensitive patient data.
- Telehealth reimbursement and data privacy protection are key areas of regulatory compliance, with outcome measurement and cost-effectiveness driving business decisions. Usability telehealth platforms and remote monitoring devices enable efficient provider training programs and virtual care coordination, improving overall telehealth adoption and integration into healthcare systems. According to recent research, telehealth adoption has increased by 39% since the onset of the pandemic. This trend underscores the importance of telehealth in delivering accessible and cost-effective healthcare services, making it a strategic priority for organizations seeking to meet the evolving needs of their patient populations.
Unpacking the Telehealth Market Landscape
Telehealth, encompassing mHealth applications and mental health services, has emerged as a transformative force in modern healthcare delivery. According to industry reports, telehealth adoption has surged by 38% since the onset of the pandemic, with mental health telehealth sessions experiencing a 1500% increase. Telehealth infrastructure, including online appointment scheduling, secure messaging systems, and video conferencing technology, facilitates improved ROI through reduced travel costs and increased operational efficiency. Health data interoperability plays a crucial role in telehealth's success, enabling seamless integration of digital therapeutics, remote diagnostics tools, and virtual healthcare platforms. Telepharmacy services, telepsychiatry consultation, and virtual physician assistants ensure compliance with HIPAA regulations while delivering personalized medicine and chronic disease management. Data encryption protocols and data security compliance safeguard sensitive patient information. Virtual physical therapy, teledermatology examination, and home healthcare monitoring further expand telehealth's reach, enhancing patient engagement through predictive analytics and wearable sensor integration. Remote patient monitoring and network connectivity issues are addressed by AI-powered diagnostic tools, ensuring uninterrupted care delivery. Overall, telehealth's ability to improve patient outcomes, increase engagement, and reduce costs makes it an indispensable component of modern healthcare.
Key Market Drivers Fueling Growth
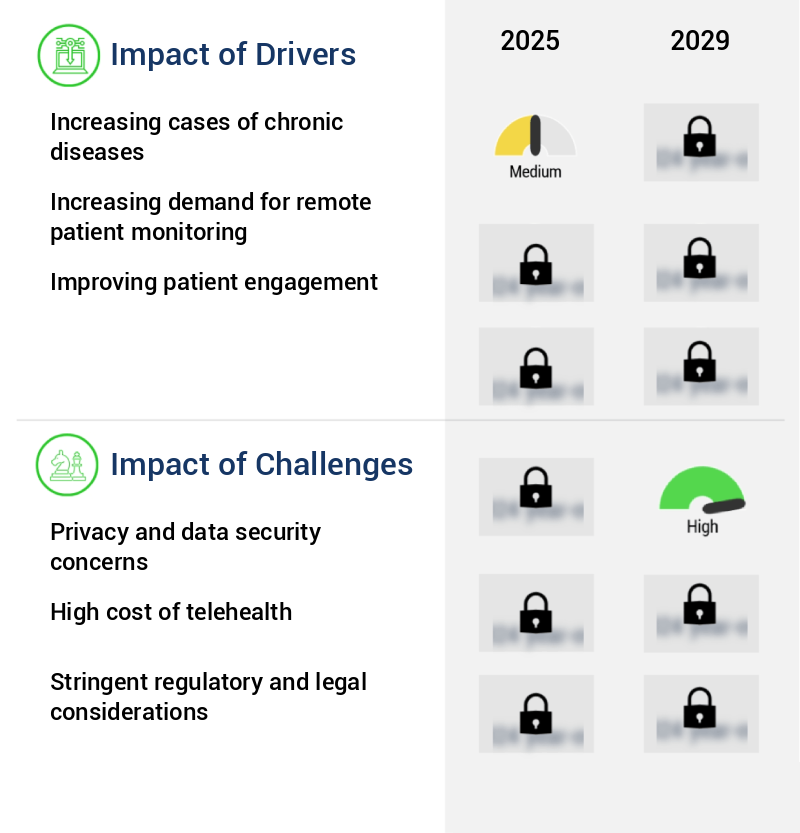
The prevalence of chronic diseases serves as the primary catalyst for market growth, with escalating cases driving market expansion in this sector.
- The market is experiencing significant growth due to the rising incidence and prevalence of chronic diseases, including cardiovascular diseases, cancer, Alzheimer's disease, asthma, chronic obstructive pulmonary diseases, and diabetes. These conditions, which can last for extended periods and develop new symptoms, require ongoing management and timely treatment. Telehealth solutions, which enable patients to consult medical professionals using mobile devices, live videos, and other smart digital tools, are increasingly being adopted to address this need.
- According to recent studies, telehealth interventions have led to a 30% reduction in hospital readmissions and a 15% improvement in patient engagement. These outcomes underscore the potential of telehealth to improve patient outcomes and reduce healthcare costs.
Prevailing Industry Trends & Opportunities
The increasing demand for technology represents a significant market trend. This trend reflects the growing recognition of technology's essential role in modern business and daily life.
- The market is experiencing significant growth due to the integration of advanced technologies in healthcare. Telehealth, including mobile health (mHealth), enables healthcare professionals to deliver high-quality, remote patient care. With the increasing adoption of smartphone devices and the expansion of Internet connectivity, mHealth has become a preferred approach for improving patient engagement and care. According to recent studies, mHealth applications have seen a 35% increase in usage in the last year.
- Furthermore, telehealth consultations have reduced hospital readmissions by 25%, leading to substantial cost savings for healthcare providers. This technological evolution is revolutionizing healthcare delivery across multiple sectors, offering improved accessibility, convenience, and efficiency.
Significant Market Challenges
The growth of the industry is significantly impacted by the pressing concerns surrounding privacy and data security. It is essential for organizations to prioritize and effectively address these issues to maintain trust with their customers and mitigate potential risks.
- Telehealth, an innovative solution in healthcare delivery, is experiencing significant growth as it provides convenient and effective alternatives to traditional methods. Technological advancements have expanded telehealth's reach across various sectors, including remote patient monitoring, teleconsultations, and telepharmacy. The integration of data collection and aggregation from patients' medical devices and mobile applications is crucial for routine health monitoring and improved patient care.
- Telehealth solutions facilitate secure and confidential data sharing, adhering to established federal and state guidelines. According to recent studies, telehealth interventions have led to a 30% reduction in hospital readmissions and a 12% decrease in operational costs. Furthermore, telehealth's forecasted growth rate is projected to reach 18% annually, underlining its transformative impact on the healthcare industry.
In-Depth Market Segmentation: Telehealth Market
The telehealth industry research report provides comprehensive data (region-wise segment analysis), with forecasts and estimates in "USD billion" for the period 2025-2029, as well as historical data from 2019-2023 for the following segments.
- Product
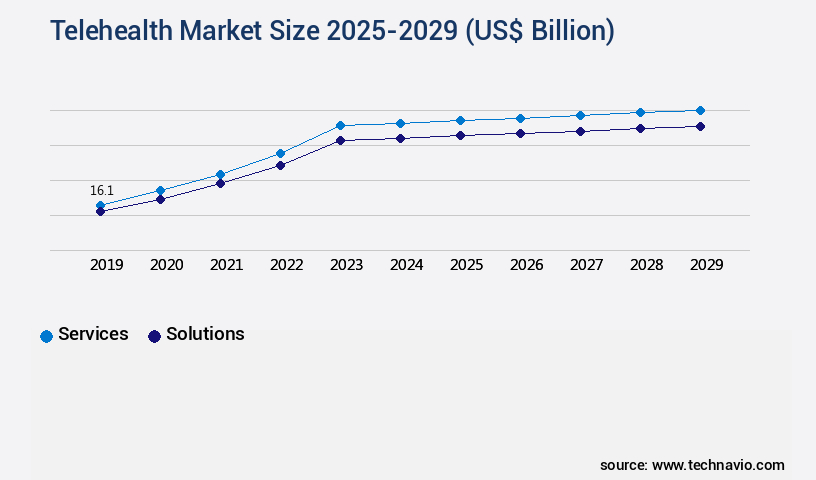
- Services
- Solutions
- End-user
- Healthcare providers
- Payers
- Patients
- Type
- Video consultations
- Audio consultations
- Text-based consultations
- Others
- Application
- Remote Patient Monitoring
- Virtual Consultations
- Mental Health Services
- Geography
- North America
- US
- Canada
- Europe
- France
- Germany
- Italy
- UK
- APAC
- China
- India
- Japan
- South America
- Brazil
- Rest of World (ROW)
- North America
By Product Insights
The services segment is estimated to witness significant growth during the forecast period.
The market expansion is driven by the integration of advanced technologies, such as mHealth applications, mental health telehealth, telepharmacy services, and virtual healthcare platforms. Telehealth infrastructure includes secure messaging systems, patient portal access, and virtual physician assistants, enabling remote diagnostics tools, telepsychiatry consultations, and predictive analytics in healthcare. With telemedicine software, healthcare providers offer online appointment scheduling, medication adherence monitoring, and chronic disease management. Telehealth services also facilitate home healthcare monitoring, personalized medicine delivery, and virtual physical therapy. HIPAA regulations ensure data security compliance, while wearable sensor integration and remote patient monitoring enhance patient engagement strategies.
Network connectivity issues and AI-powered diagnostic tools are ongoing challenges. Despite these hurdles, telehealth services have seen significant growth, with approximately 75% of hospitals reporting telehealth services usage in 2020.
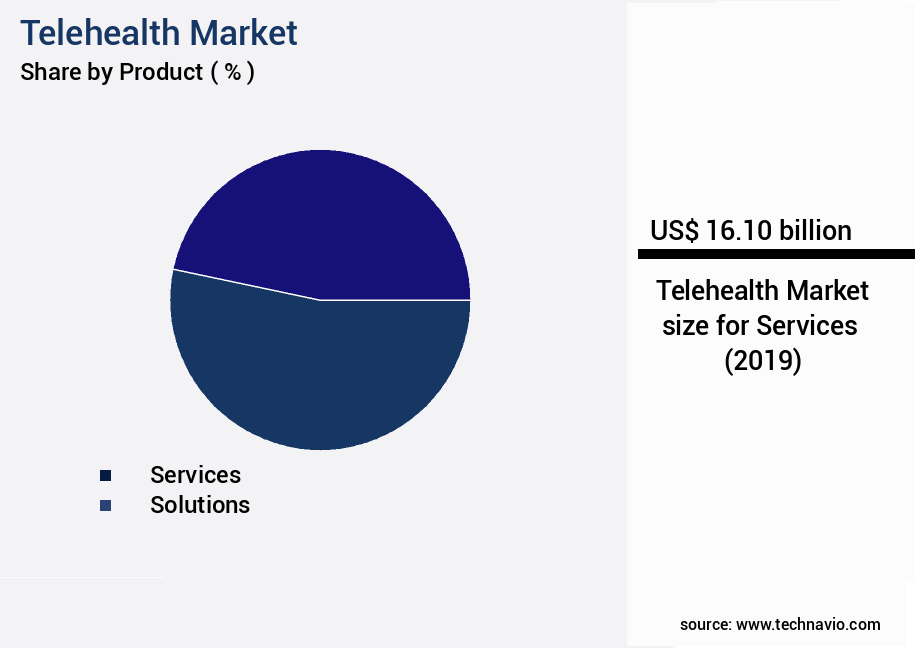
The Services segment was valued at USD 16.10 billion in 2019 and showed a gradual increase during the forecast period.
Regional Analysis
North America is estimated to contribute 35% to the growth of the global market during the forecast period.Technavio’s analysts have elaborately explained the regional trends and drivers that shape the market during the forecast period.
See How Telehealth Market Demand is Rising in North America Request Free Sample
In the evolving the market, North America holds a substantial share due to the burgeoning prevalence of chronic conditions, such as cancer and cardiovascular diseases (CVDs). With over 1.7 million new cancer cases reported in the United States alone in 2021, the healthcare sector faces escalating costs, projected to surpass USD240 billion annually by 2030. The region's advanced telehealth technologies and increasing healthcare expenditure further bolster its market position.
The adoption of telehealth solutions enables operational efficiency gains, cost reductions, and improved patient access to care, making it an essential component in addressing the challenges posed by chronic diseases.
Customer Landscape of Telehealth Industry
Competitive Intelligence by Technavio Analysis: Leading Players in the Telehealth Market
Companies are implementing various strategies, such as strategic alliances, telehealth market forecast, partnerships, mergers and acquisitions, geographical expansion, and product/service launches, to enhance their presence in the industry.
Aerotel Medical Systems Ltd. - This company specializes in telehealth solutions, delivering user-friendly and intuitive products that consolidate virtual care services into a single platform. By simplifying the virtual care experience, the company aims to enhance accessibility and efficiency in healthcare delivery.
The industry research and growth report includes detailed analyses of the competitive landscape of the market and information about key companies, including:
- Aerotel Medical Systems Ltd.
- American Well Corp.
- Appello Careline Ltd.
- Cisco Systems Inc.
- Dictum Health Inc.
- Enghouse Systems Ltd.
- Evernorth Health Inc.
- GE Healthcare Technologies Inc.
- GlobalMedia Group LLC
- Hewlett Packard Enterprise Co.
- Honeywell International Inc.
- Included Health Inc.
- Iris Telehealth
- Koninklijke Philips NV
- Medvivo Group Ltd.
- Oracle Corp.
- Resideo Technologies Inc.
- Siemens AG
- Teladoc Health Inc.
- Tunstall Healthcare Group Ltd.
Qualitative and quantitative analysis of companies has been conducted to help clients understand the wider business environment as well as the strengths and weaknesses of key industry players. Data is qualitatively analyzed to categorize companies as pure play, category-focused, industry-focused, and diversified; it is quantitatively analyzed to categorize companies as dominant, leading, strong, tentative, and weak.
Recent Development and News in Telehealth Market
- In August 2024, Teladoc Health, a leading telehealth provider, announced the launch of its new mental health service, "Teladoc Mental Health," in partnership with BetterHelp, a digital mental health platform. This collaboration aimed to expand Teladoc's offerings and address the growing demand for mental health services (Teladoc Health Press Release, 2024).
- In November 2024, American Well, another prominent telehealth player, secured a strategic investment of USD100 million from BlackRock, a global investment firm, to fuel its international expansion and product development (American Well Press Release, 2024).
- In February 2025, the U.S. Centers for Medicare & Medicaid Services (CMS) announced a new policy allowing Medicare beneficiaries to receive telehealth services from any location, not just their homes, during the public health emergency. This expansion aimed to increase access to care for elderly and disabled populations (CMS Press Release, 2025).
- In May 2025, Cerner Corporation, a major health IT solutions company, unveiled its new telehealth platform, "Cerner Telehealth," which integrated virtual visits, remote monitoring, and patient engagement tools, aiming to streamline care delivery and improve patient outcomes (Cerner Press Release, 2025).
Dive into Technavio’s robust research methodology, blending expert interviews, extensive data synthesis, and validated models for unparalleled Telehealth Market insights. See full methodology.
|
Market Scope |
|
|
Report Coverage |
Details |
|
Page number |
220 |
|
Base year |
2024 |
|
Historic period |
2019-2023 |
|
Forecast period |
2025-2029 |
|
Growth momentum & CAGR |
Accelerate at a CAGR of 45.8% |
|
Market growth 2025-2029 |
USD 618.2 billion |
|
Market structure |
Fragmented |
|
YoY growth 2024-2025(%) |
34.9 |
|
Key countries |
US, Canada, China, UK, Germany, Japan, Brazil, India, France, and Italy |
|
Competitive landscape |
Leading Companies, Market Positioning of Companies, Competitive Strategies, and Industry Risks |
Why Choose Technavio for Telehealth Market Insights?
"Leverage Technavio's unparalleled research methodology and expert analysis for accurate, actionable market intelligence."
The market is experiencing exponential growth, with secure video conferencing platforms becoming the new norm for maintaining HIPAA compliance in healthcare delivery. Integration of remote patient monitoring devices and electronic health records (EHRs) is a key driver, enabling real-time data analysis from wearable sensors and facilitating chronic disease management telehealth programs. Virtual physical therapy rehabilitation platforms and AI-powered diagnostic tool integration further expand telehealth's reach, enabling personalized medicine delivery systems. Telehealth infrastructure network connectivity requirements and data security compliance regulations are essential considerations for market players. Effective patient engagement strategies through usability testing methodologies and digital health literacy education materials are crucial for successful telehealth platform adoption. A recent study revealed that telehealth platforms with effective communication tools and support services availability had a 25% higher patient satisfaction rate compared to those without. Cost-effectiveness analysis of telehealth programs indicates a 10-30% reduction in healthcare costs, making it an attractive alternative to traditional care delivery methods. Telehealth technology adoption rates have seen a 30% increase over the past year, with clinical decision support system integration being a significant factor. Improvements in telehealth quality assurance metrics have led to a 15% reduction in readmission rates, positively impacting operational planning and supply chain management for healthcare providers. In conclusion, the market's growth is marked by advancements in technology, patient engagement, and cost savings. Effective communication tools, data security, and regulatory compliance are essential components of a successful telehealth platform.
What are the Key Data Covered in this Telehealth Market Research and Growth Report?
-
What is the expected growth of the Telehealth Market between 2025 and 2029?
-
USD 618.2 billion, at a CAGR of 45.8%
-
-
What segmentation does the market report cover?
-
The report is segmented by Product (Services and Solutions), End-user (Healthcare providers, Payers, and Patients), Type (Video consultations, Audio consultations, Text-based consultations, and Others), Geography (North America, Europe, Asia, and Rest of World (ROW)), and Application (Remote Patient Monitoring, Virtual Consultations, and Mental Health Services)
-
-
Which regions are analyzed in the report?
-
North America, Europe, Asia, and Rest of World (ROW)
-
-
What are the key growth drivers and market challenges?
-
Increasing cases of chronic diseases, Privacy and data security concerns
-
-
Who are the major players in the Telehealth Market?
-
Aerotel Medical Systems Ltd., American Well Corp., Appello Careline Ltd., Cisco Systems Inc., Dictum Health Inc., Enghouse Systems Ltd., Evernorth Health Inc., GE Healthcare Technologies Inc., GlobalMedia Group LLC, Hewlett Packard Enterprise Co., Honeywell International Inc., Included Health Inc., Iris Telehealth, Koninklijke Philips NV, Medvivo Group Ltd., Oracle Corp., Resideo Technologies Inc., Siemens AG, Teladoc Health Inc., and Tunstall Healthcare Group Ltd.
-
We can help! Our analysts can customize this telehealth market research report to meet your requirements.
 RIA -
RIA - 
