Valves Market Size 2025-2029
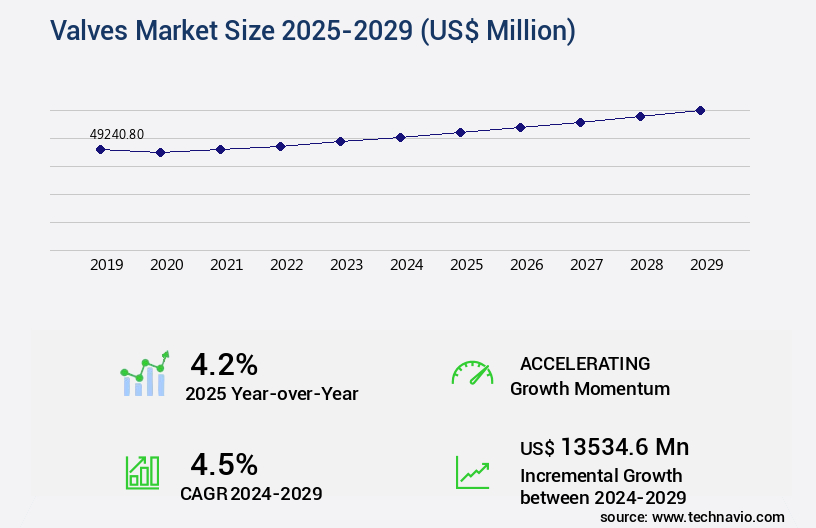
The valves market size is valued to increase USD 13.53 billion, at a CAGR of 4.5% from 2024 to 2029. Industrialization and infrastructure development will drive the valves market.
Major Market Trends & Insights
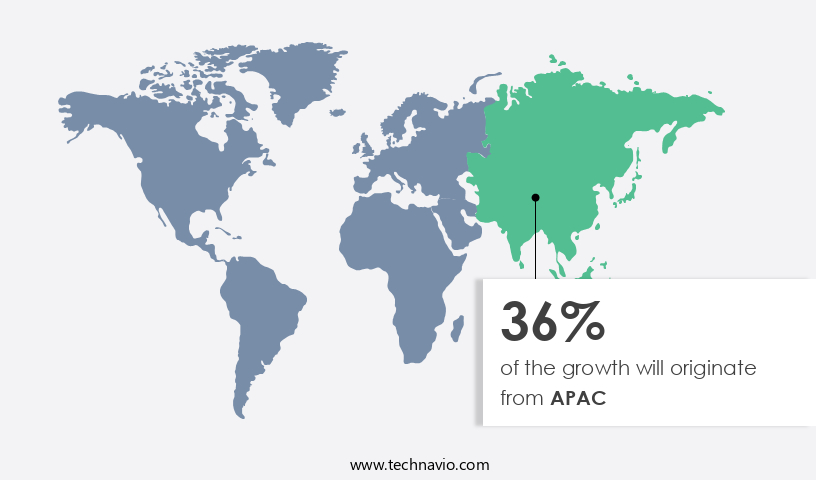
- APAC dominated the market and accounted for a 36% growth during the forecast period.
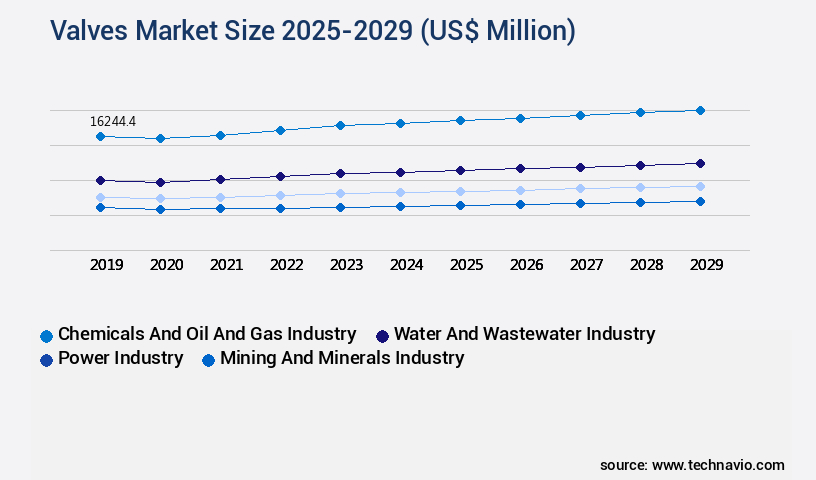
- By End-user - Chemicals and oil and gas industry segment was valued at USD 16.24 billion in 2023
- By Type - Gate segment accounted for the largest market revenue share in 2023
Market Size & Forecast
- Market Opportunities: USD 39.71 billion
- Market Future Opportunities: USD USD 13.53 billion
- CAGR : 4.5%
- APAC: Largest market in 2023
Market Summary
- The market encompasses a diverse range of industries and applications, primarily driven by the ongoing industrialization and infrastructure development worldwide. Core technologies, such as automated valve actuators and smart valve systems, are revolutionizing the sector with enhanced efficiency and reliability. Valves find extensive use in various applications, including oil and gas, water and wastewater, power generation, and chemical processing. The market is marked by intense competition among new and established players, with service types and product categories continually evolving to cater to the evolving demands. Regulations, such as the European Union's Pressure Equipment Directive (PED), play a crucial role in shaping the market landscape.
- As of 2021, industrial valves account for approximately 60% of the global valve market share, with the adoption rate projected to grow steadily in the forecast period. Related markets such as pumps and compressors further underscore the interconnected nature of the industrial ecosystem. The market is an ever-evolving landscape, presenting both opportunities and challenges for stakeholders, including manufacturers, suppliers, and end-users.
What will be the Size of the Valves Market during the forecast period?
Get Key Insights on Market Forecast (PDF) Request Free Sample
How is the Valves Market Segmented and what are the key trends of market segmentation?
The valves industry research report provides comprehensive data (region-wise segment analysis), with forecasts and estimates in "USD million" for the period 2025-2029, as well as historical data from 2019-2023 for the following segments.
- End-user
- Chemicals and oil and gas industry
- Water and wastewater industry
- Power industry
- Mining and minerals industry
- Others
- Type
- Gate
- Globe
- Ball
- Butterfly
- Check and others
- Material Type
- Stainless Steel
- Cast Iron
- Alloy-Based
- Others
- Geography
- North America
- US
- Canada
- Europe
- France
- Germany
- UK
- Middle East and Africa
- UAE
- APAC
- China
- India
- Japan
- South Korea
- South America
- Brazil
- Rest of World (ROW)
- North America
By End-user Insights
The chemicals and oil and gas industry segment is estimated to witness significant growth during the forecast period.
The market experiences significant growth within the chemicals, oil, and gas (COG) industry, accounting for approximately 40% of the total market share. In this sector, valves are indispensable for controlling the flow of fluids and gases in pipelines, tanks, and reactors. These applications demand valves capable of withstanding high pressures, temperatures, and corrosive environments. Actuator selection criteria, such as corrosion resistance, sealing technology, hydraulic valve actuators, actuator efficiency, and valve sizing calculations, are essential considerations for valve applications in the COG industry. Pressure ratings, pressure regulation, check valve functions, temperature ratings, valve positioners, control valve performance, and flow coefficient (cv) are all critical factors that contribute to the efficient and safe operation of these systems.
Pipeline valve configurations, including ball valve designs, gate valve operation, valve diagnostics, system reliability, failure analysis techniques, maintenance schedules, leak detection methods, leakage rate monitoring, flow rate measurement, pressure drop calculations, safety relief valves, butterfly valve mechanisms, electric valve actuators, process control valves, and diaphragm valve features, are continually evolving to meet the demanding requirements of the COG industry. According to recent market studies, the market in the COG industry is projected to expand by 15% in the next three years, driven by the increasing demand for energy and the need for more efficient and reliable valve technologies.
Additionally, the adoption of valve automation technologies, material compatibility testing, and pneumatic valve actuators is expected to further fuel market growth. Valve life cycle management, including ongoing maintenance schedules, is crucial for maximizing the value of these investments and ensuring the long-term performance and reliability of valve systems in the COG industry.
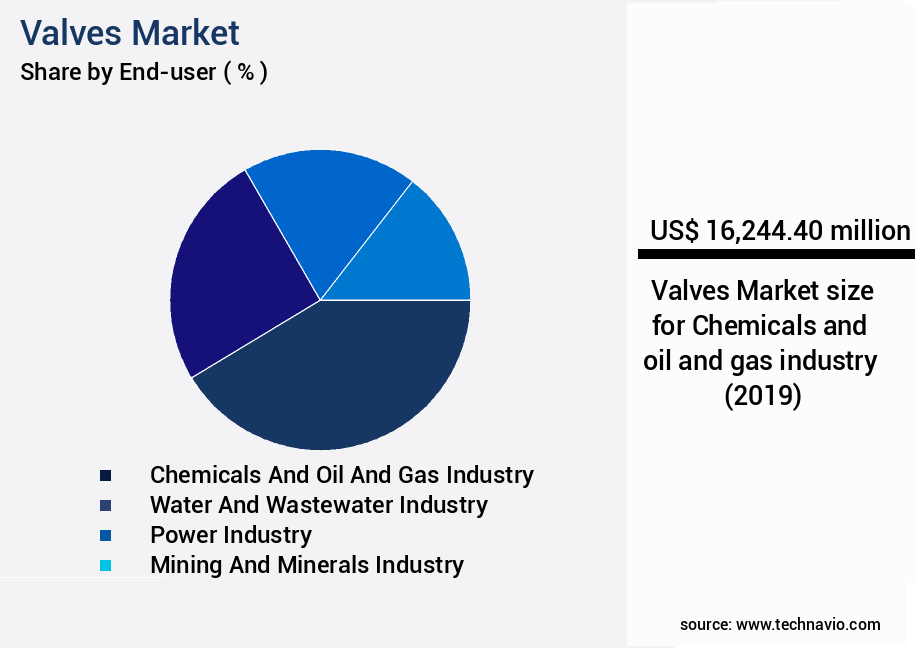
The Chemicals and oil and gas industry segment was valued at USD 16.24 billion in 2019 and showed a gradual increase during the forecast period.
Regional Analysis
APAC is estimated to contribute 36% to the growth of the global market during the forecast period.Technavio’s analysts have elaborately explained the regional trends and drivers that shape the market during the forecast period.
See How Valves Market Demand is Rising in APAC Request Free Sample
In the Asia Pacific (APAC) region, the market is experiencing significant growth due to the increasing industrialization and infrastructural development. Valves are essential components in various industries, including oil and gas, power generation, water and wastewater management, chemicals, and pharmaceuticals, driving the market's expansion. China, Japan, India, and South Korea are the leading players in the APAC the market, with China being both the largest consumer and manufacturer. The oil and gas sector is the primary end-user, accounting for a substantial market share.
According to recent reports, the market in APAC is expected to reach approximately 25 billion dollars in revenue by 2025. Additionally, the water and wastewater management industry is projected to witness a compound annual growth rate (CAGR) of over 5% during the forecast period. These trends indicate the continuous evolution and dynamism of the APAC the market.
Market Dynamics
Our researchers analyzed the data with 2024 as the base year, along with the key drivers, trends, and challenges. A holistic analysis of drivers will help companies refine their marketing strategies to gain a competitive advantage.
The market encompasses a wide range of products, including pneumatic actuator valves, hydraulic valve control systems, electric actuator valves, ball valves, gate valves, globe valves, check valves, butterfly valves, diaphragm valves, pressure relief valves, and flow control valves. These valves serve diverse industries such as oil and gas, water treatment, power generation, and chemical processing. Pneumatic actuator valves require regular maintenance to ensure optimal performance, while hydraulic valve control systems demand intricate design considerations for efficient operation. Electric actuator valves necessitate troubleshooting expertise to address potential issues. In high-pressure applications, gate valve design plays a crucial role, while globe valve selection for water treatment applications hinges on specific criteria.
Check valve performance in high-flow systems is essential for system reliability, and butterfly valve sizing for chemical processing applications necessitates precision. Diaphragm valve material selection for corrosion resistance is a critical factor in their application, and pressure relief valve sizing for safety systems is a matter of life and death. Flow control valve performance optimization is a continuous process, and automated valve control system integration is the future of industrial valve operation. Valve positioner calibration procedures are essential for accurate valve positioning, and predictive maintenance for industrial valves can significantly reduce downtime and maintenance costs. Leak detection methods for pipeline valves are vital for maintaining pipeline integrity, and pressure drop calculations for complex valve systems are essential for system efficiency.
System reliability analysis for valve networks is a critical aspect of maintaining overall system performance, and valve life cycle cost analysis is a crucial factor in determining the total cost of ownership for valve installations. When comparing the market share of various valve types, ball valves held a 35% share in 2020, while gate valves accounted for 28% of the market. Globe valves and check valves each claimed 15% of the market, with butterfly valves and diaphragm valves capturing 12% and 10%, respectively. Pressure relief valves and flow control valves accounted for the remaining 10% of the market. This data underscores the importance of each valve type in the overall the market landscape.
What are the key market drivers leading to the rise in the adoption of Valves Industry?
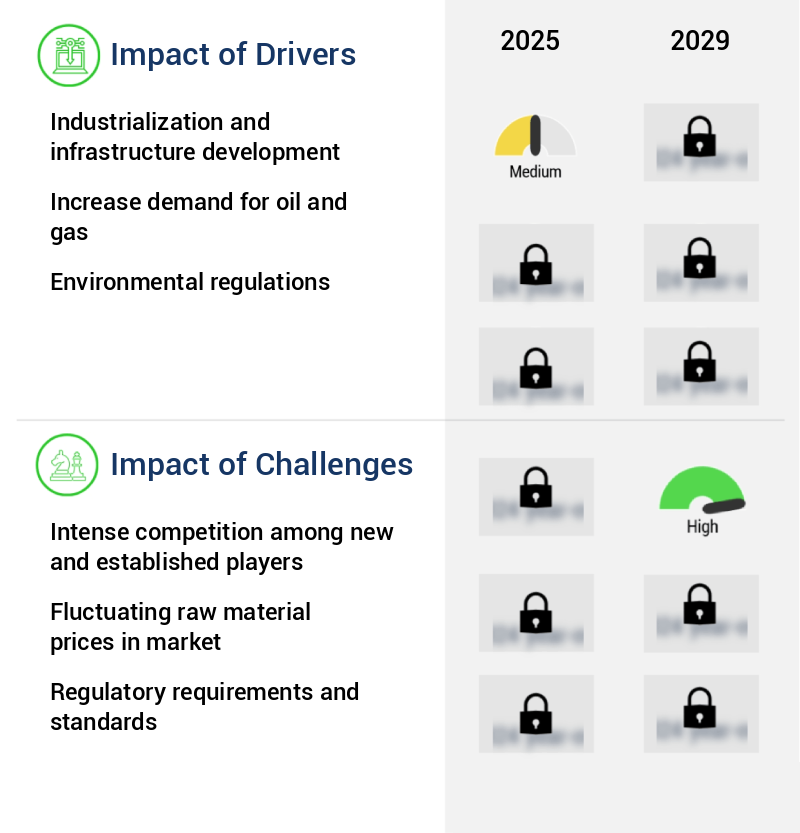
- Industrialization and infrastructure development serve as the primary catalyst for market growth.
- The market is experiencing significant growth due to ongoing industrialization and infrastructure development initiatives, particularly in emerging nations across Asia-Pacific and the Middle East and Africa. These regions are witnessing a surge in new power plants, refineries, and pipelines, all requiring a substantial number of valves for controlling and regulating fluid and gas flow. Valves play a pivotal role in various industries, including oil and gas, electricity production, water treatment, and chemical processing, making them indispensable components in the infrastructure development process.
- As industrialization continues to unfold, the demand for valves is expected to remain robust, driving market expansion in the coming years. Valves serve a critical function in managing fluid and gas flow, making them essential for numerous industries undergoing growth and modernization.
What are the market trends shaping the Valves Industry?
- The increasing demand for industrial valves represents a notable market trend. Market trends indicate a rising demand for industrial valves.
- The market experiences significant growth due to the increasing demand in various industries, including oil and gas, chemical, power generation, water and wastewater treatment, and more. Industrial valves are essential components in regulating the flow of fluids such as liquids, gases, and slurries, contributing to numerous industrial processes. The market's expansion is driven by the ongoing industrialization and urbanization trends, leading to the construction of new infrastructure and the need for resources like energy and water.
- As a result, the demand for valves continues to rise, with industries relying on them to optimize processes and ensure efficiency. This data-driven trend underscores the market's importance and its potential for continued growth in the business landscape.
What challenges does the Valves Industry face during its growth?
- The intense competition among new and established industry players poses a significant challenge to growth, requiring continuous innovation and strategic adaptation from companies to maintain a competitive edge.
- In the dynamic and evolving global the market, intense competition persists as numerous players strive for market dominance. With low entry barriers and simple production processes, new entrants and established firms face challenges in maintaining their market presence. According to recent reports, The market is expected to exhibit significant growth, with indexed sales reaching approximately 120 billion USD by 2025, representing a substantial increase from 2020.
- This growth can be attributed to the rising demand for valves across various industries, including oil and gas, water and wastewater, and power generation. Despite the competition, companies continue to invest in research and development to innovate and differentiate their offerings, ensuring the market remains vibrant and competitive.
Exclusive Customer Landscape
The valves market forecasting report includes the adoption lifecycle of the market, covering from the innovator’s stage to the laggard’s stage. It focuses on adoption rates in different regions based on penetration. Furthermore, the valves market report also includes key purchase criteria and drivers of price sensitivity to help companies evaluate and develop their market growth analysis strategies.

Customer Landscape of Valves Industry
Competitive Landscape & Market Insights
Companies are implementing various strategies, such as strategic alliances, valves market forecast, partnerships, mergers and acquisitions, geographical expansion, and product/service launches, to enhance their presence in the industry.
Emerson - This company specializes in the production and distribution of various valve types, including ball valves, butterfly valves, control valves, check valves, double seal valves, and regulating valves, catering to diverse industries with a commitment to quality and innovation.
The industry research and growth report includes detailed analyses of the competitive landscape of the market and information about key companies, including:
- Emerson
- Flowserve
- Cameron (Schlumberger)
- IMI plc
- Crane Co.
- Kitz Corporation
- Velan
- Spirax-Sarco
- Weir Group
- AVK Group
- Pentair
- Honeywell
- Danfoss
- Mueller Water Products
- Swagelok
- Parker Hannifin
- Circor International
- Bray International
- Alfa Laval
- Samson Controls
Qualitative and quantitative analysis of companies has been conducted to help clients understand the wider business environment as well as the strengths and weaknesses of key industry players. Data is qualitatively analyzed to categorize companies as pure play, category-focused, industry-focused, and diversified; it is quantitatively analyzed to categorize companies as dominant, leading, strong, tentative, and weak.
Recent Development and News in Valves Market
- In January 2024, Emerson Electric Company, a leading global technology and engineering firm, announced the launch of its new Micro Motion Coriolis flowmeter, which integrates with its Fisher valve portfolio, enhancing process control and efficiency in the oil and gas industry (Emerson Electric Company Press Release).
- In March 2024, Schneider Electric, a French multinational energy management corporation, entered into a strategic partnership with Metso Outotec, a Finnish mining and minerals processing technology company, to develop and commercialize integrated automation and electrification solutions for the mining industry, including valve control systems (Schneider Electric Press Release).
- In April 2025, Cameron, a leading global energy equipment and services provider, completed the acquisition of Valtek, a US-based manufacturer of control valves and automation solutions, expanding its product portfolio and market reach in the oil and gas, power generation, and industrial markets (Cameron Press Release).
- In May 2025, the European Union approved the revised Water Framework Directive, which includes stricter regulations on the use and disposal of valves containing per- and polyfluoroalkyl substances (PFAS), driving the market towards the adoption of PFAS-free valve technologies (European Commission Press Release).
Dive into Technavio’s robust research methodology, blending expert interviews, extensive data synthesis, and validated models for unparalleled Valves Market insights. See full methodology.
|
Market Scope |
|
|
Report Coverage |
Details |
|
Page number |
238 |
|
Base year |
2024 |
|
Historic period |
2019-2023 |
|
Forecast period |
2025-2029 |
|
Growth momentum & CAGR |
Accelerate at a CAGR of 4.5% |
|
Market growth 2025-2029 |
USD 13534.6 million |
|
Market structure |
Fragmented |
|
YoY growth 2024-2025(%) |
4.2 |
|
Key countries |
US, China, India, Japan, Germany, UK, South Korea, Brazil, Canada, France, Rest of World, and UAE |
|
Competitive landscape |
Leading Companies, Market Positioning of Companies, Competitive Strategies, and Industry Risks |
Research Analyst Overview
- In the dynamic and evolving landscape of flow control systems, the selection criteria for actuators in various valve applications continue to shape market activities. Globe valves, renowned for their flow control capabilities, often require corrosion-resistant actuators due to their extensive use in harsh environments. Sealing technology plays a crucial role in actuator efficiency, with hydraulic valve actuators benefiting from advanced sealing solutions. Valve sizing calculations and pressure ratings are essential factors in actuator selection. Pressure regulation and check valve functions necessitate actuators capable of handling varying pressure levels. Temperature ratings are another consideration, as extreme temperatures can impact actuator performance.
- Valve positioners and control valve performance are also significant market drivers. The flow coefficient (CV) and pipeline valve configurations influence actuator selection. Ball valve designs and gate valve operation require actuators that can accommodate their unique characteristics. Valve diagnostics, system reliability, and failure analysis techniques necessitate advanced actuator technologies. Maintenance schedules and leak detection methods rely on actuators with high leakage rate monitoring capabilities. Flow rate measurement and pressure drop calculations are critical applications for actuators in process control valves. Safety relief valves and butterfly valve mechanisms require actuators that can handle the specific demands of these applications.
- Electric valve actuators and diaphragm valve features are shaping the market with their technological advancements. Valve automation technologies and valve life cycle management are key areas of focus for actuator manufacturers. Material compatibility testing and pneumatic valve actuators are essential components of the evolving valve market. The ongoing development of valve actuator technologies reflects the continuous unfolding of market activities and evolving patterns.
What are the Key Data Covered in this Valves Market Research and Growth Report?
-
What is the expected growth of the Valves Market between 2025 and 2029?
-
USD 13.53 billion, at a CAGR of 4.5%
-
-
What segmentation does the market report cover?
-
The report segmented by End-user (Chemicals and oil and gas industry, Water and wastewater industry, Power industry, Mining and minerals industry, and Others), Type (Gate, Globe, Ball, Butterfly, and Check and others), Geography (APAC, Europe, North America, Middle East and Africa, and South America), and Material Type (Stainless Steel, Cast Iron, Alloy-Based, and Others)
-
-
Which regions are analyzed in the report?
-
APAC, Europe, North America, Middle East and Africa, and South America
-
-
What are the key growth drivers and market challenges?
-
Industrialization and infrastructure development, Intense competition among new and established players
-
-
Who are the major players in the Valves Market?
-
Key Companies Emerson, Flowserve, Cameron (Schlumberger), IMI plc, Crane Co., Kitz Corporation, Velan, Spirax-Sarco, Weir Group, AVK Group, Pentair, Honeywell, Danfoss, Mueller Water Products, Swagelok, Parker Hannifin, Circor International, Bray International, Alfa Laval, and Samson Controls
-
Market Research Insights
- The market encompasses a diverse range of products and applications, including process piping valves, pressure reducing valves, and power generation valves, among others. According to industry estimates, the global market for valves is projected to reach USD120 billion by 2025, growing at a compound annual growth rate of 4%. This expansion is driven by the increasing demand for remote valve operation, automated valve control, and predictive maintenance in various industries, such as power generation, water treatment, and chemical processing. Valve calibration plays a crucial role in ensuring optimal performance and efficiency. For instance, high-pressure valves require precise pressure relief settings to prevent damage and maintain seal integrity.
- In contrast, low-pressure valves, such as flow limiting valves, necessitate careful valve component selection and back pressure regulation to maintain accurate flow control algorithms. The integration of advanced technologies, such as flow control algorithms and valve diagnostics software, further enhances the functionality and reliability of valve systems.
We can help! Our analysts can customize this valves market research report to meet your requirements.
 RIA -
RIA - 
