Sanitary Pumps Market Analysis, Size, and Forecast 2026-2030: APAC (China, Japan, and India), Europe (Germany, France, and UK), North America (US, Canada, and Mexico), South America (Brazil and Argentina), Middle East and Africa (Saudi Arabia, South Africa, and UAE), and Rest of World (ROW)

Sanitary Pumps Market Analysis, Size, and Forecast 2026-2030:
APAC (China, Japan, and India), Europe (Germany, France, and UK), North America (US, Canada, and Mexico), South America (Brazil and Argentina), Middle East and Africa (Saudi Arabia, South Africa, and UAE), and Rest of World (ROW)

Published: Mar 2026 314 Pages SKU: IRTNTR41160

Market Overview at a Glance

$611.4 Mn
Market Opportunity
4.2%
CAGR 2025 - 2030
57.1%
APAC Growth
$1.57 B
Kinetic sanitary pumps segment 2024

Sanitary Pumps Market Size 2026-2030

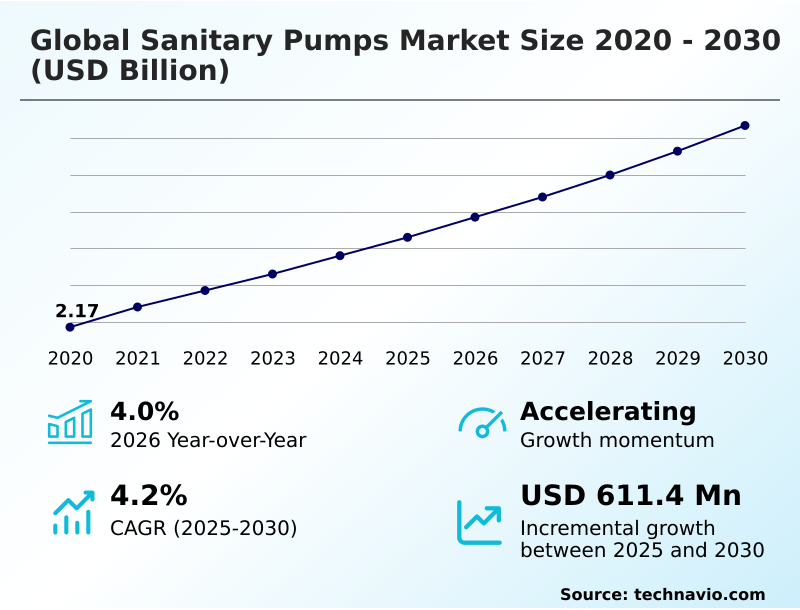
The sanitary pumps market size is valued to increase by USD 611.4 million, at a CAGR of 4.2% from 2025 to 2030. Escalating stringency of regulatory frameworks and hygiene standards will drive the sanitary pumps market.

Major Market Trends & Insights

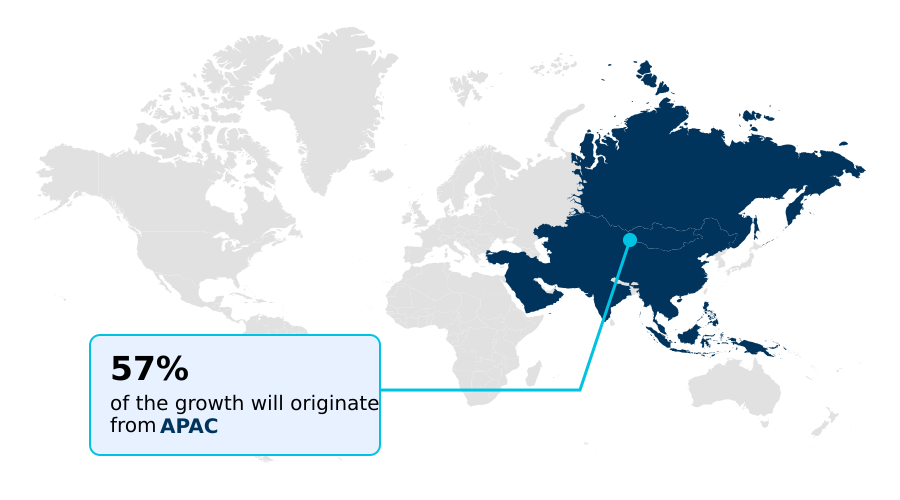
  • APAC dominated the market and accounted for a 57.1% growth during the forecast period.
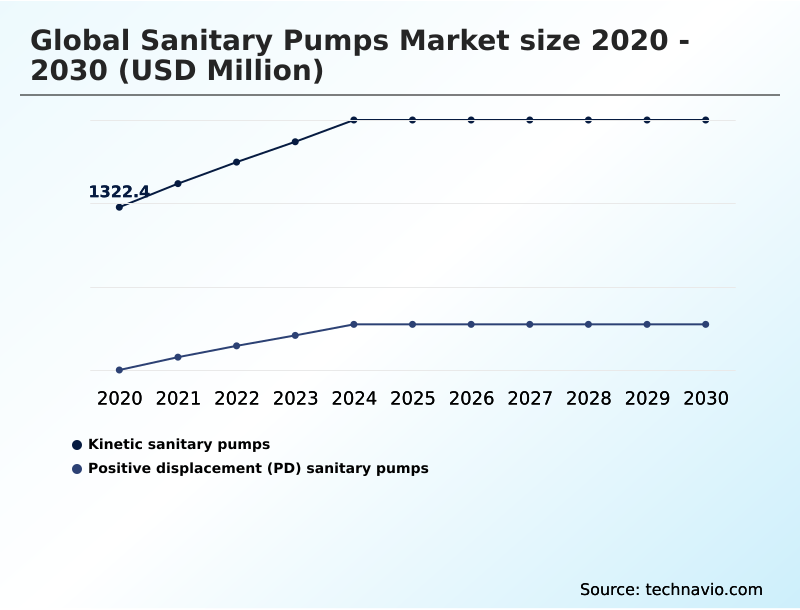
  • By Type - Kinetic sanitary pumps segment was valued at USD 1.57 billion in 2024
  • By End-user - Food and beverage segment accounted for the largest market revenue share in 2024

Market Size & Forecast

  • Market Opportunities: USD 1.10 billion
  • Market Future Opportunities: USD 611.4 million
  • CAGR from 2025 to 2030 : 4.2%

Market Summary

  • The sanitary pumps market is fundamentally shaped by non-negotiable requirements for hygiene and product integrity in contamination-sensitive industries. Growth is propelled by the sustained expansion of the food and beverage, pharmaceutical, and biotechnology sectors, where increasingly stringent regulatory standards from bodies like the FDA and EHEDG mandate the use of certified equipment.
  • This drive for compliance, coupled with a focus on operational efficiency, pushes for technological innovation in aseptic fluid handling and sanitary fluid management. A key trend transforming the landscape is the integration of smart technologies and IoT, shifting pumps from mechanical components to intelligent, data-generating assets.
  • For instance, a biopharmaceutical firm can leverage a system with predictive maintenance sensors to pre-empt equipment failure in a continuous manufacturing line, preventing the loss of a high-value biologics batch and ensuring uninterrupted production.
  • While demand is robust, the market faces challenges from the high initial capital expenditure and the total cost of ownership, alongside intense price pressures from a fragmented competitive landscape. The rise of single-use technologies in bioprocessing further diversifies equipment demands, compelling manufacturers to innovate continuously to maintain their market position.

What will be the Size of the Sanitary Pumps Market during the forecast period?

Get Key Insights on Market Forecast (PDF) Request Free Sample

How is the Sanitary Pumps Market Segmented?

The sanitary pumps industry research report provides comprehensive data (region-wise segment analysis), with forecasts and estimates in "USD million" for the period 2026-2030, as well as historical data from 2020-2024 for the following segments.

  • Type
    • Kinetic sanitary pumps
    • Positive displacement (PD) sanitary pumps
  • End-user
    • Food and beverage
    • Pharmaceutical and biotechnology applications
    • Others
  • Material
    • Stainless steel
    • Plastic
    • Hastelloy
    • Others
  • Geography
    • APAC
      • China
      • Japan
      • India
    • Europe
      • Germany
      • France
      • UK
    • North America
      • US
      • Canada
      • Mexico
    • South America
      • Brazil
      • Argentina
    • Middle East and Africa
      • Saudi Arabia
      • South Africa
      • UAE
    • Rest of World (ROW)

By Type Insights

The kinetic sanitary pumps segment is estimated to witness significant growth during the forecast period.

The market is segmented by core operational principles, with kinetic sanitary pumps—predominantly the centrifugal sanitary pump—holding a major share.

These pumps excel at high-volume, hygienic fluid transfer of low-viscosity liquids, making them a staple in beverage production and for clean-in-place (CIP) systems. Their design simplicity ensures cost-effectiveness and reliability, with modern iterations being highly CIP-able centrifugal pump models.

However, they are less suitable for applications requiring aseptic processing with delicate materials, unlike a low-shear pump for biologics or a sanitary pump for high viscosity liquids.

Their high-shear nature can compromise shear-sensitive products, a limitation that has been shown to impact product integrity by up to 15% in certain applications, reinforcing the need for alternative technologies in specific contexts.

Request Free Sample

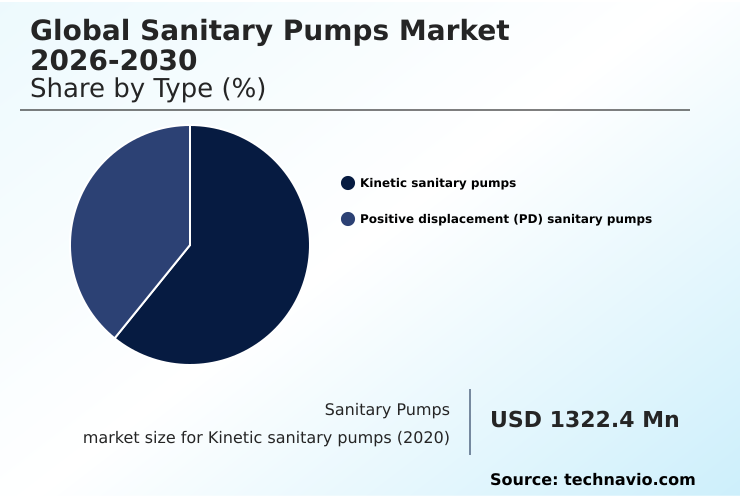
The Kinetic sanitary pumps segment was valued at USD 1.57 billion in 2024 and showed a gradual increase during the forecast period.

Request Free Sample

Regional Analysis

APAC is estimated to contribute 57.1% to the growth of the global market during the forecast period.Technavio’s analysts have elaborately explained the regional trends and drivers that shape the market during the forecast period.

See How Sanitary Pumps Market Demand is Rising in APAC Request Free Sample

The global landscape is led by the APAC region, which accounts for over 57% of the market's incremental growth, driven by rapid industrialization and escalating food safety standards.

This region sees significant investment in food processing pumps and beverage transfer pumps.

North America and Europe are mature markets characterized by a strong focus on technological advancement and adherence to stringent regulations, creating consistent demand for biopharmaceutical processing pumps and advanced aseptic pump technology.

Innovations in sanitary process engineering and hygienic component design are key competitive differentiators. For example, using fluid dynamic simulation to optimize impeller design in sanitary centrifugal pumps has resulted in efficiency gains of over 10%.

These mature regions prioritize total cost of ownership and advanced features, fueling demand for high-performance high-purity fluid systems.

Market Dynamics

Our researchers analyzed the data with 2025 as the base year, along with the key drivers, trends, and challenges. A holistic analysis of drivers will help companies refine their marketing strategies to gain a competitive advantage.

  • Strategic decision-making in the market hinges on understanding the nuances between different technologies and their impact on operational outcomes. A frequent evaluation is the choice between kinetic vs positive displacement sanitary pumps, where the former is ideal for bulk transfer of low-viscosity fluids, while the latter excels in precise dosing and handling challenging materials.
  • For instance, a centrifugal pump for low viscosity fluids is standard in beverage lines, whereas a twin-screw pump for solids handling is essential for products with particulates. The impact of surface finish on cleanability is a critical factor influencing both compliance and operational uptime, directly affecting the effectiveness and cost of validating CIP cycles for pumps.
  • In biopharma, the rise of single-use technology in biopharma pumps is driven by risk mitigation, with a low-shear pump for cell culture transfer being crucial for maintaining cell viability. This contrasts with traditional stainless-steel systems, where preventing issues like pump cavitation prevention in sanitary systems and addressing sanitary pump seal failure analysis are key maintenance priorities.
  • Evaluating the energy consumption of sanitary pumps is central to reducing the total cost of ownership. Implementing a variable frequency drive pump benefits operations by matching energy use to process demand, a key factor when optimizing pump selection for TCO.
  • The growth of smart technology enables predictive maintenance in smart pumps, which can reduce downtime more effectively than reactive approaches by a factor of two. Understanding material selection for corrosive food products and the challenges in pumping high viscosity pastes informs the design of robust systems for applications like sanitary pump for dairy processing applications.
  • Key considerations like ehedg vs 3-a certification differences and the use of peristaltic pumps in pharmaceutical dosing for the sanitary pump for beverage carbonation process further define procurement strategies.

What are the key market drivers leading to the rise in the adoption of Sanitary Pumps Industry?

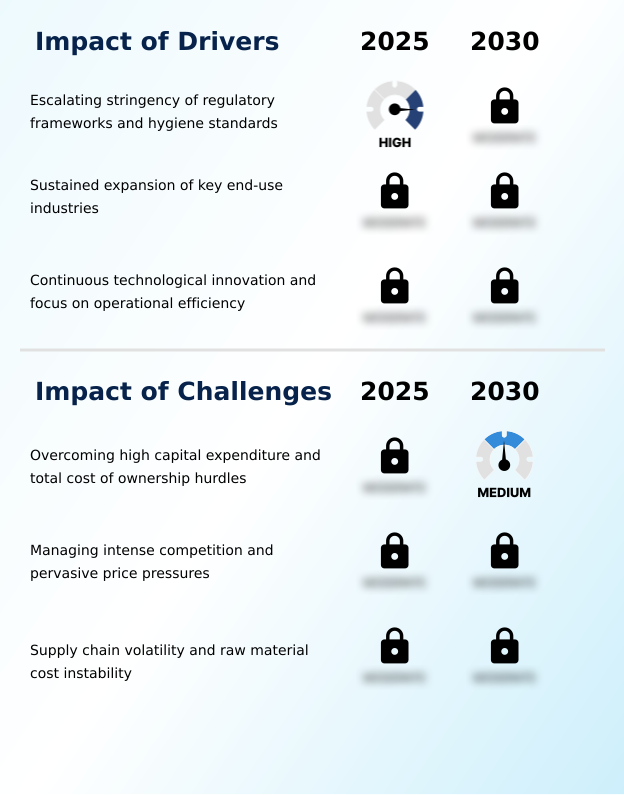
  • The escalating stringency of regulatory frameworks and hygiene standards across key end-use industries is a primary driver for market growth.

  • Sustained expansion of end-use industries, including food, biopharma, and cosmetics, is a fundamental market driver. The growing demand for processed foods and complex biopharmaceuticals necessitates advanced solutions for viscous product transfer and low-shear fluid handling.
  • This directly fuels investment in equipment like the 3-A compliant lobe pump and specialized pumps for biologics. A crucial driver is the relentless pace of technological innovation, focusing on hydraulic efficiency optimization and lower lifecycle costs.
  • The integration of a variable frequency drive (VFD) can reduce energy consumption by up to 30% in variable flow applications.
  • Furthermore, the push for ASME-BPE compliance in pharmaceutical manufacturing drives demand for high-purity equipment, including the sealless sanitary pump design and systems with integrated predictive maintenance sensors to ensure process integrity, especially for single-use pump systems.
  • A self-priming sanitary pump, high-pressure sanitary pump, and EHEDG certified centrifugal pump are essential for applications like sanitary pump for cosmetic creams.

What are the market trends shaping the Sanitary Pumps Industry?

  • The proliferation of intelligent pumping solutions and digitalization is a defining market trend. It marks a shift toward data-driven operational excellence and predictive maintenance capabilities.

  • The adoption of a single-use pump for bioprocessing is a transformative trend, driven by the need to eliminate cross-contamination risks. This is spurring innovation in technologies like the peristaltic pump head and quaternary diaphragm pump, designed for disposable fluid paths.
  • Concurrently, digitalization is leading to the proliferation of the smart pump with IoT monitoring, which enhances process control and enables predictive maintenance, with some systems demonstrating a 20% reduction in unplanned downtime. Another key trend is the intensified focus on sustainability, pushing demand for the energy-efficient sanitary pump.
  • This is complemented by advancements in materials and design, such as twin-screw pump technology for handling delicate solids and the use of 316L stainless steel with a superior sanitary pump with electropolished finish to improve cleanability and adhere to strict EHEDG guidelines and 3-A sanitary standards for a pump for shear-sensitive fluids in aseptic pump for dairy processing.

What challenges does the Sanitary Pumps Industry face during its growth?

  • A key challenge affecting industry growth is overcoming the significant capital expenditure and total cost of ownership associated with advanced sanitary equipment.

  • A primary market challenge is the high capital expenditure and the broader sanitary pump total cost of ownership (TCO). While premium hygienic process pumps offer long-term benefits like a crevice-free internal design and superior self-draining capability, their initial cost can be a barrier.
  • This issue is compounded by intense price competition from low-cost manufacturers, which can erode margins and limit R&D investment. Supply chain volatility presents another hurdle, with fluctuating raw material costs impacting production expenses by as much as 15% in certain quarters.
  • Managing these instabilities while ensuring consistent quality for applications like sterile fluid transfer requires sophisticated sanitary fluid management, especially for components like the positive displacement pump for paste, sanitary transfer pumps, pump for abrasive sanitary fluids, and the variable speed sanitary pump.
  • A hygienic pump for beverage production requires a non-pulsating flow and a reliable pump for clean-in-place systems for effective aseptic fluid handling.

Exclusive Technavio Analysis on Customer Landscape

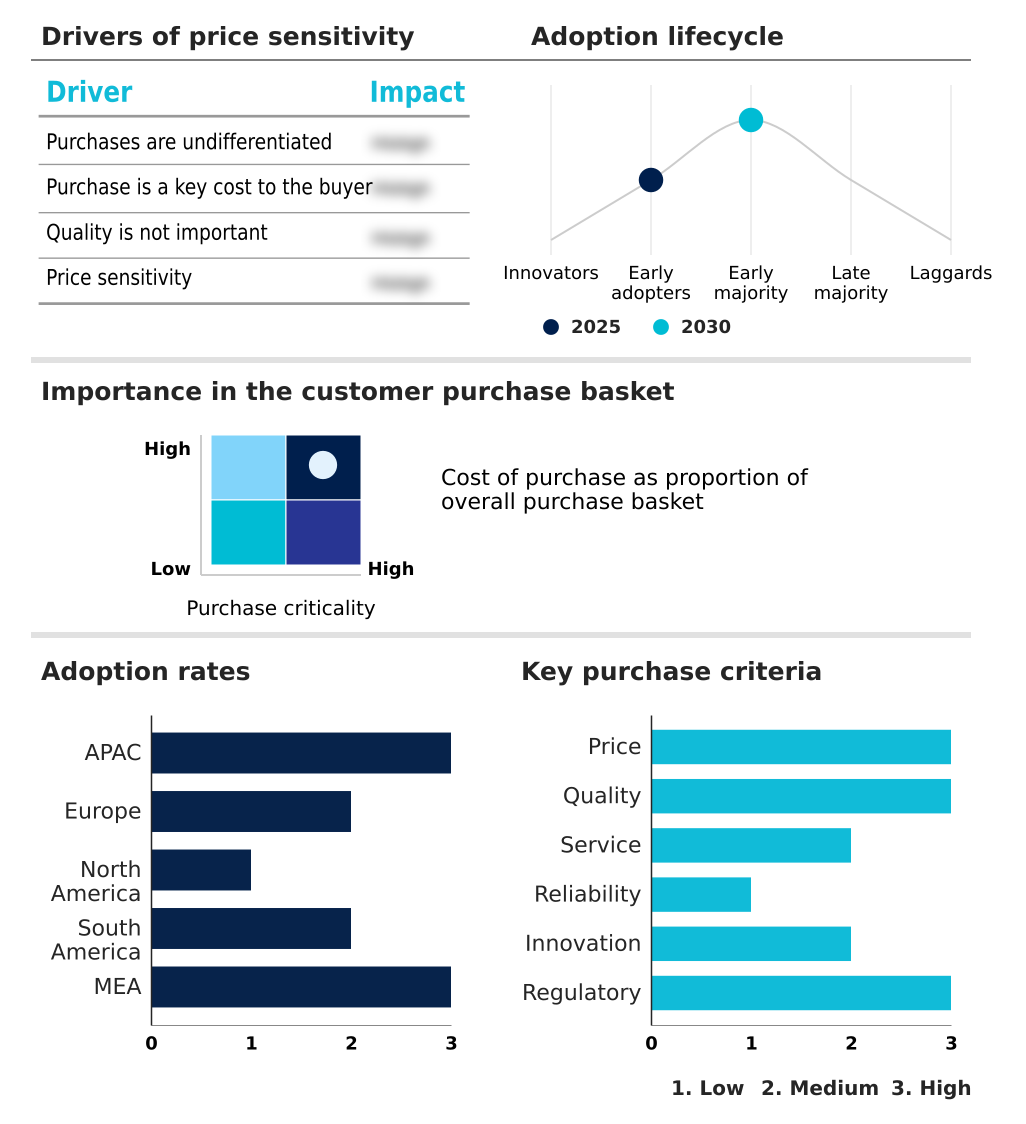
The sanitary pumps market forecasting report includes the adoption lifecycle of the market, covering from the innovator’s stage to the laggard’s stage. It focuses on adoption rates in different regions based on penetration. Furthermore, the sanitary pumps market report also includes key purchase criteria and drivers of price sensitivity to help companies evaluate and develop their market growth analysis strategies.

Customer Landscape of Sanitary Pumps Industry

Competitive Landscape

Companies are implementing various strategies, such as strategic alliances, sanitary pumps market forecast, partnerships, mergers and acquisitions, geographical expansion, and product/service launches, to enhance their presence in the industry.

Alfa Laval AB - Offerings feature advanced centrifugal and twin screw pump technologies engineered for high-purity fluid handling and demanding process applications.

The industry research and growth report includes detailed analyses of the competitive landscape of the market and information about key companies, including:

  • Alfa Laval AB
  • Ampco Pumps Co.
  • Axiflow Technologies Inc.
  • Erich NETZSCH BV and Co.
  • Fristam
  • GEA Group AG
  • Goulds Pumps
  • IDEX Corp.
  • INOXPA USA Inc.
  • KSB SE and Co. KGaA
  • LEWA GmbH
  • NOV Inc.
  • Pentair Plc
  • PSG Dover
  • Q Pumps
  • Spirax Group
  • SPX FLOW Inc.
  • Sulzer Ltd.
  • Verder Liquids
  • Xylem Inc.

Qualitative and quantitative analysis of companies has been conducted to help clients understand the wider business environment as well as the strengths and weaknesses of key industry players. Data is qualitatively analyzed to categorize companies as pure play, category-focused, industry-focused, and diversified; it is quantitatively analyzed to categorize companies as dominant, leading, strong, tentative, and weak.

Recent Development and News in Sanitary pumps market

  • In September 2024, Mars announced a USD 1.19 billion investment to modernize and upgrade its manufacturing operations across the European Union.
  • In November 2024, SPX FLOW launched its CU4plus ASi-5 control unit, integrating IoT for real-time diagnostics and enhanced valve management in food and beverage processing.
  • In January 2025, Agristo announced a USD 450 million investment for the construction of a new food processing facility in North Dakota, slated to begin construction in the same year.
  • In May 2025, Asahi Beverages officially unveiled a new USD 60 million canning line at its Queensland brewery to address shifting consumer preferences toward canned beverages.

Dive into Technavio’s robust research methodology, blending expert interviews, extensive data synthesis, and validated models for unparalleled Sanitary Pumps Market insights. See full methodology.

Market Scope
Page number 314
Base year 2025
Historic period 2020-2024
Forecast period 2026-2030
Growth momentum & CAGR Accelerate at a CAGR of 4.2%
Market growth 2026-2030 USD 611.4 million
Market structure Fragmented
YoY growth 2025-2026(%) 4.0%
Key countries China, Japan, India, South Korea, Australia, Indonesia, Germany, France, UK, Italy, Spain, The Netherlands, US, Canada, Mexico, Brazil, Argentina, Chile, Saudi Arabia, South Africa, UAE, Turkey and Egypt
Competitive landscape Leading Companies, Market Positioning of Companies, Competitive Strategies, and Industry Risks

Request Free Sample

Research Analyst Overview

  • The sanitary pumps market is advancing through continuous innovation in hygienic fluid transfer and aseptic processing. Compliance with EHEDG guidelines and 3-A Sanitary Standards is a baseline requirement, pushing manufacturers toward superior hygienic component design and materials like 316L stainless steel with an electropolished surface finish.
  • The choice between a centrifugal sanitary pump and a positive displacement sanitary pump is application-driven, with technologies like lobe pump design and twin-screw pump technology addressing needs for both low-shear fluid handling and viscous product transfer.
  • A key boardroom consideration is the adoption of single-use pump systems, particularly in bioprocessing, which leverages specialized peristaltic pump head and quaternary diaphragm pump designs. The integration of predictive maintenance sensors and variable frequency drives (VFD) is critical for optimizing the total cost of ownership (TCO).
  • Advanced fluid dynamic simulation is being used for hydraulic efficiency optimization, achieving a non-pulsating flow and ensuring self-draining capability in a crevice-free internal design, which improves cleaning efficiency by over 25%.
  • This focus on sanitary process engineering and ASME-BPE compliance in aseptic fluid handling and sanitary fluid management underscores the market's trajectory toward smarter, more efficient high-purity fluid systems and hygienic process pumps for sterile fluid transfer using food-grade pump materials for biopharmaceutical processing pumps and aseptic pump technology.

What are the Key Data Covered in this Sanitary Pumps Market Research and Growth Report?

  • What is the expected growth of the Sanitary Pumps Market between 2026 and 2030?

    • USD 611.4 million, at a CAGR of 4.2%

  • What segmentation does the market report cover?

    • The report is segmented by Type (Kinetic sanitary pumps, and Positive displacement (PD) sanitary pumps), End-user (Food and beverage, Pharmaceutical and biotechnology applications, and Others), Material (Stainless steel, Plastic, Hastelloy, and Others) and Geography (APAC, Europe, North America, South America, Middle East and Africa)

  • Which regions are analyzed in the report?

    • APAC, Europe, North America, South America and Middle East and Africa

  • What are the key growth drivers and market challenges?

    • Escalating stringency of regulatory frameworks and hygiene standards, Overcoming high capital expenditure and total cost of ownership hurdles

  • Who are the major players in the Sanitary Pumps Market?

    • Alfa Laval AB, Ampco Pumps Co., Axiflow Technologies Inc., Erich NETZSCH BV and Co., Fristam, GEA Group AG, Goulds Pumps, IDEX Corp., INOXPA USA Inc., KSB SE and Co. KGaA, LEWA GmbH, NOV Inc., Pentair Plc, PSG Dover, Q Pumps, Spirax Group, SPX FLOW Inc., Sulzer Ltd., Verder Liquids and Xylem Inc.

Market Research Insights

  • The market is characterized by a dynamic interplay between regulatory compliance and operational efficiency. The adoption of the smart pump with IoT monitoring is a key trend, with implementations showing a reduction in unplanned downtime by over 20% compared to traditional maintenance schedules.
  • Demand for specialized equipment, such as a low-shear pump for biologics and the sanitary pump for high viscosity liquids, is growing as end-user products become more complex. In parallel, a focus on sustainability is driving investment in the energy-efficient sanitary pump, which can lower operational costs by 15% or more.
  • In sectors like dairy, the need for an aseptic pump for dairy processing is non-negotiable, aligning capital investment directly with product safety and quality assurance mandates.

We can help! Our analysts can customize this sanitary pumps market research report to meet your requirements.

Get in touch

1. Executive Summary

1.1 Market overview

Executive Summary - Chart on Market Overview
Executive Summary - Data Table on Market Overview
Executive Summary - Chart on Global Market Characteristics
Executive Summary - Chart on Market by Geography
Executive Summary - Chart on Market Segmentation by Type
Executive Summary - Chart on Market Segmentation by End-user
Executive Summary - Chart on Market Segmentation by Material
Executive Summary - Chart on Incremental Growth
Executive Summary - Data Table on Incremental Growth
Executive Summary - Chart on Company Market Positioning

2. Technavio Analysis

2.1 Analysis of price sensitivity, lifecycle, customer purchase basket, adoption rates, and purchase criteria

2.2 Criticality of inputs and Factors of differentiation

Chart on Overview on criticality of inputs and factors of differentiation

2.3 Factors of disruption

Chart on Overview on factors of disruption

2.4 Impact of drivers and challenges

Chart on Impact of drivers and challenges in 2025 and 2030

3. Market Landscape

3.1 Market ecosystem

Chart on Parent Market
Data Table on - Parent Market

3.2 Market characteristics

Chart on Market characteristics analysis

3.3 Value chain analysis

Chart on Value chain analysis

4. Market Sizing

4.1 Market definition

Data Table on Offerings of companies included in the market definition

4.2 Market segment analysis

Market segments

4.3 Market size 2025

4.4 Market outlook: Forecast for 2025-2030

Chart on Global - Market size and forecast 2025-2030 ($ million)
Data Table on Global - Market size and forecast 2025-2030 ($ million)
Chart on Global Market: Year-over-year growth 2025-2030 (%)
Data Table on Global Market: Year-over-year growth 2025-2030 (%)

5. Historic Market Size

5.1 Global Sanitary Pumps Market 2020 - 2024

Historic Market Size - Data Table on Global Sanitary Pumps Market 2020 - 2024 ($ million)

5.2 Type segment analysis 2020 - 2024

Historic Market Size - Type Segment 2020 - 2024 ($ million)

5.3 End-user segment analysis 2020 - 2024

Historic Market Size - End-user Segment 2020 - 2024 ($ million)

5.4 Material segment analysis 2020 - 2024

Historic Market Size - Material Segment 2020 - 2024 ($ million)

5.5 Geography segment analysis 2020 - 2024

Historic Market Size - Geography Segment 2020 - 2024 ($ million)

5.6 Country segment analysis 2020 - 2024

Historic Market Size - Country Segment 2020 - 2024 ($ million)

6. Qualitative Analysis

6.1 The impact of AI on global sanitary pumps market

7. Five Forces Analysis

7.1 Five forces summary

Five forces analysis - Comparison between 2025 and 2030

7.2 Bargaining power of buyers

Bargaining power of buyers - Impact of key factors 2025 and 2030

7.3 Bargaining power of suppliers

Bargaining power of suppliers - Impact of key factors in 2025 and 2030

7.4 Threat of new entrants

Threat of new entrants - Impact of key factors in 2025 and 2030

7.5 Threat of substitutes

Threat of substitutes - Impact of key factors in 2025 and 2030

7.6 Threat of rivalry

Threat of rivalry - Impact of key factors in 2025 and 2030

7.7 Market condition

Chart on Market condition - Five forces 2025 and 2030

8. Market Segmentation by Type

8.1 Market segments

Chart on Type - Market share 2025-2030 (%)
Data Table on Type - Market share 2025-2030 (%)

8.2 Comparison by Type

Chart on Comparison by Type
Data Table on Comparison by Type

8.3 Kinetic sanitary pumps - Market size and forecast 2025-2030

Chart on Kinetic sanitary pumps - Market size and forecast 2025-2030 ($ million)
Data Table on Kinetic sanitary pumps - Market size and forecast 2025-2030 ($ million)
Chart on Kinetic sanitary pumps - Year-over-year growth 2025-2030 (%)
Data Table on Kinetic sanitary pumps - Year-over-year growth 2025-2030 (%)

8.4 Positive displacement (PD) sanitary pumps - Market size and forecast 2025-2030

Chart on Positive displacement (PD) sanitary pumps - Market size and forecast 2025-2030 ($ million)
Data Table on Positive displacement (PD) sanitary pumps - Market size and forecast 2025-2030 ($ million)
Chart on Positive displacement (PD) sanitary pumps - Year-over-year growth 2025-2030 (%)
Data Table on Positive displacement (PD) sanitary pumps - Year-over-year growth 2025-2030 (%)

8.5 Market opportunity by Type

Market opportunity by Type ($ million)
Data Table on Market opportunity by Type ($ million)

9. Market Segmentation by End-user

9.1 Market segments

Chart on End-user - Market share 2025-2030 (%)
Data Table on End-user - Market share 2025-2030 (%)

9.2 Comparison by End-user

Chart on Comparison by End-user
Data Table on Comparison by End-user

9.3 Food and beverage - Market size and forecast 2025-2030

Chart on Food and beverage - Market size and forecast 2025-2030 ($ million)
Data Table on Food and beverage - Market size and forecast 2025-2030 ($ million)
Chart on Food and beverage - Year-over-year growth 2025-2030 (%)
Data Table on Food and beverage - Year-over-year growth 2025-2030 (%)

9.4 Pharmaceutical and biotechnology applications - Market size and forecast 2025-2030

Chart on Pharmaceutical and biotechnology applications - Market size and forecast 2025-2030 ($ million)
Data Table on Pharmaceutical and biotechnology applications - Market size and forecast 2025-2030 ($ million)
Chart on Pharmaceutical and biotechnology applications - Year-over-year growth 2025-2030 (%)
Data Table on Pharmaceutical and biotechnology applications - Year-over-year growth 2025-2030 (%)

9.5 Others - Market size and forecast 2025-2030

Chart on Others - Market size and forecast 2025-2030 ($ million)
Data Table on Others - Market size and forecast 2025-2030 ($ million)
Chart on Others - Year-over-year growth 2025-2030 (%)
Data Table on Others - Year-over-year growth 2025-2030 (%)

9.6 Market opportunity by End-user

Market opportunity by End-user ($ million)
Data Table on Market opportunity by End-user ($ million)

10. Market Segmentation by Material

10.1 Market segments

Chart on Material - Market share 2025-2030 (%)
Data Table on Material - Market share 2025-2030 (%)

10.2 Comparison by Material

Chart on Comparison by Material
Data Table on Comparison by Material

10.3 Stainless steel - Market size and forecast 2025-2030

Chart on Stainless steel - Market size and forecast 2025-2030 ($ million)
Data Table on Stainless steel - Market size and forecast 2025-2030 ($ million)
Chart on Stainless steel - Year-over-year growth 2025-2030 (%)
Data Table on Stainless steel - Year-over-year growth 2025-2030 (%)

10.4 Plastic - Market size and forecast 2025-2030

Chart on Plastic - Market size and forecast 2025-2030 ($ million)
Data Table on Plastic - Market size and forecast 2025-2030 ($ million)
Chart on Plastic - Year-over-year growth 2025-2030 (%)
Data Table on Plastic - Year-over-year growth 2025-2030 (%)

10.5 Hastelloy - Market size and forecast 2025-2030

Chart on Hastelloy - Market size and forecast 2025-2030 ($ million)
Data Table on Hastelloy - Market size and forecast 2025-2030 ($ million)
Chart on Hastelloy - Year-over-year growth 2025-2030 (%)
Data Table on Hastelloy - Year-over-year growth 2025-2030 (%)

10.6 Others - Market size and forecast 2025-2030

Chart on Others - Market size and forecast 2025-2030 ($ million)
Data Table on Others - Market size and forecast 2025-2030 ($ million)
Chart on Others - Year-over-year growth 2025-2030 (%)
Data Table on Others - Year-over-year growth 2025-2030 (%)

10.7 Market opportunity by Material

Market opportunity by Material ($ million)
Data Table on Market opportunity by Material ($ million)

11. Customer Landscape

11.1 Customer landscape overview

Analysis of price sensitivity, lifecycle, customer purchase basket, adoption rates, and purchase criteria

12. Geographic Landscape

12.1 Geographic segmentation

Chart on Market share by geography 2025-2030 (%)
Data Table on Market share by geography 2025-2030 (%)

12.2 Geographic comparison

Chart on Geographic comparison
Data Table on Geographic comparison

12.3 APAC - Market size and forecast 2025-2030

Chart on APAC - Market size and forecast 2025-2030 ($ million)
Data Table on APAC - Market size and forecast 2025-2030 ($ million)
Chart on APAC - Year-over-year growth 2025-2030 (%)
Data Table on APAC - Year-over-year growth 2025-2030 (%)
Chart on Regional Comparison - APAC
Data Table on Regional Comparison - APAC

12.3.1 China - Market size and forecast 2025-2030

Chart on China - Market size and forecast 2025-2030 ($ million)
Data Table on China - Market size and forecast 2025-2030 ($ million)
Chart on China - Year-over-year growth 2025-2030 (%)
Data Table on China - Year-over-year growth 2025-2030 (%)

12.3.2 Japan - Market size and forecast 2025-2030

Chart on Japan - Market size and forecast 2025-2030 ($ million)
Data Table on Japan - Market size and forecast 2025-2030 ($ million)
Chart on Japan - Year-over-year growth 2025-2030 (%)
Data Table on Japan - Year-over-year growth 2025-2030 (%)

12.3.3 India - Market size and forecast 2025-2030

Chart on India - Market size and forecast 2025-2030 ($ million)
Data Table on India - Market size and forecast 2025-2030 ($ million)
Chart on India - Year-over-year growth 2025-2030 (%)
Data Table on India - Year-over-year growth 2025-2030 (%)

12.3.4 South Korea - Market size and forecast 2025-2030

Chart on South Korea - Market size and forecast 2025-2030 ($ million)
Data Table on South Korea - Market size and forecast 2025-2030 ($ million)
Chart on South Korea - Year-over-year growth 2025-2030 (%)
Data Table on South Korea - Year-over-year growth 2025-2030 (%)

12.3.5 Australia - Market size and forecast 2025-2030

Chart on Australia - Market size and forecast 2025-2030 ($ million)
Data Table on Australia - Market size and forecast 2025-2030 ($ million)
Chart on Australia - Year-over-year growth 2025-2030 (%)
Data Table on Australia - Year-over-year growth 2025-2030 (%)

12.3.6 Indonesia - Market size and forecast 2025-2030

Chart on Indonesia - Market size and forecast 2025-2030 ($ million)
Data Table on Indonesia - Market size and forecast 2025-2030 ($ million)
Chart on Indonesia - Year-over-year growth 2025-2030 (%)
Data Table on Indonesia - Year-over-year growth 2025-2030 (%)

12.4 Europe - Market size and forecast 2025-2030

Chart on Europe - Market size and forecast 2025-2030 ($ million)
Data Table on Europe - Market size and forecast 2025-2030 ($ million)
Chart on Europe - Year-over-year growth 2025-2030 (%)
Data Table on Europe - Year-over-year growth 2025-2030 (%)
Chart on Regional Comparison - Europe
Data Table on Regional Comparison - Europe

12.4.1 Germany - Market size and forecast 2025-2030

Chart on Germany - Market size and forecast 2025-2030 ($ million)
Data Table on Germany - Market size and forecast 2025-2030 ($ million)
Chart on Germany - Year-over-year growth 2025-2030 (%)
Data Table on Germany - Year-over-year growth 2025-2030 (%)

12.4.2 France - Market size and forecast 2025-2030

Chart on France - Market size and forecast 2025-2030 ($ million)
Data Table on France - Market size and forecast 2025-2030 ($ million)
Chart on France - Year-over-year growth 2025-2030 (%)
Data Table on France - Year-over-year growth 2025-2030 (%)

12.4.3 UK - Market size and forecast 2025-2030

Chart on UK - Market size and forecast 2025-2030 ($ million)
Data Table on UK - Market size and forecast 2025-2030 ($ million)
Chart on UK - Year-over-year growth 2025-2030 (%)
Data Table on UK - Year-over-year growth 2025-2030 (%)

12.4.4 Italy - Market size and forecast 2025-2030

Chart on Italy - Market size and forecast 2025-2030 ($ million)
Data Table on Italy - Market size and forecast 2025-2030 ($ million)
Chart on Italy - Year-over-year growth 2025-2030 (%)
Data Table on Italy - Year-over-year growth 2025-2030 (%)

12.4.5 Spain - Market size and forecast 2025-2030

Chart on Spain - Market size and forecast 2025-2030 ($ million)
Data Table on Spain - Market size and forecast 2025-2030 ($ million)
Chart on Spain - Year-over-year growth 2025-2030 (%)
Data Table on Spain - Year-over-year growth 2025-2030 (%)

12.4.6 The Netherlands - Market size and forecast 2025-2030

Chart on The Netherlands - Market size and forecast 2025-2030 ($ million)
Data Table on The Netherlands - Market size and forecast 2025-2030 ($ million)
Chart on The Netherlands - Year-over-year growth 2025-2030 (%)
Data Table on The Netherlands - Year-over-year growth 2025-2030 (%)

12.5 North America - Market size and forecast 2025-2030

Chart on North America - Market size and forecast 2025-2030 ($ million)
Data Table on North America - Market size and forecast 2025-2030 ($ million)
Chart on North America - Year-over-year growth 2025-2030 (%)
Data Table on North America - Year-over-year growth 2025-2030 (%)
Chart on Regional Comparison - North America
Data Table on Regional Comparison - North America

12.5.1 US - Market size and forecast 2025-2030

Chart on US - Market size and forecast 2025-2030 ($ million)
Data Table on US - Market size and forecast 2025-2030 ($ million)
Chart on US - Year-over-year growth 2025-2030 (%)
Data Table on US - Year-over-year growth 2025-2030 (%)

12.5.2 Canada - Market size and forecast 2025-2030

Chart on Canada - Market size and forecast 2025-2030 ($ million)
Data Table on Canada - Market size and forecast 2025-2030 ($ million)
Chart on Canada - Year-over-year growth 2025-2030 (%)
Data Table on Canada - Year-over-year growth 2025-2030 (%)

12.5.3 Mexico - Market size and forecast 2025-2030

Chart on Mexico - Market size and forecast 2025-2030 ($ million)
Data Table on Mexico - Market size and forecast 2025-2030 ($ million)
Chart on Mexico - Year-over-year growth 2025-2030 (%)
Data Table on Mexico - Year-over-year growth 2025-2030 (%)

12.6 South America - Market size and forecast 2025-2030

Chart on South America - Market size and forecast 2025-2030 ($ million)
Data Table on South America - Market size and forecast 2025-2030 ($ million)
Chart on South America - Year-over-year growth 2025-2030 (%)
Data Table on South America - Year-over-year growth 2025-2030 (%)
Chart on Regional Comparison - South America
Data Table on Regional Comparison - South America

12.6.1 Brazil - Market size and forecast 2025-2030

Chart on Brazil - Market size and forecast 2025-2030 ($ million)
Data Table on Brazil - Market size and forecast 2025-2030 ($ million)
Chart on Brazil - Year-over-year growth 2025-2030 (%)
Data Table on Brazil - Year-over-year growth 2025-2030 (%)

12.6.2 Argentina - Market size and forecast 2025-2030

Chart on Argentina - Market size and forecast 2025-2030 ($ million)
Data Table on Argentina - Market size and forecast 2025-2030 ($ million)
Chart on Argentina - Year-over-year growth 2025-2030 (%)
Data Table on Argentina - Year-over-year growth 2025-2030 (%)

12.6.3 Chile - Market size and forecast 2025-2030

Chart on Chile - Market size and forecast 2025-2030 ($ million)
Data Table on Chile - Market size and forecast 2025-2030 ($ million)
Chart on Chile - Year-over-year growth 2025-2030 (%)
Data Table on Chile - Year-over-year growth 2025-2030 (%)

12.7 Middle East and Africa - Market size and forecast 2025-2030

Chart on Middle East and Africa - Market size and forecast 2025-2030 ($ million)
Data Table on Middle East and Africa - Market size and forecast 2025-2030 ($ million)
Chart on Middle East and Africa - Year-over-year growth 2025-2030 (%)
Data Table on Middle East and Africa - Year-over-year growth 2025-2030 (%)
Chart on Regional Comparison - Middle East and Africa
Data Table on Regional Comparison - Middle East and Africa

12.7.1 Saudi Arabia - Market size and forecast 2025-2030

Chart on Saudi Arabia - Market size and forecast 2025-2030 ($ million)
Data Table on Saudi Arabia - Market size and forecast 2025-2030 ($ million)
Chart on Saudi Arabia - Year-over-year growth 2025-2030 (%)
Data Table on Saudi Arabia - Year-over-year growth 2025-2030 (%)

12.7.2 South Africa - Market size and forecast 2025-2030

Chart on South Africa - Market size and forecast 2025-2030 ($ million)
Data Table on South Africa - Market size and forecast 2025-2030 ($ million)
Chart on South Africa - Year-over-year growth 2025-2030 (%)
Data Table on South Africa - Year-over-year growth 2025-2030 (%)

12.7.3 UAE - Market size and forecast 2025-2030

Chart on UAE - Market size and forecast 2025-2030 ($ million)
Data Table on UAE - Market size and forecast 2025-2030 ($ million)
Chart on UAE - Year-over-year growth 2025-2030 (%)
Data Table on UAE - Year-over-year growth 2025-2030 (%)

12.7.4 Turkey - Market size and forecast 2025-2030

Chart on Turkey - Market size and forecast 2025-2030 ($ million)
Data Table on Turkey - Market size and forecast 2025-2030 ($ million)
Chart on Turkey - Year-over-year growth 2025-2030 (%)
Data Table on Turkey - Year-over-year growth 2025-2030 (%)

12.7.5 Egypt - Market size and forecast 2025-2030

Chart on Egypt - Market size and forecast 2025-2030 ($ million)
Data Table on Egypt - Market size and forecast 2025-2030 ($ million)
Chart on Egypt - Year-over-year growth 2025-2030 (%)
Data Table on Egypt - Year-over-year growth 2025-2030 (%)

12.8 Market opportunity by geography

Market opportunity by geography ($ million)
Data Tables on Market opportunity by geography ($ million)

13. Drivers, Challenges, and Opportunity

13.1 Market drivers

Escalating stringency of regulatory frameworks and hygiene standards
Sustained expansion of key end-use industries
Continuous technological innovation and focus on operational efficiency

13.2 Market challenges

Overcoming high capital expenditure and total cost of ownership hurdles
Managing intense competition and pervasive price pressures
Supply chain volatility and raw material cost instability

13.3 Impact of drivers and challenges

Impact of drivers and challenges in 2025 and 2030

13.4 Market opportunities

Proliferation of intelligent pumping solutions and digitalization
Ascendancy of single-use technologies in biopharmaceutical applications
Intensified focus on energy efficiency and sustainable operations

14. Competitive Landscape

14.1 Overview

14.2

Overview on criticality of inputs and factors of differentiation

14.3 Landscape disruption

Overview on factors of disruption

14.4 Industry risks

Impact of key risks on business

15. Competitive Analysis

15.1 Companies profiled

Companies covered

15.2 Company ranking index

15.3 Market positioning of companies

Matrix on companies position and classification

15.4 Alfa Laval AB

Alfa Laval AB - Overview
Alfa Laval AB - Business segments
Alfa Laval AB - Key news
Alfa Laval AB - Key offerings
Alfa Laval AB - Segment focus
SWOT

15.5 Ampco Pumps Co.

Ampco Pumps Co. - Overview
Ampco Pumps Co. - Product / Service
Ampco Pumps Co. - Key offerings
SWOT

15.6 Erich NETZSCH BV and Co.

Erich NETZSCH BV and Co. - Overview
Erich NETZSCH BV and Co. - Product / Service
Erich NETZSCH BV and Co. - Key offerings
SWOT

15.7 GEA Group AG

GEA Group AG - Overview
GEA Group AG - Business segments
GEA Group AG - Key offerings
GEA Group AG - Segment focus
SWOT

15.8 Goulds Pumps

Goulds Pumps - Overview
Goulds Pumps - Product / Service
Goulds Pumps - Key offerings
SWOT

15.9 IDEX Corp.

IDEX Corp. - Overview
IDEX Corp. - Business segments
IDEX Corp. - Key offerings
IDEX Corp. - Segment focus
SWOT

15.10 INOXPA USA Inc.

INOXPA USA Inc. - Overview
INOXPA USA Inc. - Product / Service
INOXPA USA Inc. - Key offerings
SWOT

15.11 KSB SE and Co. KGaA

KSB SE and Co. KGaA - Overview
KSB SE and Co. KGaA - Business segments
KSB SE and Co. KGaA - Key offerings
KSB SE and Co. KGaA - Segment focus
SWOT

15.12 LEWA GmbH

LEWA GmbH - Overview
LEWA GmbH - Product / Service
LEWA GmbH - Key offerings
SWOT

15.13 NOV Inc.

NOV Inc. - Overview
NOV Inc. - Business segments
NOV Inc. - Key news
NOV Inc. - Key offerings
NOV Inc. - Segment focus
SWOT

15.14 Pentair Plc

Pentair Plc - Overview
Pentair Plc - Business segments
Pentair Plc - Key news
Pentair Plc - Key offerings
Pentair Plc - Segment focus
SWOT

15.15 Q Pumps

Q Pumps - Overview
Q Pumps - Product / Service
Q Pumps - Key offerings
SWOT

15.16 Spirax Group

Spirax Group - Overview
Spirax Group - Business segments
Spirax Group - Key offerings
Spirax Group - Segment focus
SWOT

15.17 SPX FLOW Inc.

SPX FLOW Inc. - Overview
SPX FLOW Inc. - Product / Service
SPX FLOW Inc. - Key news
SPX FLOW Inc. - Key offerings
SWOT

15.18 Verder Liquids

Verder Liquids - Overview
Verder Liquids - Product / Service
Verder Liquids - Key offerings
SWOT

16. Appendix

16.1 Scope of the report

Market definition
Objectives
Notes and caveats

16.2 Inclusions and exclusions checklist

Inclusions checklist
Exclusions checklist

16.3 Currency conversion rates for US$

16.4 Research methodology

16.5 Data procurement

Information sources

16.6 Data validation

16.7 Validation techniques employed for market sizing

16.8 Data synthesis

16.9 360 degree market analysis

16.10 List of abbreviations

Research Methodology

Technavio presents a detailed picture of the market by way of study, synthesis, and summation of data from multiple sources. The analysts have presented the various facets of the market with a particular focus on identifying the key industry influencers. The data thus presented is comprehensive, reliable, and the result of extensive research, both primary and secondary.

INFORMATION SOURCES

Primary sources

  • Manufacturers and suppliers
  • Channel partners
  • Industry experts
  • Strategic decision makers

Secondary sources

  • Industry journals and periodicals
  • Government data
  • Financial reports of key industry players
  • Historical data
  • Press releases

DATA ANALYSIS

Data Synthesis

  • Collation of data
  • Estimation of key figures
  • Analysis of derived insights

Data Validation

  • Triangulation with data models
  • Reference against proprietary databases
  • Corroboration with industry experts

REPORT WRITING

Qualitative

  • Market drivers
  • Market challenges
  • Market trends
  • Five forces analysis

Quantitative

  • Market size and forecast
  • Market segmentation
  • Geographical insights
  • Competitive landscape

Interested in this report?

Get your sample now to see our research methodology and insights!

Download Now

Frequently Asked Questions

Sanitary Pumps market growth will increase by USD 611.4 million during 2026-2030.

The Sanitary Pumps market is expected to grow at a CAGR of 4.2% during 2026-2030.

Sanitary Pumps market is segmented by Type (Kinetic sanitary pumps, Positive displacement (PD) sanitary pumps) End-user (Food and beverage, Pharmaceutical and biotechnology applications, Others) Material (Stainless steel, Plastic, Hastelloy, Others)

Alfa Laval AB, Ampco Pumps Co., Axiflow Technologies Inc., Erich NETZSCH BV and Co., Fristam, GEA Group AG, Goulds Pumps, IDEX Corp., INOXPA USA Inc., KSB SE and Co. KGaA, LEWA GmbH, NOV Inc., Pentair Plc, PSG Dover, Q Pumps, Spirax Group, SPX FLOW Inc., Sulzer Ltd., Verder Liquids, Xylem Inc. are a few of the key vendors in the Sanitary Pumps market.

APAC will register the highest growth rate of 57.1% among the other regions. Therefore, the Sanitary Pumps market in APAC is expected to garner significant business opportunities for the vendors during the forecast period.

China, Japan, India, South Korea, Australia, Indonesia, Germany, France, UK, Italy, Spain, The Netherlands, US, Canada, Mexico, Brazil, Argentina, Chile, Saudi Arabia, South Africa, UAE, Turkey, Egypt

  • Escalating stringency of regulatory frameworks and hygiene standards is the driving factor this market.

The Sanitary Pumps market vendors should focus on grabbing business opportunities from the Type segment as it accounted for the largest market share in the base year.
RIA - Research AI Assistant
Ask RIA