Self-service Kiosk Market Analysis, Size, and Forecast 2026-2030: North America (US, Canada, and Mexico), APAC (China, Japan, and India), Europe (UK, Germany, and France), South America (Brazil and Argentina), Middle East and Africa (Saudi Arabia, UAE, and South Africa), and Rest of World (ROW)

Self-service Kiosk Market Analysis, Size, and Forecast 2026-2030:
North America (US, Canada, and Mexico), APAC (China, Japan, and India), Europe (UK, Germany, and France), South America (Brazil and Argentina), Middle East and Africa (Saudi Arabia, UAE, and South Africa), and Rest of World (ROW)

Published: Mar 2026 302 Pages SKU: IRTNTR40591

Market Overview at a Glance

$15.90 B
Market Opportunity
16.1%
CAGR 2025 - 2030
41.9%
North America Growth
$4.50 B
Retail segment 2024

Self-service Kiosk Market Size 2026-2030

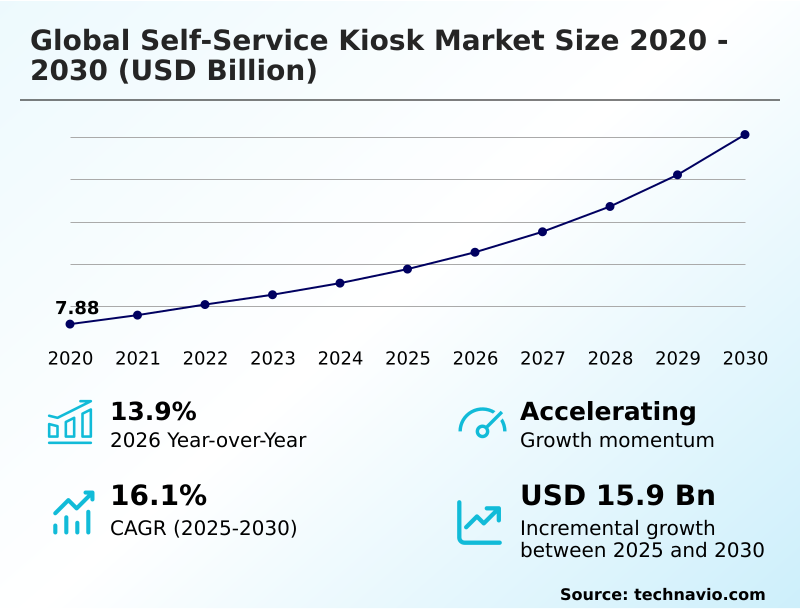
The self-service kiosk market size is valued to increase by USD 15.90 billion, at a CAGR of 16.1% from 2025 to 2030. Imperative for operational efficiency and cost reduction will drive the self-service kiosk market.

Major Market Trends & Insights

  • North America dominated the market and accounted for a 41.9% growth during the forecast period.
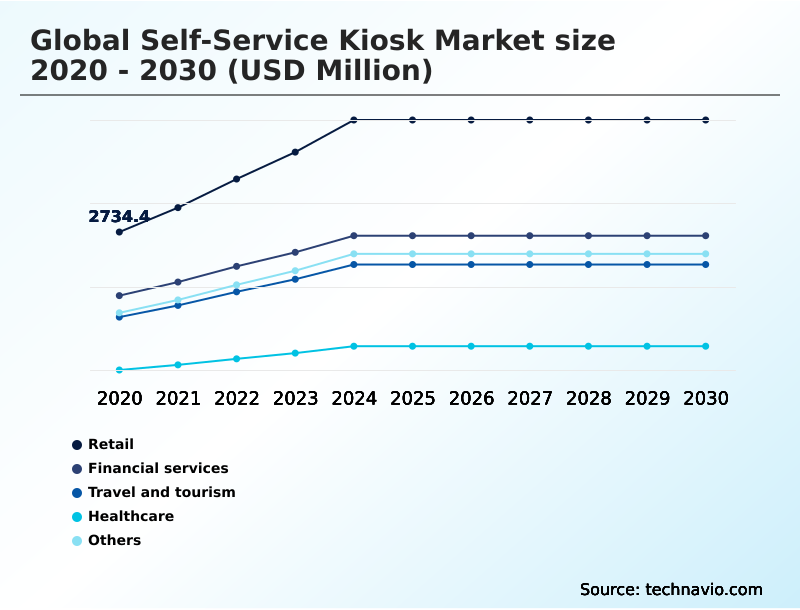
  • By End-user - Retail segment was valued at USD 4.50 billion in 2024
  • By Component - Hardware segment accounted for the largest market revenue share in 2024

Market Size & Forecast

  • Market Opportunities: USD 22.41 billion
  • Market Future Opportunities: USD 15.90 billion
  • CAGR from 2025 to 2030 : 16.1%

Market Summary

  • The Self-Service Kiosk Market is undergoing significant expansion, driven by the dual imperatives of enhancing operational efficiency and meeting consumer demand for autonomous, convenient interactions. Businesses are deploying these solutions to automate routine tasks, which reduces direct labor costs and allows for the strategic reallocation of staff to more value-added roles.
  • This shift is enabled by advancements in hardware, such as tamper-resistant enclosures and biometric sensors, and software, including robust application programming interfaces (APIs) and cloud-based management platforms. A key trend is the integration of artificial intelligence (AI) and machine learning (ML) to deliver a personalized user experience through automated upselling prompts and voice-activated commands.
  • For instance, in a quick-service restaurant environment, AI-powered self-ordering kiosks can analyze purchasing data to offer tailored recommendations, increasing average transaction value. However, the market faces challenges related to the high total cost of ownership and the complexities of integrating kiosks with legacy backend systems, which requires secure, real-time data synchronization to maintain a seamless customer journey.

What will be the Size of the Self-service Kiosk Market during the forecast period?

Get Key Insights on Market Forecast (PDF) Request Free Sample

How is the Self-service Kiosk Market Segmented?

The self-service kiosk industry research report provides comprehensive data (region-wise segment analysis), with forecasts and estimates in "USD million" for the period 2026-2030, as well as historical data from 2020-2024 for the following segments.

  • End-user
    • Retail
    • Financial services
    • Travel and tourism
    • Healthcare
    • Others
  • Component
    • Hardware
    • Software
    • Services
  • Display type
    • LCD displays
    • Touchscreens
    • Projector-based displays
  • Geography
    • North America
      • US
      • Canada
      • Mexico
    • APAC
      • China
      • Japan
      • India
    • Europe
      • UK
      • Germany
      • France
    • South America
      • Brazil
      • Argentina
    • Middle East and Africa
      • Saudi Arabia
      • UAE
      • South Africa
    • Rest of World (ROW)

By End-user Insights

The retail segment is estimated to witness significant growth during the forecast period.

The retail segment is a primary driver in the self-service kiosk market, fundamentally altering in-store customer experiences and operational management. Deployment is a strategic response to shifting consumer expectations toward autonomy and convenience.

Retailers are implementing advanced self-checkout systems and self-ordering kiosks to streamline the purchasing journey. These systems, featuring commercial-grade touchscreens and intuitive user interface (UI) design, empower customers and reduce wait times.

An omnichannel strategy is crucial, where a frictionless customer journey is supported by technologies like QR code integration.

Kiosks serve as digital touchpoints for endless aisle retail, loyalty program management, and processing returns, with some deployments recovering over 1% of turnover through AI-driven error detection.

Request Free Sample

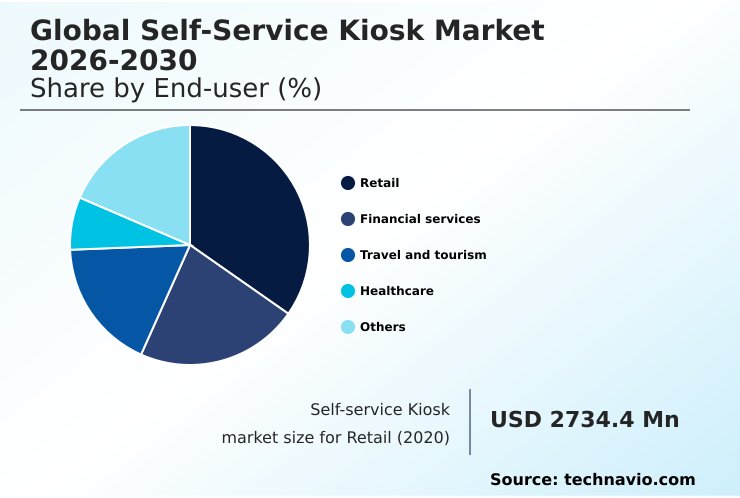
The Retail segment was valued at USD 4.50 billion in 2024 and showed a gradual increase during the forecast period.

Request Free Sample

Regional Analysis

North America is estimated to contribute 41.9% to the growth of the global market during the forecast period.Technavio’s analysts have elaborately explained the regional trends and drivers that shape the market during the forecast period.

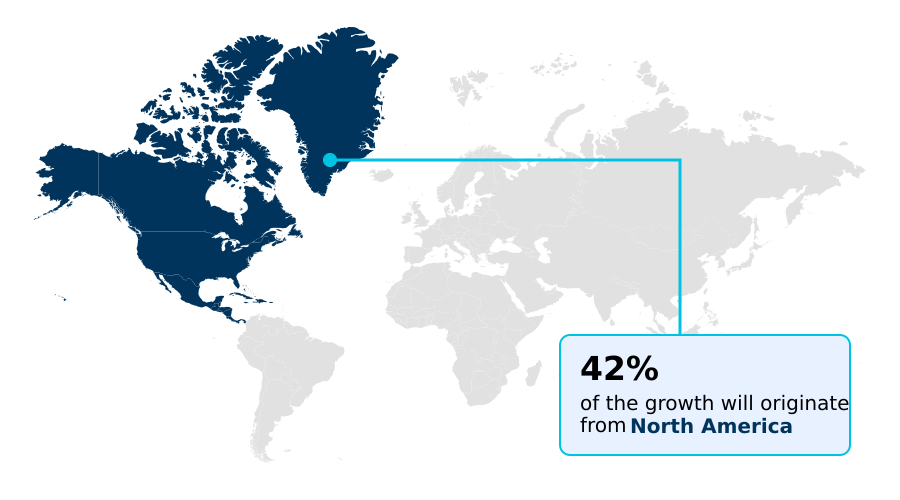
See How Self-service Kiosk Market Demand is Rising in North America Request Free Sample

The geographic landscape of the self-service kiosk market is diverse, with North America leading in maturity and innovation, accounting for over 41% of the market's incremental growth.

This region sees high adoption of advanced patient check-in kiosks and sophisticated self-checkout systems.

The APAC region is the fastest-growing market, with its adoption rate outpacing Europe by more than 1.5 percentage points, driven by rapid digitalization in countries like China and India.

Europe's market is characterized by a strong focus on regulatory compliance and security, with widespread use of kiosks in public transportation.

Key technologies driving growth across all regions include near-field communication (NFC) for payments and predictive maintenance analytics for hardware, both of which are critical for effective kiosk fleet management and ensuring a positive return on investment.

Market Dynamics

Our researchers analyzed the data with 2025 as the base year, along with the key drivers, trends, and challenges. A holistic analysis of drivers will help companies refine their marketing strategies to gain a competitive advantage.

  • Achieving success in the self-service kiosk market requires a deep understanding of specific use cases and the challenges in self service kiosk deployment. For instance, kiosk integration with backend systems, such as connecting a patient registration kiosk and EHR integration, is a primary hurdle that demands robust and secure middleware.
  • The goal of reducing wait times with self-service is a universal driver, compelling businesses to carefully consider kiosk design for outdoor environments and ensure kiosk accessibility for users with disabilities. A critical factor is the total cost of ownership for kiosks, which extends beyond hardware to include software maintenance and security.
  • When evaluating options, comparing PCAP vs IR touch technology is essential for balancing user experience with durability. For financial institutions, biometric authentication in financial kiosks is becoming standard for secure transactions. Similarly, retailers implement self-checkout systems to reduce labor costs and focus on improving order accuracy with kiosks.
  • The strategic application of AI in self service for personalization is also gaining traction, enabling dynamic user experiences. A comprehensive self-service kiosk ROI calculation must factor in hardware longevity, where solutions with predictive maintenance for kiosk hardware show uptime improvements of over 15% compared to reactive models.
  • Ultimately, a focus on enhancing customer experience with automation, supported by features like contactless payment integration in kiosks and kiosk software for remote fleet management, defines a successful omnichannel retail and kiosk convergence strategy. The adoption of voice activated kiosks for hygienic interaction further addresses modern consumer concerns, reinforcing the technology's value proposition across various sectors.

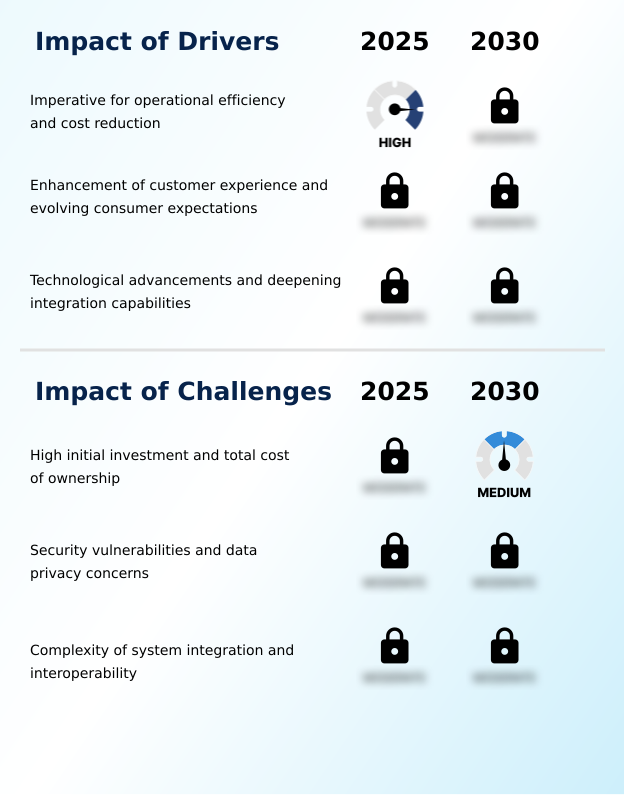
What are the key market drivers leading to the rise in the adoption of Self-service Kiosk Industry?

  • The imperative for businesses to improve operational efficiency and reduce costs is a fundamental driver of market growth.

  • The relentless pursuit of operational efficiency is a primary driver for the adoption of self-service kiosks.
  • By automating routine tasks such as order taking and payment processing through self-ordering kiosks and interactive teller machines (ITMs), businesses can reduce direct labor costs by 20-30%.
  • These systems, which utilize hardware like biometric sensors, are engineered for high accuracy, minimizing human error and enhancing the reliability of the customer self-service experience.
  • The ability of kiosks to accelerate transactions—often being 50% faster than agent-assisted interactions—leads to higher customer throughput and shorter queues.
  • This focus on customer throughput optimization directly supports branch transformation strategies and improves overall business performance, making the technology an essential component of modern service delivery.

What are the market trends shaping the Self-service Kiosk Industry?

  • The proliferation of artificial intelligence and machine learning is a transformative trend, enabling enhanced personalization and predictive operations within self-service kiosk ecosystems.

  • The integration of AI and machine learning is redefining self-service capabilities, elevating kiosks from static terminals to dynamic, responsive endpoints. This infusion of intelligence enables a highly personalized user experience, with systems leveraging real-time data to offer tailored recommendations.
  • AI-powered voice-activated commands and gesture control technology are creating more intuitive and hygienic touchless user interfaces, with some systems showing a 40% higher adoption rate among users with mobility impairments. On the operational side, predictive maintenance analytics powered by ML can anticipate hardware component failures, reducing downtime by up to 25%.
  • This shift to a predictive model, managed through a cloud-based management platform, significantly increases uptime and lowers the total cost of ownership for a kiosk fleet.

What challenges does the Self-service Kiosk Industry face during its growth?

  • The high initial investment and total cost of ownership present a significant challenge to broader market adoption.

  • A formidable challenge in the self-service kiosk market is the high total cost of ownership, which can be three to five times the initial hardware price over a five-year lifecycle. Beyond the upfront investment in tamper-resistant enclosures and peripherals, recurring expenses for software licensing, maintenance, and security updates are substantial.
  • The complexity of integrating kiosks with existing backend systems via application programming interfaces (APIs) often requires custom development, adding to costs. Moreover, security remains a paramount concern.
  • A single data breach resulting from hardware-based skimming or a software vulnerability can lead to customer churn rates exceeding 15%, causing irreparable brand damage and highlighting the critical need for robust data encryption at rest and diligent privacy-preserving principles.

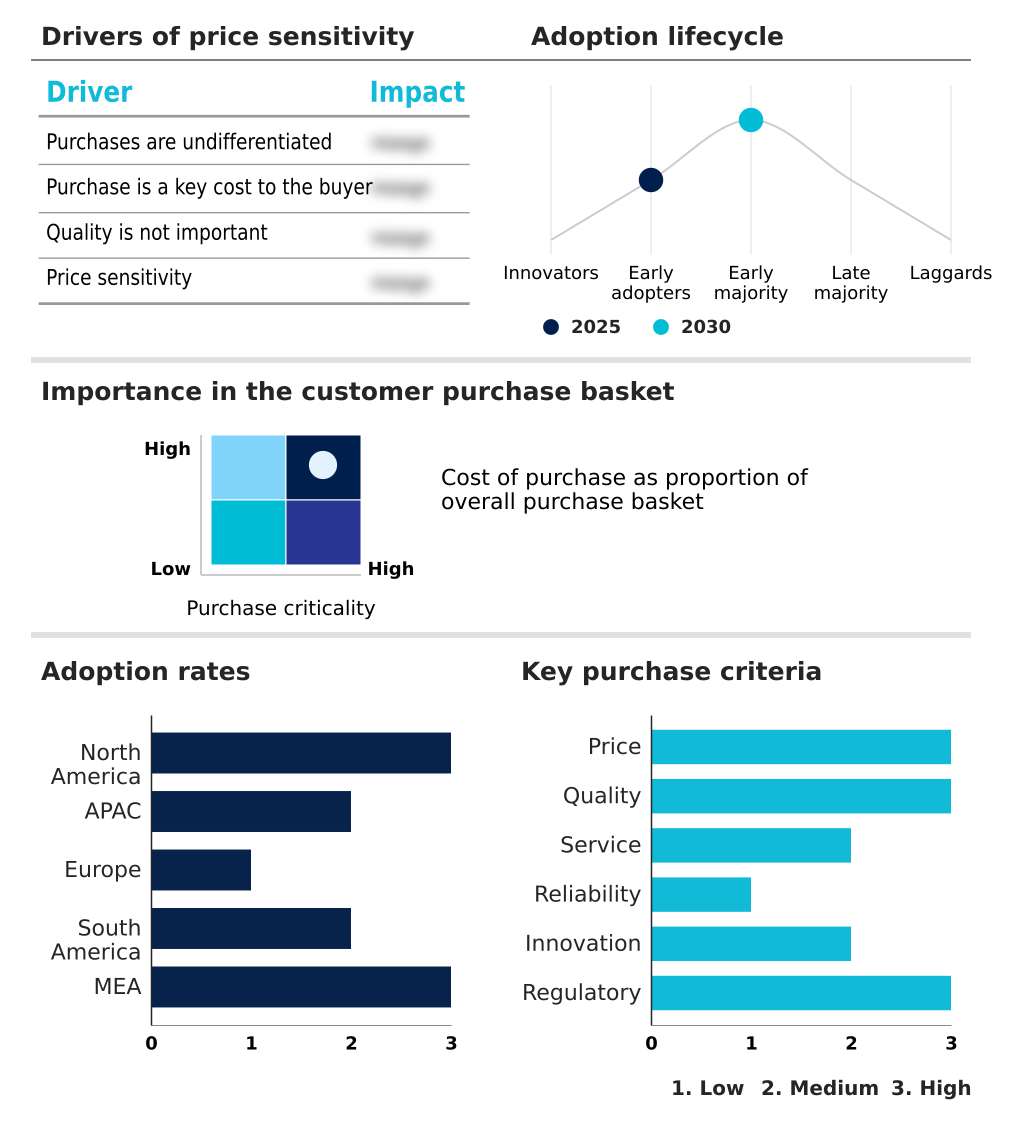
Exclusive Technavio Analysis on Customer Landscape

The self-service kiosk market forecasting report includes the adoption lifecycle of the market, covering from the innovator’s stage to the laggard’s stage. It focuses on adoption rates in different regions based on penetration. Furthermore, the self-service kiosk market report also includes key purchase criteria and drivers of price sensitivity to help companies evaluate and develop their market growth analysis strategies.

Customer Landscape of Self-service Kiosk Industry

Competitive Landscape

Companies are implementing various strategies, such as strategic alliances, self-service kiosk market forecast, partnerships, mergers and acquisitions, geographical expansion, and product/service launches, to enhance their presence in the industry.

Advanced Kiosk - Vendors offer integrated hardware and software solutions that enable secure, unattended transactions and services, transforming customer interaction points across various industries.

The industry research and growth report includes detailed analyses of the competitive landscape of the market and information about key companies, including:

  • Advanced Kiosk
  • Advantech Co. Ltd.
  • Aksor SAS
  • Diebold Nixdorf Incorp.
  • DynaTouch Corporation
  • Elo Touch Solutions Inc.
  • Frank Mayer and Associates Inc.
  • Glory Ltd.
  • IER SAS
  • KIOSK Information Systems
  • Meridian Kiosks
  • NCR Voyix Corp.
  • Olea Kiosks Inc.
  • Posiflex Technology Inc.
  • Pyramid Computer
  • RedyRef
  • Slabb Kiosks
  • Source Technologies
  • VeriFone Inc.
  • XIPHIAS Group

Qualitative and quantitative analysis of companies has been conducted to help clients understand the wider business environment as well as the strengths and weaknesses of key industry players. Data is qualitatively analyzed to categorize companies as pure play, category-focused, industry-focused, and diversified; it is quantitatively analyzed to categorize companies as dominant, leading, strong, tentative, and weak.

Recent Development and News in Self-service kiosk market

  • In January, 2025, NCR Voyix Corp. announced its advanced, AI-powered bulk scanning self-checkout solution, designed to accelerate transactions in the convenience store segment by identifying multiple products simultaneously.
  • In August, 2025, LG Electronics USA unveiled its next-generation self-ordering kiosks, developed with accessibility consultants to better serve users with vision, mobility, and hearing disabilities.
  • In September, 2025, TravelCenters of America expanded its self-service kiosk program within its Popeyes restaurant locations, aiming to improve operational efficiency and enhance customer experience for travelers.
  • In October, 2025, FamilyMart launched a fully unmanned, checkout-free convenience store in Tokyo, utilizing a sophisticated system of cameras and AI-powered sensors to enable a frictionless shopping experience.

Dive into Technavio’s robust research methodology, blending expert interviews, extensive data synthesis, and validated models for unparalleled Self-service Kiosk Market insights. See full methodology.

Market Scope
Page number 302
Base year 2025
Historic period 2020-2024
Forecast period 2026-2030
Growth momentum & CAGR Accelerate at a CAGR of 16.1%
Market growth 2026-2030 USD 15904.5 million
Market structure Fragmented
YoY growth 2025-2026(%) 13.9%
Key countries US, Canada, Mexico, China, Japan, India, South Korea, Australia, Indonesia, UK, Germany, France, Italy, Spain, The Netherlands, Brazil, Argentina, Chile, Saudi Arabia, UAE, South Africa, Turkey and Nigeria
Competitive landscape Leading Companies, Market Positioning of Companies, Competitive Strategies, and Industry Risks

Request Free Sample

Research Analyst Overview

  • The self-service kiosk market's evolution is defined by a shift from simple transactional devices to intelligent, integrated service endpoints. The convergence of advanced hardware, including commercial-grade touchscreens, central processing unit (CPU), and encrypted pin pads, with sophisticated kiosk operating system software is critical. The user interface (UI) design is a key differentiator, influencing adoption and satisfaction.
  • For boardroom-level strategy, the integration of artificial intelligence (AI) directly impacts budgeting for R&D and data security, especially with the use of facial recognition cameras and the need for operating system hardening. The deployment of these systems facilitates a comprehensive omnichannel strategy, where real-time data synchronization between the kiosk and backend platforms is non-negotiable.
  • Peripherals such as thermal receipt printers are essential for transaction completion. Advanced features like gesture control technology and automated upselling prompts, which contribute to an average transaction value increase of up to 10%, provide a clear return on investment.
  • The complexity of ensuring privacy-preserving principles and executing data encryption at rest makes the choice of a remote management suite and robust application programming interfaces (APIs) a crucial decision.

What are the Key Data Covered in this Self-service Kiosk Market Research and Growth Report?

  • What is the expected growth of the Self-service Kiosk Market between 2026 and 2030?

    • USD 15.90 billion, at a CAGR of 16.1%

  • What segmentation does the market report cover?

    • The report is segmented by End-user (Retail, Financial services, Travel and tourism, Healthcare, and Others), Component (Hardware, Software, and Services), Display Type (LCD displays, Touchscreens, and Projector-based displays) and Geography (North America, APAC, Europe, South America, Middle East and Africa)

  • Which regions are analyzed in the report?

    • North America, APAC, Europe, South America and Middle East and Africa

  • What are the key growth drivers and market challenges?

    • Imperative for operational efficiency and cost reduction, High initial investment and total cost of ownership

  • Who are the major players in the Self-service Kiosk Market?

    • Advanced Kiosk, Advantech Co. Ltd., Aksor SAS, Diebold Nixdorf Incorp., DynaTouch Corporation, Elo Touch Solutions Inc., Frank Mayer and Associates Inc., Glory Ltd., IER SAS, KIOSK Information Systems, Meridian Kiosks, NCR Voyix Corp., Olea Kiosks Inc., Posiflex Technology Inc., Pyramid Computer, RedyRef, Slabb Kiosks, Source Technologies, VeriFone Inc. and XIPHIAS Group

Market Research Insights

  • Market dynamics are shaped by evolving consumer preferences for autonomous, convenient service, with adoption rates for contactless interactions increasing by over 30% in high-traffic retail environments. Businesses are leveraging self-service kiosks as part of broader branch transformation strategies, particularly in the financial sector, where interactive teller machines (ITMs) handle routine transactions, improving efficiency.
  • This focus on customer self-service and unattended retail solutions creates a more frictionless customer journey. The integration of kiosks into a unified commerce platform is critical, enabling a seamless digital-to-physical handoff.
  • Deployments with advanced analytics capabilities have demonstrated the ability to optimize customer throughput, reducing average transaction times by up to 40% compared to traditional service counters, directly impacting operational profitability.

We can help! Our analysts can customize this self-service kiosk market research report to meet your requirements.

Get in touch

1. Executive Summary

1.1 Market overview

Executive Summary - Chart on Market Overview
Executive Summary - Data Table on Market Overview
Executive Summary - Chart on Global Market Characteristics
Executive Summary - Chart on Market by Geography
Executive Summary - Chart on Market Segmentation by End-user
Executive Summary - Chart on Market Segmentation by Component
Executive Summary - Chart on Market Segmentation by Display Type
Executive Summary - Chart on Incremental Growth
Executive Summary - Data Table on Incremental Growth
Executive Summary - Chart on Company Market Positioning

2. Technavio Analysis

2.1 Analysis of price sensitivity, lifecycle, customer purchase basket, adoption rates, and purchase criteria

2.2 Criticality of inputs and Factors of differentiation

Chart on Overview on criticality of inputs and factors of differentiation

2.3 Factors of disruption

Chart on Overview on factors of disruption

2.4 Impact of drivers and challenges

Chart on Impact of drivers and challenges in 2025 and 2030

3. Market Landscape

3.1 Market ecosystem

Chart on Parent Market
Data Table on - Parent Market

3.2 Market characteristics

Chart on Market characteristics analysis

3.3 Value chain analysis

Chart on Value chain analysis

4. Market Sizing

4.1 Market definition

Data Table on Offerings of companies included in the market definition

4.2 Market segment analysis

Market segments

4.3 Market size 2025

4.4 Market outlook: Forecast for 2025-2030

Chart on Global - Market size and forecast 2025-2030 ($ million)
Data Table on Global - Market size and forecast 2025-2030 ($ million)
Chart on Global Market: Year-over-year growth 2025-2030 (%)
Data Table on Global Market: Year-over-year growth 2025-2030 (%)

5. Historic Market Size

5.1 Global Self-Service Kiosk Market 2020 - 2024

Historic Market Size - Data Table on Global Self-Service Kiosk Market 2020 - 2024 ($ million)

5.2 End-user segment analysis 2020 - 2024

Historic Market Size - End-user Segment 2020 - 2024 ($ million)

5.3 Component segment analysis 2020 - 2024

Historic Market Size - Component Segment 2020 - 2024 ($ million)

5.4 Display Type segment analysis 2020 - 2024

Historic Market Size - Display Type Segment 2020 - 2024 ($ million)

5.5 Geography segment analysis 2020 - 2024

Historic Market Size - Geography Segment 2020 - 2024 ($ million)

5.6 Country segment analysis 2020 - 2024

Historic Market Size - Country Segment 2020 - 2024 ($ million)

6. Qualitative Analysis

6.1 Impact of AI on global self-service kiosk market

7. Five Forces Analysis

7.1 Five forces summary

Five forces analysis - Comparison between 2025 and 2030

7.2 Bargaining power of buyers

Bargaining power of buyers - Impact of key factors 2025 and 2030

7.3 Bargaining power of suppliers

Bargaining power of suppliers - Impact of key factors in 2025 and 2030

7.4 Threat of new entrants

Threat of new entrants - Impact of key factors in 2025 and 2030

7.5 Threat of substitutes

Threat of substitutes - Impact of key factors in 2025 and 2030

7.6 Threat of rivalry

Threat of rivalry - Impact of key factors in 2025 and 2030

7.7 Market condition

Chart on Market condition - Five forces 2025 and 2030

8. Market Segmentation by End-user

8.1 Market segments

Chart on End-user - Market share 2025-2030 (%)
Data Table on End-user - Market share 2025-2030 (%)

8.2 Comparison by End-user

Chart on Comparison by End-user
Data Table on Comparison by End-user

8.3 Retail - Market size and forecast 2025-2030

Chart on Retail - Market size and forecast 2025-2030 ($ million)
Data Table on Retail - Market size and forecast 2025-2030 ($ million)
Chart on Retail - Year-over-year growth 2025-2030 (%)
Data Table on Retail - Year-over-year growth 2025-2030 (%)

8.4 Financial services - Market size and forecast 2025-2030

Chart on Financial services - Market size and forecast 2025-2030 ($ million)
Data Table on Financial services - Market size and forecast 2025-2030 ($ million)
Chart on Financial services - Year-over-year growth 2025-2030 (%)
Data Table on Financial services - Year-over-year growth 2025-2030 (%)

8.5 Travel and tourism - Market size and forecast 2025-2030

Chart on Travel and tourism - Market size and forecast 2025-2030 ($ million)
Data Table on Travel and tourism - Market size and forecast 2025-2030 ($ million)
Chart on Travel and tourism - Year-over-year growth 2025-2030 (%)
Data Table on Travel and tourism - Year-over-year growth 2025-2030 (%)

8.6 Healthcare - Market size and forecast 2025-2030

Chart on Healthcare - Market size and forecast 2025-2030 ($ million)
Data Table on Healthcare - Market size and forecast 2025-2030 ($ million)
Chart on Healthcare - Year-over-year growth 2025-2030 (%)
Data Table on Healthcare - Year-over-year growth 2025-2030 (%)

8.7 Others - Market size and forecast 2025-2030

Chart on Others - Market size and forecast 2025-2030 ($ million)
Data Table on Others - Market size and forecast 2025-2030 ($ million)
Chart on Others - Year-over-year growth 2025-2030 (%)
Data Table on Others - Year-over-year growth 2025-2030 (%)

8.8 Market opportunity by End-user

Market opportunity by End-user ($ million)
Data Table on Market opportunity by End-user ($ million)

9. Market Segmentation by Component

9.1 Market segments

Chart on Component - Market share 2025-2030 (%)
Data Table on Component - Market share 2025-2030 (%)

9.2 Comparison by Component

Chart on Comparison by Component
Data Table on Comparison by Component

9.3 Hardware - Market size and forecast 2025-2030

Chart on Hardware - Market size and forecast 2025-2030 ($ million)
Data Table on Hardware - Market size and forecast 2025-2030 ($ million)
Chart on Hardware - Year-over-year growth 2025-2030 (%)
Data Table on Hardware - Year-over-year growth 2025-2030 (%)

9.4 Software - Market size and forecast 2025-2030

Chart on Software - Market size and forecast 2025-2030 ($ million)
Data Table on Software - Market size and forecast 2025-2030 ($ million)
Chart on Software - Year-over-year growth 2025-2030 (%)
Data Table on Software - Year-over-year growth 2025-2030 (%)

9.5 Services - Market size and forecast 2025-2030

Chart on Services - Market size and forecast 2025-2030 ($ million)
Data Table on Services - Market size and forecast 2025-2030 ($ million)
Chart on Services - Year-over-year growth 2025-2030 (%)
Data Table on Services - Year-over-year growth 2025-2030 (%)

9.6 Market opportunity by Component

Market opportunity by Component ($ million)
Data Table on Market opportunity by Component ($ million)

10. Market Segmentation by Display Type

10.1 Market segments

Chart on Display Type - Market share 2025-2030 (%)
Data Table on Display Type - Market share 2025-2030 (%)

10.2 Comparison by Display Type

Chart on Comparison by Display Type
Data Table on Comparison by Display Type

10.3 LCD displays - Market size and forecast 2025-2030

Chart on LCD displays - Market size and forecast 2025-2030 ($ million)
Data Table on LCD displays - Market size and forecast 2025-2030 ($ million)
Chart on LCD displays - Year-over-year growth 2025-2030 (%)
Data Table on LCD displays - Year-over-year growth 2025-2030 (%)

10.4 Touchscreens - Market size and forecast 2025-2030

Chart on Touchscreens - Market size and forecast 2025-2030 ($ million)
Data Table on Touchscreens - Market size and forecast 2025-2030 ($ million)
Chart on Touchscreens - Year-over-year growth 2025-2030 (%)
Data Table on Touchscreens - Year-over-year growth 2025-2030 (%)

10.5 Projector-based displays - Market size and forecast 2025-2030

Chart on Projector-based displays - Market size and forecast 2025-2030 ($ million)
Data Table on Projector-based displays - Market size and forecast 2025-2030 ($ million)
Chart on Projector-based displays - Year-over-year growth 2025-2030 (%)
Data Table on Projector-based displays - Year-over-year growth 2025-2030 (%)

10.6 Market opportunity by Display Type

Market opportunity by Display Type ($ million)
Data Table on Market opportunity by Display Type ($ million)

11. Customer Landscape

11.1 Customer landscape overview

Analysis of price sensitivity, lifecycle, customer purchase basket, adoption rates, and purchase criteria

12. Geographic Landscape

12.1 Geographic segmentation

Chart on Market share by geography 2025-2030 (%)
Data Table on Market share by geography 2025-2030 (%)

12.2 Geographic comparison

Chart on Geographic comparison
Data Table on Geographic comparison

12.3 North America - Market size and forecast 2025-2030

Chart on North America - Market size and forecast 2025-2030 ($ million)
Data Table on North America - Market size and forecast 2025-2030 ($ million)
Chart on North America - Year-over-year growth 2025-2030 (%)
Data Table on North America - Year-over-year growth 2025-2030 (%)
Chart on Regional Comparison - North America
Data Table on Regional Comparison - North America

12.3.1 US - Market size and forecast 2025-2030

Chart on US - Market size and forecast 2025-2030 ($ million)
Data Table on US - Market size and forecast 2025-2030 ($ million)
Chart on US - Year-over-year growth 2025-2030 (%)
Data Table on US - Year-over-year growth 2025-2030 (%)

12.3.2 Canada - Market size and forecast 2025-2030

Chart on Canada - Market size and forecast 2025-2030 ($ million)
Data Table on Canada - Market size and forecast 2025-2030 ($ million)
Chart on Canada - Year-over-year growth 2025-2030 (%)
Data Table on Canada - Year-over-year growth 2025-2030 (%)

12.3.3 Mexico - Market size and forecast 2025-2030

Chart on Mexico - Market size and forecast 2025-2030 ($ million)
Data Table on Mexico - Market size and forecast 2025-2030 ($ million)
Chart on Mexico - Year-over-year growth 2025-2030 (%)
Data Table on Mexico - Year-over-year growth 2025-2030 (%)

12.4 APAC - Market size and forecast 2025-2030

Chart on APAC - Market size and forecast 2025-2030 ($ million)
Data Table on APAC - Market size and forecast 2025-2030 ($ million)
Chart on APAC - Year-over-year growth 2025-2030 (%)
Data Table on APAC - Year-over-year growth 2025-2030 (%)
Chart on Regional Comparison - APAC
Data Table on Regional Comparison - APAC

12.4.1 China - Market size and forecast 2025-2030

Chart on China - Market size and forecast 2025-2030 ($ million)
Data Table on China - Market size and forecast 2025-2030 ($ million)
Chart on China - Year-over-year growth 2025-2030 (%)
Data Table on China - Year-over-year growth 2025-2030 (%)

12.4.2 Japan - Market size and forecast 2025-2030

Chart on Japan - Market size and forecast 2025-2030 ($ million)
Data Table on Japan - Market size and forecast 2025-2030 ($ million)
Chart on Japan - Year-over-year growth 2025-2030 (%)
Data Table on Japan - Year-over-year growth 2025-2030 (%)

12.4.3 India - Market size and forecast 2025-2030

Chart on India - Market size and forecast 2025-2030 ($ million)
Data Table on India - Market size and forecast 2025-2030 ($ million)
Chart on India - Year-over-year growth 2025-2030 (%)
Data Table on India - Year-over-year growth 2025-2030 (%)

12.4.4 South Korea - Market size and forecast 2025-2030

Chart on South Korea - Market size and forecast 2025-2030 ($ million)
Data Table on South Korea - Market size and forecast 2025-2030 ($ million)
Chart on South Korea - Year-over-year growth 2025-2030 (%)
Data Table on South Korea - Year-over-year growth 2025-2030 (%)

12.4.5 Australia - Market size and forecast 2025-2030

Chart on Australia - Market size and forecast 2025-2030 ($ million)
Data Table on Australia - Market size and forecast 2025-2030 ($ million)
Chart on Australia - Year-over-year growth 2025-2030 (%)
Data Table on Australia - Year-over-year growth 2025-2030 (%)

12.4.6 Indonesia - Market size and forecast 2025-2030

Chart on Indonesia - Market size and forecast 2025-2030 ($ million)
Data Table on Indonesia - Market size and forecast 2025-2030 ($ million)
Chart on Indonesia - Year-over-year growth 2025-2030 (%)
Data Table on Indonesia - Year-over-year growth 2025-2030 (%)

12.5 Europe - Market size and forecast 2025-2030

Chart on Europe - Market size and forecast 2025-2030 ($ million)
Data Table on Europe - Market size and forecast 2025-2030 ($ million)
Chart on Europe - Year-over-year growth 2025-2030 (%)
Data Table on Europe - Year-over-year growth 2025-2030 (%)
Chart on Regional Comparison - Europe
Data Table on Regional Comparison - Europe

12.5.1 UK - Market size and forecast 2025-2030

Chart on UK - Market size and forecast 2025-2030 ($ million)
Data Table on UK - Market size and forecast 2025-2030 ($ million)
Chart on UK - Year-over-year growth 2025-2030 (%)
Data Table on UK - Year-over-year growth 2025-2030 (%)

12.5.2 Germany - Market size and forecast 2025-2030

Chart on Germany - Market size and forecast 2025-2030 ($ million)
Data Table on Germany - Market size and forecast 2025-2030 ($ million)
Chart on Germany - Year-over-year growth 2025-2030 (%)
Data Table on Germany - Year-over-year growth 2025-2030 (%)

12.5.3 France - Market size and forecast 2025-2030

Chart on France - Market size and forecast 2025-2030 ($ million)
Data Table on France - Market size and forecast 2025-2030 ($ million)
Chart on France - Year-over-year growth 2025-2030 (%)
Data Table on France - Year-over-year growth 2025-2030 (%)

12.5.4 Italy - Market size and forecast 2025-2030

Chart on Italy - Market size and forecast 2025-2030 ($ million)
Data Table on Italy - Market size and forecast 2025-2030 ($ million)
Chart on Italy - Year-over-year growth 2025-2030 (%)
Data Table on Italy - Year-over-year growth 2025-2030 (%)

12.5.5 Spain - Market size and forecast 2025-2030

Chart on Spain - Market size and forecast 2025-2030 ($ million)
Data Table on Spain - Market size and forecast 2025-2030 ($ million)
Chart on Spain - Year-over-year growth 2025-2030 (%)
Data Table on Spain - Year-over-year growth 2025-2030 (%)

12.5.6 The Netherlands - Market size and forecast 2025-2030

Chart on The Netherlands - Market size and forecast 2025-2030 ($ million)
Data Table on The Netherlands - Market size and forecast 2025-2030 ($ million)
Chart on The Netherlands - Year-over-year growth 2025-2030 (%)
Data Table on The Netherlands - Year-over-year growth 2025-2030 (%)

12.6 South America - Market size and forecast 2025-2030

Chart on South America - Market size and forecast 2025-2030 ($ million)
Data Table on South America - Market size and forecast 2025-2030 ($ million)
Chart on South America - Year-over-year growth 2025-2030 (%)
Data Table on South America - Year-over-year growth 2025-2030 (%)
Chart on Regional Comparison - South America
Data Table on Regional Comparison - South America

12.6.1 Brazil - Market size and forecast 2025-2030

Chart on Brazil - Market size and forecast 2025-2030 ($ million)
Data Table on Brazil - Market size and forecast 2025-2030 ($ million)
Chart on Brazil - Year-over-year growth 2025-2030 (%)
Data Table on Brazil - Year-over-year growth 2025-2030 (%)

12.6.2 Argentina - Market size and forecast 2025-2030

Chart on Argentina - Market size and forecast 2025-2030 ($ million)
Data Table on Argentina - Market size and forecast 2025-2030 ($ million)
Chart on Argentina - Year-over-year growth 2025-2030 (%)
Data Table on Argentina - Year-over-year growth 2025-2030 (%)

12.6.3 Chile - Market size and forecast 2025-2030

Chart on Chile - Market size and forecast 2025-2030 ($ million)
Data Table on Chile - Market size and forecast 2025-2030 ($ million)
Chart on Chile - Year-over-year growth 2025-2030 (%)
Data Table on Chile - Year-over-year growth 2025-2030 (%)

12.7 Middle East and Africa - Market size and forecast 2025-2030

Chart on Middle East and Africa - Market size and forecast 2025-2030 ($ million)
Data Table on Middle East and Africa - Market size and forecast 2025-2030 ($ million)
Chart on Middle East and Africa - Year-over-year growth 2025-2030 (%)
Data Table on Middle East and Africa - Year-over-year growth 2025-2030 (%)
Chart on Regional Comparison - Middle East and Africa
Data Table on Regional Comparison - Middle East and Africa

12.7.1 Saudi Arabia - Market size and forecast 2025-2030

Chart on Saudi Arabia - Market size and forecast 2025-2030 ($ million)
Data Table on Saudi Arabia - Market size and forecast 2025-2030 ($ million)
Chart on Saudi Arabia - Year-over-year growth 2025-2030 (%)
Data Table on Saudi Arabia - Year-over-year growth 2025-2030 (%)

12.7.2 UAE - Market size and forecast 2025-2030

Chart on UAE - Market size and forecast 2025-2030 ($ million)
Data Table on UAE - Market size and forecast 2025-2030 ($ million)
Chart on UAE - Year-over-year growth 2025-2030 (%)
Data Table on UAE - Year-over-year growth 2025-2030 (%)

12.7.3 South Africa - Market size and forecast 2025-2030

Chart on South Africa - Market size and forecast 2025-2030 ($ million)
Data Table on South Africa - Market size and forecast 2025-2030 ($ million)
Chart on South Africa - Year-over-year growth 2025-2030 (%)
Data Table on South Africa - Year-over-year growth 2025-2030 (%)

12.7.4 Turkey - Market size and forecast 2025-2030

Chart on Turkey - Market size and forecast 2025-2030 ($ million)
Data Table on Turkey - Market size and forecast 2025-2030 ($ million)
Chart on Turkey - Year-over-year growth 2025-2030 (%)
Data Table on Turkey - Year-over-year growth 2025-2030 (%)

12.7.5 Nigeria - Market size and forecast 2025-2030

Chart on Nigeria - Market size and forecast 2025-2030 ($ million)
Data Table on Nigeria - Market size and forecast 2025-2030 ($ million)
Chart on Nigeria - Year-over-year growth 2025-2030 (%)
Data Table on Nigeria - Year-over-year growth 2025-2030 (%)

12.8 Market opportunity by geography

Market opportunity by geography ($ million)
Data Tables on Market opportunity by geography ($ million)

13. Drivers, Challenges, and Opportunity

13.1 Market drivers

Imperative for operational efficiency and cost reduction
Enhancement of customer experience and evolving consumer expectations
Technological advancements and deepening integration capabilities

13.2 Market challenges

High initial investment and total cost of ownership
Security vulnerabilities and data privacy concerns
Complexity of system integration and interoperability

13.3 Impact of drivers and challenges

Impact of drivers and challenges in 2025 and 2030

13.4 Market opportunities

Proliferation of AI and ML for enhanced personalization and predictive operations
Ascendancy of contactless and hygienic interaction technologies
Deepening convergence with mobile devices and omnichannel ecosystems

14. Competitive Landscape

14.1 Overview

14.2

Overview on criticality of inputs and factors of differentiation

14.3 Landscape disruption

Overview on factors of disruption

14.4 Industry risks

Impact of key risks on business

15. Competitive Analysis

15.1 Companies profiled

Companies covered

15.2 Company ranking index

15.3 Market positioning of companies

Matrix on companies position and classification

15.4 Advanced Kiosk

Advanced Kiosk - Overview
Advanced Kiosk - Product / Service
Advanced Kiosk - Key offerings
SWOT

15.5 Advantech Co. Ltd.

Advantech Co. Ltd. - Overview
Advantech Co. Ltd. - Business segments
Advantech Co. Ltd. - Key news
Advantech Co. Ltd. - Key offerings
Advantech Co. Ltd. - Segment focus
SWOT

15.6 Aksor SAS

Aksor SAS - Overview
Aksor SAS - Product / Service
Aksor SAS - Key offerings
SWOT

15.7 Diebold Nixdorf Incorp.

Diebold Nixdorf Incorp. - Overview
Diebold Nixdorf Incorp. - Business segments
Diebold Nixdorf Incorp. - Key offerings
Diebold Nixdorf Incorp. - Segment focus
SWOT

15.8 DynaTouch Corporation

DynaTouch Corporation - Overview
DynaTouch Corporation - Product / Service
DynaTouch Corporation - Key offerings
SWOT

15.9 Elo Touch Solutions Inc.

Elo Touch Solutions Inc. - Overview
Elo Touch Solutions Inc. - Product / Service
Elo Touch Solutions Inc. - Key offerings
SWOT

15.10 Glory Ltd.

Glory Ltd. - Overview
Glory Ltd. - Business segments
Glory Ltd. - Key offerings
Glory Ltd. - Segment focus
SWOT

15.11 KIOSK Information Systems

KIOSK Information Systems - Overview
KIOSK Information Systems - Product / Service
KIOSK Information Systems - Key offerings
SWOT

15.12 Meridian Kiosks

Meridian Kiosks - Overview
Meridian Kiosks - Product / Service
Meridian Kiosks - Key offerings
SWOT

15.13 NCR Voyix Corp.

NCR Voyix Corp. - Overview
NCR Voyix Corp. - Business segments
NCR Voyix Corp. - Key news
NCR Voyix Corp. - Key offerings
NCR Voyix Corp. - Segment focus
SWOT

15.14 Olea Kiosks Inc.

Olea Kiosks Inc. - Overview
Olea Kiosks Inc. - Product / Service
Olea Kiosks Inc. - Key offerings
SWOT

15.15 Posiflex Technology Inc.

Posiflex Technology Inc. - Overview
Posiflex Technology Inc. - Business segments
Posiflex Technology Inc. - Key offerings
Posiflex Technology Inc. - Segment focus
SWOT

15.16 Pyramid Computer

Pyramid Computer - Overview
Pyramid Computer - Product / Service
Pyramid Computer - Key offerings
SWOT

15.17 Slabb Kiosks

Slabb Kiosks - Overview
Slabb Kiosks - Product / Service
Slabb Kiosks - Key offerings
SWOT

15.18 VeriFone Inc.

VeriFone Inc. - Overview
VeriFone Inc. - Product / Service
VeriFone Inc. - Key offerings
SWOT

16. Appendix

16.1 Scope of the report

Market definition
Objectives
Notes and caveats

16.2 Inclusions and exclusions checklist

Inclusions checklist
Exclusions checklist

16.3 Currency conversion rates for US$

16.4 Research methodology

16.5 Data procurement

Information sources

16.6 Data validation

16.7 Validation techniques employed for market sizing

16.8 Data synthesis

16.9 360 degree market analysis

16.10 List of abbreviations

Research Methodology

Technavio presents a detailed picture of the market by way of study, synthesis, and summation of data from multiple sources. The analysts have presented the various facets of the market with a particular focus on identifying the key industry influencers. The data thus presented is comprehensive, reliable, and the result of extensive research, both primary and secondary.

INFORMATION SOURCES

Primary sources

  • Manufacturers and suppliers
  • Channel partners
  • Industry experts
  • Strategic decision makers

Secondary sources

  • Industry journals and periodicals
  • Government data
  • Financial reports of key industry players
  • Historical data
  • Press releases

DATA ANALYSIS

Data Synthesis

  • Collation of data
  • Estimation of key figures
  • Analysis of derived insights

Data Validation

  • Triangulation with data models
  • Reference against proprietary databases
  • Corroboration with industry experts

REPORT WRITING

Qualitative

  • Market drivers
  • Market challenges
  • Market trends
  • Five forces analysis

Quantitative

  • Market size and forecast
  • Market segmentation
  • Geographical insights
  • Competitive landscape

Interested in this report?

Get your sample now to see our research methodology and insights!

Download Now

Frequently Asked Questions

Self-service Kiosk market growth will increase by USD 15904.5 million during 2026-2030.

The Self-service Kiosk market is expected to grow at a CAGR of 16.1% during 2026-2030.

Self-service Kiosk market is segmented by End-user (Retail, Financial services, Travel and tourism, Healthcare, Others) Component (Hardware, Software, Services) Display type (LCD displays, Touchscreens, Projector-based displays)

Advanced Kiosk, Advantech Co. Ltd., Aksor SAS, Diebold Nixdorf Incorp., DynaTouch Corporation, Elo Touch Solutions Inc., Frank Mayer and Associates Inc., Glory Ltd., IER SAS, KIOSK Information Systems, Meridian Kiosks, NCR Voyix Corp., Olea Kiosks Inc., Posiflex Technology Inc., Pyramid Computer, RedyRef, Slabb Kiosks, Source Technologies, VeriFone Inc., XIPHIAS Group are a few of the key vendors in the Self-service Kiosk market.

North America will register the highest growth rate of 41.9% among the other regions. Therefore, the Self-service Kiosk market in North America is expected to garner significant business opportunities for the vendors during the forecast period.

US, Canada, Mexico, China, Japan, India, South Korea, Australia, Indonesia, UK, Germany, France, Italy, Spain, The Netherlands, Brazil, Argentina, Chile, Saudi Arabia, UAE, South Africa, Turkey, Nigeria

  • Imperative for operational efficiency and cost reduction is the driving factor this market.

The Self-service Kiosk market vendors should focus on grabbing business opportunities from the End-user segment as it accounted for the largest market share in the base year.
RIA - Research AI Assistant
Ask RIA