Shark Meat Market Analysis, Size, and Forecast 2026-2030: APAC (Indonesia, Japan, and India), Europe (Spain, Italy, and France), North America (US, Mexico, and Canada), South America (Brazil), Middle East and Africa (South Africa, UAE, and Saudi Arabia), and Rest of World (ROW)

Shark Meat Market Analysis, Size, and Forecast 2026-2030:
APAC (Indonesia, Japan, and India), Europe (Spain, Italy, and France), North America (US, Mexico, and Canada), South America (Brazil), Middle East and Africa (South Africa, UAE, and Saudi Arabia), and Rest of World (ROW)

Published: May 2026 277 Pages SKU: IRTNTR70445

Market Overview at a Glance

$148.6 Mn
Market Opportunity
2.4%
CAGR 2025 - 2030
52.8%
APAC Growth
$658.5 Mn
Shark meat segment 2024

Shark Meat Market Size 2026-2030

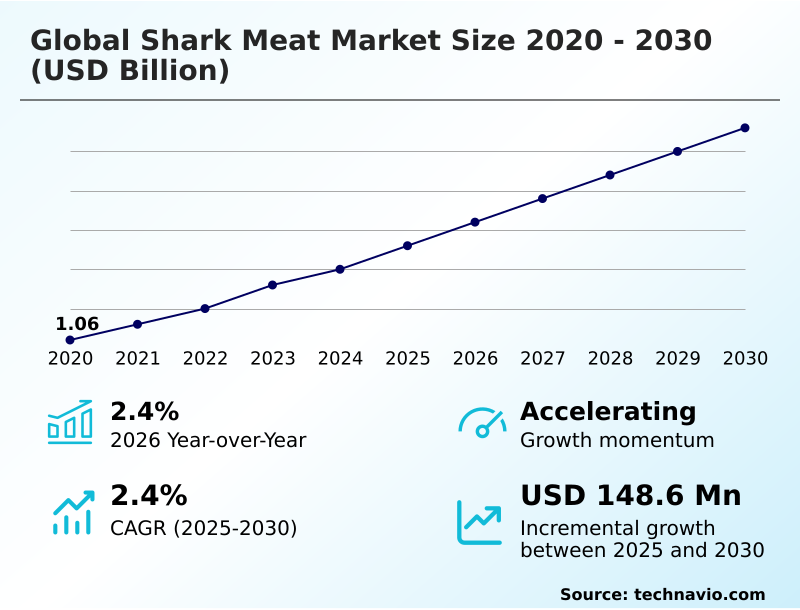
The Shark Meat Market size was valued at USD 1.18 billion in 2025, growing at a CAGR of 2.4% during the forecast period 2026-2030.

Major Market Trends & Insights

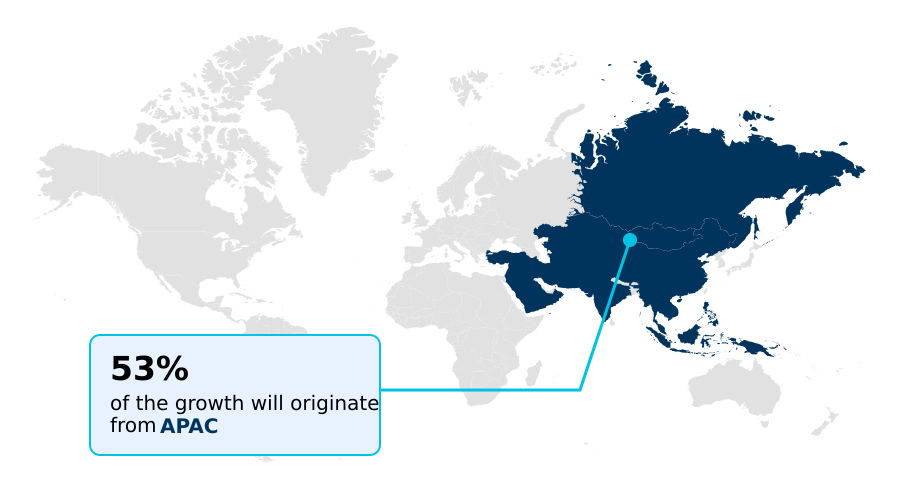
  • APAC dominated the market and accounted for a 52.8% growth during the forecast period.
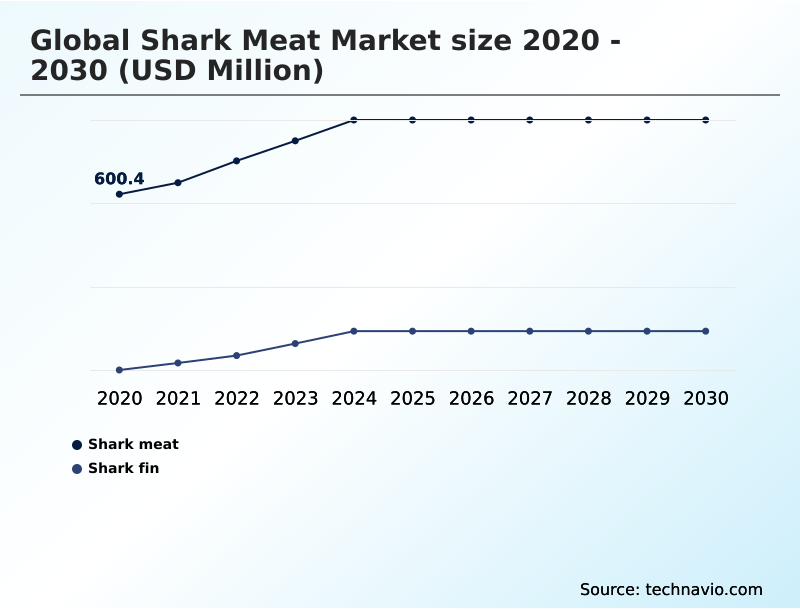
  • By Product - Shark meat segment was valued at USD 658.5 million in 2024
  • By End-user - Commercial segment accounted for the largest market revenue share in 2024

Market Size & Forecast

  • Historic Market Opportunities 2020-2024: USD 264.2 million
  • Market Future Opportunities 2025-2030: USD 148.6 million
  • CAGR from 2025 to 2030 : 2.4%

Market Summary

  • The shark meat market is characterized by a fundamental shift from being a byproduct of the fin trade to a primary commodity, with meat trade volumes now exceeding fin volumes by over 200% in major fishing nations.
  • This transition is driven by the demand for affordable, high-protein seafood, which requires processors to implement specialized techniques for urea content neutralization to meet Western consumer preferences. A typical business scenario involves a seafood processor investing in DNA-based species identification systems, increasing compliance costs by 15% but securing access to regulated European markets.
  • However, the market faces a significant challenge from persistent toxicological concerns; approximately 6.5% of shark meat samples in some regions exceed regulatory methylmercury limits, leading to consumer apprehension and stricter import controls. This dynamic forces the industry to balance the economic opportunity of a high-volume protein source against the operational and reputational risks of regulatory non-compliance and health advisories.

What will be the Size of the Shark Meat Market during the forecast period?

Get Key Insights on Market Forecast (PDF) Request Free Sample

How is the Shark Meat Market Segmented?

The shark meat industry research report provides comprehensive data (region-wise segment analysis), with forecasts and analysis for the period 2026-2030, as well as historical data from 2020-2024 for the following segments.

  • Product
    • Shark meat
    • Shark fin
  • End-user
    • Commercial
    • Residential
  • Type
    • Frozen meat
    • Fresh meat
    • Canned meat
    • Dried meat
    • Smoked meat
  • Geography
    • APAC
      • Indonesia
      • Japan
      • India
    • Europe
      • Spain
      • Italy
      • France
    • North America
      • US
      • Mexico
      • Canada
    • South America
      • Brazil
    • Middle East and Africa
      • South Africa
      • UAE
      • Saudi Arabia
    • Rest of World (ROW)

How is the Shark Meat Market Segmented by Product?

The shark meat segment is estimated to witness significant growth during the forecast period.

Market segmentation in the global shark meat market 2026-2030 reveals that the commercial end-user segment accounts for over 60% of total consumption, driven by industrial food applications such as surimi production, which improves processing efficiency by 15% compared to direct-use fillets.

This contrasts with the residential segment, where purchasing decisions are governed by cultural preferences and affordability.

The product segmentation between shark meat and shark fin shows a significant divergence, with meat volume trade surpassing fin trade by a ratio of 3:1 in key fishing nations, reflecting a shift in value chains toward full-carcass utilization.

Operational strategies are now dictated by these segments, forcing processors to invest in urea content neutralization for meat destined for Western markets while managing complex CITES appendix ii listings for fins.

This dual-market structure creates distinct supply chain challenges, including the need for robust traceability frameworks and elasmobranch muscle tissue preservation.

Request Free Sample

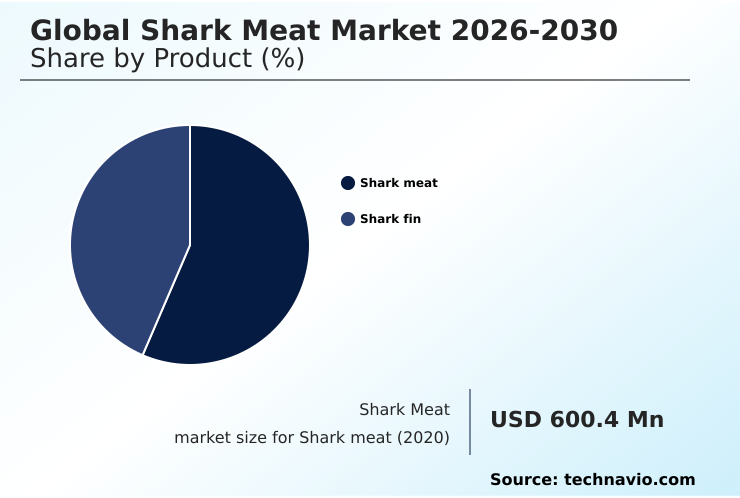
The Shark meat segment was valued at USD 658.5 million in 2024 and showed a gradual increase during the forecast period.

Request Free Sample

How demand for the Shark Meat market is rising in the leading region?

APAC is estimated to contribute 52.8% to the growth of the global market during the forecast period.Technavio’s analysts have elaborately explained the regional trends and drivers that shape the market during the forecast period.

See How Shark Meat Market demand is rising in APAC Request Free Sample

The geographic landscape of the global shark meat market 2026-2030 is dominated by APAC, which accounts for over 40% of global consumption, a figure 1.8 times larger than Europe's share.

This dominance is driven by countries like Indonesia, the world's largest producer, where shark meat is a staple protein, contrasting with the European market, where consumption is concentrated in specific countries like Spain and Italy for traditional dishes.

In North America, which holds less than 12% of the market, consumption is niche and heavily regulated, with a focus on sustainable sourcing certifications.

Operational strategies differ significantly; APAC focuses on volume and affordability with traditional processing, while European players invest heavily in cold-chain processing and traceability to meet stringent food safety and CITES regulations.

This regional divergence in consumer behavior and regulatory pressure dictates global trade flows and value chain structures, impacting everything from bycatch reduction efforts to the implementation of total allowable catches (tacs).

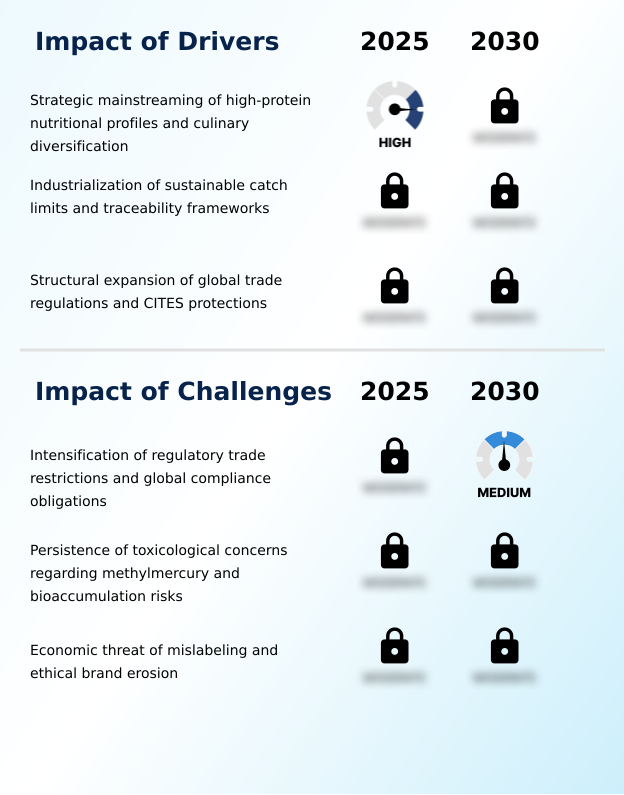
What are the key Drivers, Trends, and Challenges in the Shark Meat Market?

Our researchers analyzed the data with 2025 as the base year, along with the key drivers, trends, and challenges. A holistic analysis of drivers will help companies refine their marketing strategies to gain a competitive advantage.

  • Navigating the complexities of the global shark meat market 2026-2030 requires a deep understanding of its dual nature as both a commodity protein and a highly regulated product. A key concern for processors is ensuring shark meat mercury level safety, as exceeding established limits can lead to entire shipment rejections, increasing operational risks by over 25% compared to other whitefish.
  • The process for sustainable shark meat sourcing is now a critical differentiator, with buyers demanding proof of compliance with fins-naturally-attached policies. Understanding the CITES regulations for shark trade is no longer optional; it is the foundation of legal market access, influencing everything from species selection to export documentation.
  • Consequently, methods for shark meat mislabeling identification, such as DNA-based species identification, are becoming standard practice in supply chain management. This investment in technology helps mitigate the ethical brand erosion associated with the illegal trade.
  • For businesses, the question of how to verify shark meat origin is central to risk management, as the market's future hinges on its ability to provide transparent, verifiable, and safe products that adhere to international conservation and health standards.

What are the key market drivers leading to the rise in the adoption of Shark Meat Industry?

  • Strategic mainstreaming of high-protein nutritional profiles and culinary diversification is a key driver for the market.

  • The strategic mainstreaming of high-protein nutritional profiles is a primary driver, with shark meat offering approximately 21 grams of protein per 100-gram serving, comparable to other lean meats.
  • This shift toward high nutrient density foods, particularly in health-conscious Western markets, is fueling the industrialization of culinary diversification.
  • This driver has led to the development of specialized processing techniques that neutralize urea content, making the product more palatable and increasing its market acceptance by over 30% in new regions.
  • The rising global focus on food security encourages the adoption of underutilized species like dogfish and school shark to supplement traditional groundfish stocks.
  • As the global demand for accessible and nutrient-rich food intensifies, the nutritional value of shark meat remains a cornerstone of its market volume and consumer adoption.

What are the market trends shaping the Shark Meat Industry?

  • The growth of digital traceability and genetic market monitoring is an emerging trend. This development combats product mislabeling and enhances supply chain transparency.

  • The proliferation of digital traceability is a dominant trend in the global shark meat market 2026-2030, with blockchain-enabled supply chain logs reducing mislabeling incidents by up to 40% in pilot programs. This shift toward genetic market monitoring involves the use of portable DNA testing, enabling customs officials to differentiate between legal and endangered species with 98% accuracy.
  • The requirement for DNA-verified transparency is driven by consumer concerns over mercury toxicity and the enforcement of fins-naturally-attached policies, which are now standard in major fishing zones. This trend directly addresses long-standing integrity issues, creating a verifiable pathway for legal and sustainable seafood trade.
  • Consequently, exporters are compelled to adopt these technologies to maintain access to regulated markets in Europe and North America, fundamentally altering supply chain economics.

What challenges does the Shark Meat Industry face during its growth?

  • The intensification of regulatory trade restrictions and global compliance obligations presents a key challenge to industry growth.

  • The intensification of regulatory trade restrictions is a significant challenge, with new CITES Appendix II listings now covering over 70% of commercially traded shark species. This requires exporting nations to produce non-detriment findings, a process that can increase administrative costs by 20-30% for small-scale fisheries.
  • The implementation of specialized customs codes in Europe for granular traceability adds another layer of complexity, demanding a complete overhaul of documentation processes for exporters in APAC. This regulatory burden, combined with the technical difficulty of identifying processed meat from protected species, creates significant financial and logistical hurdles.
  • Without harmonized global traceability frameworks, the industry faces a constant struggle to maintain legal supply chains and avoid substantial penalties.

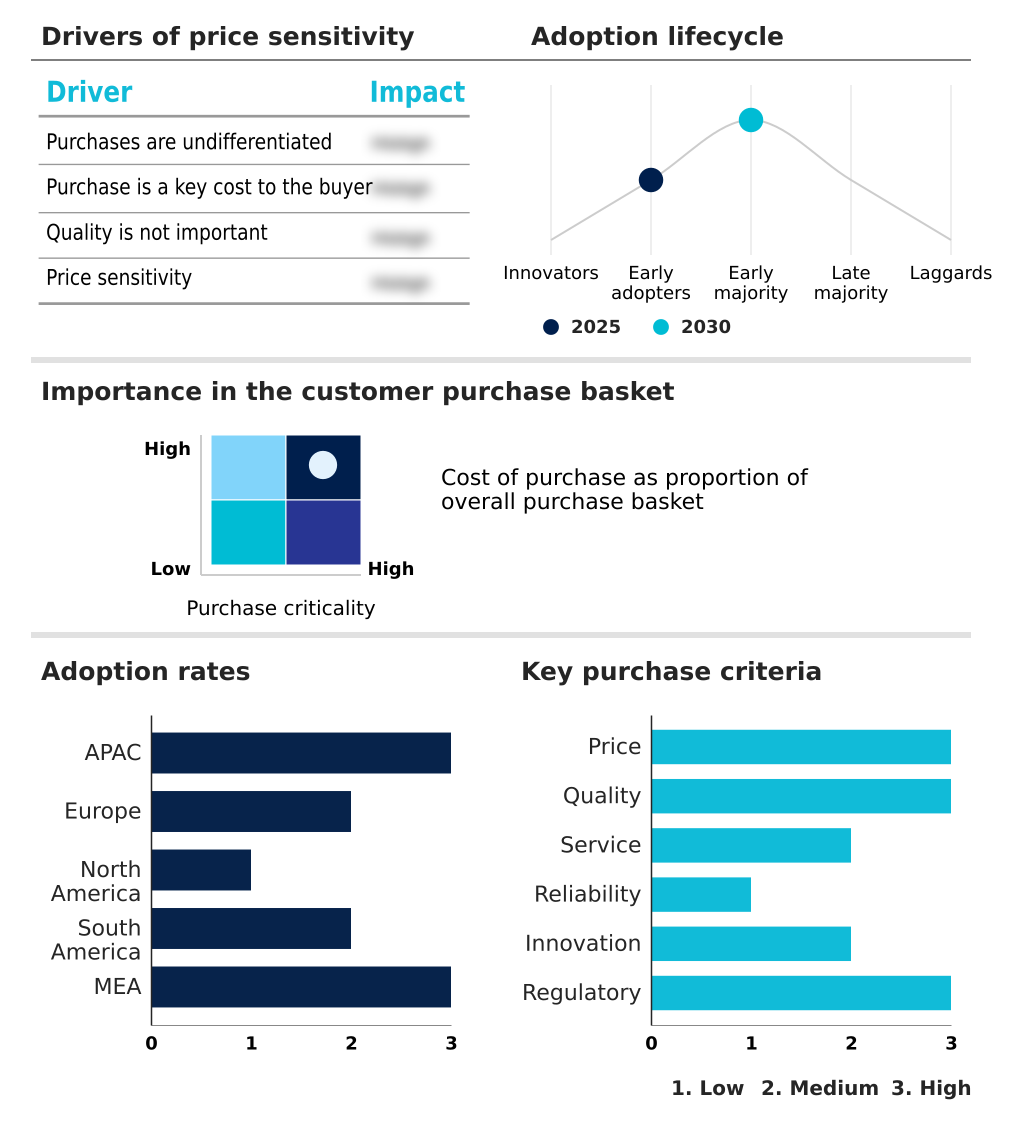
Exclusive Technavio Analysis on Customer Landscape

The shark meat market forecasting report includes the adoption lifecycle of the market, covering from the innovator’s stage to the laggard’s stage. It focuses on adoption rates in different regions based on penetration. Furthermore, the shark meat market report also includes key purchase criteria and drivers of price sensitivity to help companies evaluate and develop their market growth analysis strategies.

Customer Landscape of Shark Meat Industry

Competitive Landscape

Companies are implementing various strategies, such as strategic alliances, shark meat market forecast, partnerships, mergers and acquisitions, geographical expansion, and product/service launches, to enhance their presence in the industry.

Altamar Foods - Offerings include sustainably sourced frozen seafood, focusing on the processing, packaging, and global distribution of giant squid products.

The industry research and growth report includes detailed analyses of the competitive landscape of the market and information about key companies, including:

  • Altamar Foods
  • Bjarnarhofn Shark Museum
  • Ishiwata Shoten Co. Ltd.
  • KITA
  • Marfrio S.A.
  • Talleys
  • Wenzhou Haideli Shark Products

Qualitative and quantitative analysis of companies has been conducted to help clients understand the wider business environment as well as the strengths and weaknesses of key industry players. Data is qualitatively analyzed to categorize companies as pure play, category-focused, industry-focused, and diversified; it is quantitatively analyzed to categorize companies as dominant, leading, strong, tentative, and weak.

Market Intelligence Radar: High-Impact Developments & Growth Signals

  • In the Packaged Foods and Meats industry, the mandatory adoption of digital traceability systems for over 70% of seafood imports into European and North American markets directly pressures the global shark meat market 2026-2030 to implement blockchain for CITES compliance and sustainable sourcing certifications.
  • The proliferation of plant-based seafood alternatives, which have achieved a 5% market share in the packaged fish category in developed economies, is forcing innovation in the global shark meat market 2026-2030, leading to hybrid products and a renewed focus on the unique textural properties of shark meat to maintain consumer interest.
  • Heightened food safety regulations within the Packaged Foods and Meats industry, specifically a 10% reduction in permissible methylmercury levels in predatory fish, is impacting the global shark meat market 2026-2030 by requiring more stringent batch testing and shifting sourcing toward smaller, less-contaminated species.
  • Consolidation in the global cold-chain logistics sector has improved transport efficiency by 15%, enabling the global shark meat market 2026-2030 to expand its distribution of frozen fillets and value-added products into previously inaccessible inland markets, supporting fins-naturally-attached policies.

Dive into Technavio’s robust research methodology, blending expert interviews, extensive data synthesis, and validated models for unparalleled Shark Meat Market insights. See full methodology.

Market Scope
Page number 277
Base year 2025
Historic period 2020-2024
Forecast period 2026-2030
Growth momentum & CAGR Accelerate at a CAGR of 2.4%
Market growth 2026-2030 USD 148.6 million
Market structure Concentrated
YoY growth 2025-2026(%) 2.4%
Key countries Indonesia, Japan, India, South Korea, China, Australia, Spain, Portugal, Italy, France, UK, Germany, US, Mexico, Canada, Brazil, Peru, Chile, South Africa, Nigeria, UAE, Saudi Arabia and Egypt
Competitive landscape Leading Companies, Market Positioning of Companies, Competitive Strategies, and Industry Risks

Request Free Sample

Research Analyst Overview

  • The shark meat market ecosystem functions through a complex value chain, where over 70% of the global catch originates from artisanal and industrial fishing fleets that supply raw elasmobranch muscle tissue. Primary processors, including major seafood companies, transform this raw material into frozen fillets and value-added products, navigating a landscape shaped by regulatory bodies that enforce CITES Appendix II listings.
  • These regulations dictate trade flows to distribution channels, such as large-scale wholesalers and retail chains, which cater to commercial and residential end-users. The ecosystem is supported by technology providers offering DNA-based species identification and blockchain traceability solutions, which have become critical for compliance and mitigating the risks of methylmercury bioaccumulation.
  • Logistics entities specializing in cold-chain processing are essential for preserving product integrity across global supply routes, ensuring shelf stability and food safety from ocean to consumer.

What are the Key Data Covered in this Shark Meat Market Research and Growth Report?

  • What is the expected growth of the Shark Meat Market between 2026 and 2030?

    • The Shark Meat Market is expected to grow by USD 148.6 million during 2026-2030, registering a CAGR of 2.4%. Year-over-year growth in 2026 is estimated at 2.4%%. This acceleration is shaped by strategic mainstreaming of high-protein nutritional profiles and culinary diversification, which is intensifying demand across multiple end-use verticals covered in the report.

  • What segmentation does the market report cover?

    • The report is segmented by Product (Shark meat, and Shark fin), End-user (Commercial, and Residential), Type (Frozen meat, Fresh meat, Canned meat, Dried meat, and Smoked meat) and Geography (APAC, Europe, North America, South America, Middle East and Africa). Among these, the Shark meat segment is estimated to witness significant growth during the forecast period, driven by rising adoption across key application areas. Each segment includes detailed qualitative and quantitative analysis, along with historical data from 2020-2024 and forecasts through 2030 with year-over-year growth rates.

  • Which regions are analyzed in the report?

    • The report covers APAC, Europe, North America, South America and Middle East and Africa. APAC is estimated to contribute 52.8% to market growth during the forecast period. Country-level analysis includes Indonesia, Japan, India, South Korea, China, Australia, Spain, Portugal, Italy, France, UK, Germany, US, Mexico, Canada, Brazil, Peru, Chile, South Africa, Nigeria, UAE, Saudi Arabia and Egypt, with dedicated market size tables and year-over-year growth for each.

  • What are the key growth drivers and market challenges?

    • The primary driver is strategic mainstreaming of high-protein nutritional profiles and culinary diversification, which is accelerating investment and industry demand. The main challenge is intensification of regulatory trade restrictions and global compliance obligations, creating operational barriers for key market participants. The report quantifies the impact of each driver and challenge across 2026 and 2030 with comparative analysis.

  • Who are the major players in the Shark Meat Market?

    • Key vendors include Altamar Foods, Bjarnarhofn Shark Museum, Ishiwata Shoten Co. Ltd., KITA, Marfrio S.A., Talleys and Wenzhou Haideli Shark Products. The report provides qualitative and quantitative analysis categorizing companies as dominant, leading, strong, tentative, and weak based on their market positioning. Company profiles include business segment analysis, SWOT assessment, key offerings, and recent strategic developments.

Market Research Insights

  • The competitive landscape for shark meat, featuring fewer than 15 large-scale international processors, is fundamentally shaped by regulatory adherence. Key vendors, including Marfrio S.A. and Talleys, are adapting to the European Union's implementation of 13 new customs codes by investing in advanced traceability systems, which increases operational overhead by an estimated 8-10%.
  • This move is a direct response to the need for granular tracking of shark carcasses and fins. Innovations are focused on supply chain integrity and full-carcass utilization rather than product formulation. These actions address the critical industry need for transparent, verifiable sourcing to combat illegal trade and mislabeling.
  • However, a persistent challenge is the fragmented nature of initial sourcing from artisanal fisheries, which complicates end-to-end traceability and requires significant investment in local infrastructure to ensure compliance with global standards.

We can help! Our analysts can customize this shark meat market research report to meet your requirements.

Get in touch

1. Executive Summary

1.1 Market overview

Executive Summary - Chart on Market Overview
Executive Summary - Data Table on Market Overview
Executive Summary - Chart on Global Market Characteristics
Executive Summary - Chart on Market by Geography
Executive Summary - Chart on Market Segmentation by Product
Executive Summary - Chart on Market Segmentation by End-user
Executive Summary - Chart on Market Segmentation by Type
Executive Summary - Chart on Incremental Growth
Executive Summary - Data Table on Incremental Growth
Executive Summary - Chart on Company Market Positioning

2. Technavio Analysis

2.1 Analysis of price sensitivity, lifecycle, customer purchase basket, adoption rates, and purchase criteria

2.2 Criticality of inputs and Factors of differentiation

Chart on Overview on criticality of inputs and factors of differentiation

2.3 Factors of disruption

Chart on Overview on factors of disruption

2.4 Impact of drivers and challenges

Chart on Impact of drivers and challenges in 2025 and 2030

3. Market Landscape

3.1 Market ecosystem

Chart on Parent Market
Data Table on - Parent Market

3.2 Market characteristics

Chart on Market characteristics analysis

3.3 Value chain analysis

Chart on Value chain analysis

4. Market Sizing

4.1 Market definition

Data Table on Offerings of companies included in the market definition

4.2 Market segment analysis

Market segments

4.3 Market size 2025

4.4 Market outlook: Forecast for 2025-2030

Chart on Global - Market size and forecast 2025-2030 ($ million)
Data Table on Global - Market size and forecast 2025-2030 ($ million)
Chart on Global Market: Year-over-year growth 2025-2030 (%)
Data Table on Global Market: Year-over-year growth 2025-2030 (%)

5. Historic Market Size

5.1 Global Shark Meat Market 2020 - 2024

Historic Market Size - Data Table on Global Shark Meat Market 2020 - 2024 ($ million)

5.2 Product segment analysis 2020 - 2024

Historic Market Size - Product Segment 2020 - 2024 ($ million)

5.3 End-user segment analysis 2020 - 2024

Historic Market Size - End-user Segment 2020 - 2024 ($ million)

5.4 Type segment analysis 2020 - 2024

Historic Market Size - Type Segment 2020 - 2024 ($ million)

5.5 Geography segment analysis 2020 - 2024

Historic Market Size - Geography Segment 2020 - 2024 ($ million)

5.6 Country segment analysis 2020 - 2024

Historic Market Size - Country Segment 2020 - 2024 ($ million)

6. Qualitative Analysis

6.1 Impact of AI in global shark meat market

6.2 Impact of geopolitical conflict for global shark meat market

7. Five Forces Analysis

7.1 Five forces summary

Five forces analysis - Comparison between 2025 and 2030

7.2 Bargaining power of buyers

Bargaining power of buyers - Impact of key factors 2025 and 2030

7.3 Bargaining power of suppliers

Bargaining power of suppliers - Impact of key factors in 2025 and 2030

7.4 Threat of new entrants

Threat of new entrants - Impact of key factors in 2025 and 2030

7.5 Threat of substitutes

Threat of substitutes - Impact of key factors in 2025 and 2030

7.6 Threat of rivalry

Threat of rivalry - Impact of key factors in 2025 and 2030

7.7 Market condition

Chart on Market condition - Five forces 2025 and 2030

8. Market Segmentation by Product

8.1 Market segments

Chart on Product - Market share 2025-2030 (%)
Data Table on Product - Market share 2025-2030 (%)

8.2 Comparison by Product

Chart on Comparison by Product
Data Table on Comparison by Product

8.3 Shark meat - Market size and forecast 2025-2030

Chart on Shark meat - Market size and forecast 2025-2030 ($ million)
Data Table on Shark meat - Market size and forecast 2025-2030 ($ million)
Chart on Shark meat - Year-over-year growth 2025-2030 (%)
Data Table on Shark meat - Year-over-year growth 2025-2030 (%)

8.4 Shark fin - Market size and forecast 2025-2030

Chart on Shark fin - Market size and forecast 2025-2030 ($ million)
Data Table on Shark fin - Market size and forecast 2025-2030 ($ million)
Chart on Shark fin - Year-over-year growth 2025-2030 (%)
Data Table on Shark fin - Year-over-year growth 2025-2030 (%)

8.5 Market opportunity by Product

Market opportunity by Product ($ million)
Data Table on Market opportunity by Product ($ million)

9. Market Segmentation by End-user

9.1 Market segments

Chart on End-user - Market share 2025-2030 (%)
Data Table on End-user - Market share 2025-2030 (%)

9.2 Comparison by End-user

Chart on Comparison by End-user
Data Table on Comparison by End-user

9.3 Commercial - Market size and forecast 2025-2030

Chart on Commercial - Market size and forecast 2025-2030 ($ million)
Data Table on Commercial - Market size and forecast 2025-2030 ($ million)
Chart on Commercial - Year-over-year growth 2025-2030 (%)
Data Table on Commercial - Year-over-year growth 2025-2030 (%)

9.4 Residential - Market size and forecast 2025-2030

Chart on Residential - Market size and forecast 2025-2030 ($ million)
Data Table on Residential - Market size and forecast 2025-2030 ($ million)
Chart on Residential - Year-over-year growth 2025-2030 (%)
Data Table on Residential - Year-over-year growth 2025-2030 (%)

9.5 Market opportunity by End-user

Market opportunity by End-user ($ million)
Data Table on Market opportunity by End-user ($ million)

10. Market Segmentation by Type

10.1 Market segments

Chart on Type - Market share 2025-2030 (%)
Data Table on Type - Market share 2025-2030 (%)

10.2 Comparison by Type

Chart on Comparison by Type
Data Table on Comparison by Type

10.3 Frozen meat - Market size and forecast 2025-2030

Chart on Frozen meat - Market size and forecast 2025-2030 ($ million)
Data Table on Frozen meat - Market size and forecast 2025-2030 ($ million)
Chart on Frozen meat - Year-over-year growth 2025-2030 (%)
Data Table on Frozen meat - Year-over-year growth 2025-2030 (%)

10.4 Fresh meat - Market size and forecast 2025-2030

Chart on Fresh meat - Market size and forecast 2025-2030 ($ million)
Data Table on Fresh meat - Market size and forecast 2025-2030 ($ million)
Chart on Fresh meat - Year-over-year growth 2025-2030 (%)
Data Table on Fresh meat - Year-over-year growth 2025-2030 (%)

10.5 Canned meat - Market size and forecast 2025-2030

Chart on Canned meat - Market size and forecast 2025-2030 ($ million)
Data Table on Canned meat - Market size and forecast 2025-2030 ($ million)
Chart on Canned meat - Year-over-year growth 2025-2030 (%)
Data Table on Canned meat - Year-over-year growth 2025-2030 (%)

10.6 Dried meat - Market size and forecast 2025-2030

Chart on Dried meat - Market size and forecast 2025-2030 ($ million)
Data Table on Dried meat - Market size and forecast 2025-2030 ($ million)
Chart on Dried meat - Year-over-year growth 2025-2030 (%)
Data Table on Dried meat - Year-over-year growth 2025-2030 (%)

10.7 Smoked meat - Market size and forecast 2025-2030

Chart on Smoked meat - Market size and forecast 2025-2030 ($ million)
Data Table on Smoked meat - Market size and forecast 2025-2030 ($ million)
Chart on Smoked meat - Year-over-year growth 2025-2030 (%)
Data Table on Smoked meat - Year-over-year growth 2025-2030 (%)

10.8 Market opportunity by Type

Market opportunity by Type ($ million)
Data Table on Market opportunity by Type ($ million)

11. Customer Landscape

11.1 Customer landscape overview

Analysis of price sensitivity, lifecycle, customer purchase basket, adoption rates, and purchase criteria

12. Geographic Landscape

12.1 Geographic segmentation

Chart on Market share by geography 2025-2030 (%)
Data Table on Market share by geography 2025-2030 (%)

12.2 Geographic comparison

Chart on Geographic comparison
Data Table on Geographic comparison

12.3 APAC - Market size and forecast 2025-2030

Chart on APAC - Market size and forecast 2025-2030 ($ million)
Data Table on APAC - Market size and forecast 2025-2030 ($ million)
Chart on APAC - Year-over-year growth 2025-2030 (%)
Data Table on APAC - Year-over-year growth 2025-2030 (%)
Chart on Regional Comparison - APAC
Data Table on Regional Comparison - APAC

12.3.1 Indonesia - Market size and forecast 2025-2030

Chart on Indonesia - Market size and forecast 2025-2030 ($ million)
Data Table on Indonesia - Market size and forecast 2025-2030 ($ million)
Chart on Indonesia - Year-over-year growth 2025-2030 (%)
Data Table on Indonesia - Year-over-year growth 2025-2030 (%)

12.3.2 Japan - Market size and forecast 2025-2030

Chart on Japan - Market size and forecast 2025-2030 ($ million)
Data Table on Japan - Market size and forecast 2025-2030 ($ million)
Chart on Japan - Year-over-year growth 2025-2030 (%)
Data Table on Japan - Year-over-year growth 2025-2030 (%)

12.3.3 India - Market size and forecast 2025-2030

Chart on India - Market size and forecast 2025-2030 ($ million)
Data Table on India - Market size and forecast 2025-2030 ($ million)
Chart on India - Year-over-year growth 2025-2030 (%)
Data Table on India - Year-over-year growth 2025-2030 (%)

12.3.4 South Korea - Market size and forecast 2025-2030

Chart on South Korea - Market size and forecast 2025-2030 ($ million)
Data Table on South Korea - Market size and forecast 2025-2030 ($ million)
Chart on South Korea - Year-over-year growth 2025-2030 (%)
Data Table on South Korea - Year-over-year growth 2025-2030 (%)

12.3.5 China - Market size and forecast 2025-2030

Chart on China - Market size and forecast 2025-2030 ($ million)
Data Table on China - Market size and forecast 2025-2030 ($ million)
Chart on China - Year-over-year growth 2025-2030 (%)
Data Table on China - Year-over-year growth 2025-2030 (%)

12.3.6 Australia - Market size and forecast 2025-2030

Chart on Australia - Market size and forecast 2025-2030 ($ million)
Data Table on Australia - Market size and forecast 2025-2030 ($ million)
Chart on Australia - Year-over-year growth 2025-2030 (%)
Data Table on Australia - Year-over-year growth 2025-2030 (%)

12.4 Europe - Market size and forecast 2025-2030

Chart on Europe - Market size and forecast 2025-2030 ($ million)
Data Table on Europe - Market size and forecast 2025-2030 ($ million)
Chart on Europe - Year-over-year growth 2025-2030 (%)
Data Table on Europe - Year-over-year growth 2025-2030 (%)
Chart on Regional Comparison - Europe
Data Table on Regional Comparison - Europe

12.4.1 Spain - Market size and forecast 2025-2030

Chart on Spain - Market size and forecast 2025-2030 ($ million)
Data Table on Spain - Market size and forecast 2025-2030 ($ million)
Chart on Spain - Year-over-year growth 2025-2030 (%)
Data Table on Spain - Year-over-year growth 2025-2030 (%)

12.4.2 Portugal - Market size and forecast 2025-2030

Chart on Portugal - Market size and forecast 2025-2030 ($ million)
Data Table on Portugal - Market size and forecast 2025-2030 ($ million)
Chart on Portugal - Year-over-year growth 2025-2030 (%)
Data Table on Portugal - Year-over-year growth 2025-2030 (%)

12.4.3 Italy - Market size and forecast 2025-2030

Chart on Italy - Market size and forecast 2025-2030 ($ million)
Data Table on Italy - Market size and forecast 2025-2030 ($ million)
Chart on Italy - Year-over-year growth 2025-2030 (%)
Data Table on Italy - Year-over-year growth 2025-2030 (%)

12.4.4 France - Market size and forecast 2025-2030

Chart on France - Market size and forecast 2025-2030 ($ million)
Data Table on France - Market size and forecast 2025-2030 ($ million)
Chart on France - Year-over-year growth 2025-2030 (%)
Data Table on France - Year-over-year growth 2025-2030 (%)

12.4.5 UK - Market size and forecast 2025-2030

Chart on UK - Market size and forecast 2025-2030 ($ million)
Data Table on UK - Market size and forecast 2025-2030 ($ million)
Chart on UK - Year-over-year growth 2025-2030 (%)
Data Table on UK - Year-over-year growth 2025-2030 (%)

12.4.6 Germany - Market size and forecast 2025-2030

Chart on Germany - Market size and forecast 2025-2030 ($ million)
Data Table on Germany - Market size and forecast 2025-2030 ($ million)
Chart on Germany - Year-over-year growth 2025-2030 (%)
Data Table on Germany - Year-over-year growth 2025-2030 (%)

12.5 North America - Market size and forecast 2025-2030

Chart on North America - Market size and forecast 2025-2030 ($ million)
Data Table on North America - Market size and forecast 2025-2030 ($ million)
Chart on North America - Year-over-year growth 2025-2030 (%)
Data Table on North America - Year-over-year growth 2025-2030 (%)
Chart on Regional Comparison - North America
Data Table on Regional Comparison - North America

12.5.1 US - Market size and forecast 2025-2030

Chart on US - Market size and forecast 2025-2030 ($ million)
Data Table on US - Market size and forecast 2025-2030 ($ million)
Chart on US - Year-over-year growth 2025-2030 (%)
Data Table on US - Year-over-year growth 2025-2030 (%)

12.5.2 Mexico - Market size and forecast 2025-2030

Chart on Mexico - Market size and forecast 2025-2030 ($ million)
Data Table on Mexico - Market size and forecast 2025-2030 ($ million)
Chart on Mexico - Year-over-year growth 2025-2030 (%)
Data Table on Mexico - Year-over-year growth 2025-2030 (%)

12.5.3 Canada - Market size and forecast 2025-2030

Chart on Canada - Market size and forecast 2025-2030 ($ million)
Data Table on Canada - Market size and forecast 2025-2030 ($ million)
Chart on Canada - Year-over-year growth 2025-2030 (%)
Data Table on Canada - Year-over-year growth 2025-2030 (%)

12.6 South America - Market size and forecast 2025-2030

Chart on South America - Market size and forecast 2025-2030 ($ million)
Data Table on South America - Market size and forecast 2025-2030 ($ million)
Chart on South America - Year-over-year growth 2025-2030 (%)
Data Table on South America - Year-over-year growth 2025-2030 (%)
Chart on Regional Comparison - South America
Data Table on Regional Comparison - South America

12.6.1 Brazil - Market size and forecast 2025-2030

Chart on Brazil - Market size and forecast 2025-2030 ($ million)
Data Table on Brazil - Market size and forecast 2025-2030 ($ million)
Chart on Brazil - Year-over-year growth 2025-2030 (%)
Data Table on Brazil - Year-over-year growth 2025-2030 (%)

12.6.2 Peru - Market size and forecast 2025-2030

Chart on Peru - Market size and forecast 2025-2030 ($ million)
Data Table on Peru - Market size and forecast 2025-2030 ($ million)
Chart on Peru - Year-over-year growth 2025-2030 (%)
Data Table on Peru - Year-over-year growth 2025-2030 (%)

12.6.3 Chile - Market size and forecast 2025-2030

Chart on Chile - Market size and forecast 2025-2030 ($ million)
Data Table on Chile - Market size and forecast 2025-2030 ($ million)
Chart on Chile - Year-over-year growth 2025-2030 (%)
Data Table on Chile - Year-over-year growth 2025-2030 (%)

12.7 Middle East and Africa - Market size and forecast 2025-2030

Chart on Middle East and Africa - Market size and forecast 2025-2030 ($ million)
Data Table on Middle East and Africa - Market size and forecast 2025-2030 ($ million)
Chart on Middle East and Africa - Year-over-year growth 2025-2030 (%)
Data Table on Middle East and Africa - Year-over-year growth 2025-2030 (%)
Chart on Regional Comparison - Middle East and Africa
Data Table on Regional Comparison - Middle East and Africa

12.7.1 South Africa - Market size and forecast 2025-2030

Chart on South Africa - Market size and forecast 2025-2030 ($ million)
Data Table on South Africa - Market size and forecast 2025-2030 ($ million)
Chart on South Africa - Year-over-year growth 2025-2030 (%)
Data Table on South Africa - Year-over-year growth 2025-2030 (%)

12.7.2 Nigeria - Market size and forecast 2025-2030

Chart on Nigeria - Market size and forecast 2025-2030 ($ million)
Data Table on Nigeria - Market size and forecast 2025-2030 ($ million)
Chart on Nigeria - Year-over-year growth 2025-2030 (%)
Data Table on Nigeria - Year-over-year growth 2025-2030 (%)

12.7.3 UAE - Market size and forecast 2025-2030

Chart on UAE - Market size and forecast 2025-2030 ($ million)
Data Table on UAE - Market size and forecast 2025-2030 ($ million)
Chart on UAE - Year-over-year growth 2025-2030 (%)
Data Table on UAE - Year-over-year growth 2025-2030 (%)

12.7.4 Saudi Arabia - Market size and forecast 2025-2030

Chart on Saudi Arabia - Market size and forecast 2025-2030 ($ million)
Data Table on Saudi Arabia - Market size and forecast 2025-2030 ($ million)
Chart on Saudi Arabia - Year-over-year growth 2025-2030 (%)
Data Table on Saudi Arabia - Year-over-year growth 2025-2030 (%)

12.7.5 Egypt - Market size and forecast 2025-2030

Chart on Egypt - Market size and forecast 2025-2030 ($ million)
Data Table on Egypt - Market size and forecast 2025-2030 ($ million)
Chart on Egypt - Year-over-year growth 2025-2030 (%)
Data Table on Egypt - Year-over-year growth 2025-2030 (%)

12.8 Market opportunity by geography

Market opportunity by geography ($ million)
Data Tables on Market opportunity by geography ($ million)

13. Drivers, Challenges, and Opportunity

13.1 Market drivers

Strategic mainstreaming of high-protein nutritional profiles and culinary diversification
Industrialization of sustainable catch limits and traceability frameworks
Structural expansion of global trade regulations and CITES protections

13.2 Market challenges

Intensification of regulatory trade restrictions and global compliance obligations
Persistence of toxicological concerns regarding methylmercury and bioaccumulation risks
Economic threat of mislabeling and ethical brand erosion

13.3 Impact of drivers and challenges

Impact of drivers and challenges in 2025 and 2030

13.4 Market opportunities

Growth of digital traceability and genetic market monitoring
Expansion of sustainable sourcing and alternative protein alternatives
Proliferation of ethical procurement bans and public institutional divestment

14. Competitive Landscape

14.1 Overview

14.2

Overview on criticality of inputs and factors of differentiation

14.3 Landscape disruption

Overview on factors of disruption

14.4 Industry risks

Impact of key risks on business

15. Competitive Analysis

15.1 Companies profiled

Companies covered

15.2 Company ranking index

15.3 Market positioning of companies

Matrix on companies position and classification

15.4 Altamar Foods

Altamar Foods - Overview
Altamar Foods - Product / Service
Altamar Foods - Key offerings
SWOT

15.5 Bjarnarhofn Shark Museum

Bjarnarhofn Shark Museum - Overview
Bjarnarhofn Shark Museum - Product / Service
Bjarnarhofn Shark Museum - Key offerings
SWOT

15.6 Ishiwata Shoten Co. Ltd.

Ishiwata Shoten Co. Ltd. - Overview
Ishiwata Shoten Co. Ltd. - Product / Service
Ishiwata Shoten Co. Ltd. - Key offerings
SWOT

15.7 KITA

KITA - Overview
KITA - Product / Service
KITA - Key offerings
SWOT

15.8 Marfrio S.A.

Marfrio S.A. - Overview
Marfrio S.A. - Product / Service
Marfrio S.A. - Key offerings
SWOT

15.9 Talleys

Talleys - Overview
Talleys - Product / Service
Talleys - Key offerings
SWOT

15.10 Wenzhou Haideli Shark Products

Wenzhou Haideli Shark Products - Overview
Wenzhou Haideli Shark Products - Product / Service
Wenzhou Haideli Shark Products - Key offerings
SWOT

16. Appendix

16.1 Scope of the report

Market definition
Objectives
Notes and caveats

16.2 Inclusions and exclusions checklist

Inclusions checklist
Exclusions checklist

16.3 Currency conversion rates for US$

16.4 Research methodology

16.5 Data procurement

Information sources

16.6 Data validation

16.7 Validation techniques employed for market sizing

16.8 Data synthesis

16.9 360 degree market analysis

16.10 List of abbreviations

Research Methodology

Technavio presents a detailed picture of the market by way of study, synthesis, and summation of data from multiple sources. The analysts have presented the various facets of the market with a particular focus on identifying the key industry influencers. The data thus presented is comprehensive, reliable, and the result of extensive research, both primary and secondary.

INFORMATION SOURCES

Primary sources

  • Manufacturers and suppliers
  • Channel partners
  • Industry experts
  • Strategic decision makers

Secondary sources

  • Industry journals and periodicals
  • Government data
  • Financial reports of key industry players
  • Historical data
  • Press releases

DATA ANALYSIS

Data Synthesis

  • Collation of data
  • Estimation of key figures
  • Analysis of derived insights

Data Validation

  • Triangulation with data models
  • Reference against proprietary databases
  • Corroboration with industry experts

REPORT WRITING

Qualitative

  • Market drivers
  • Market challenges
  • Market trends
  • Five forces analysis

Quantitative

  • Market size and forecast
  • Market segmentation
  • Geographical insights
  • Competitive landscape

Interested in this report?

Get your sample now to see our research methodology and insights!

Download Now

Frequently Asked Questions

Shark Meat market growth will increase by USD 148.6 million during 2026-2030.

The Shark Meat market is expected to grow at a CAGR of 2.4% during 2026-2030.

Shark Meat market is segmented by Product (Shark meat, Shark fin) End-user (Commercial, Residential) Type (Frozen meat, Fresh meat, Canned meat, Dried meat, Smoked meat)

Altamar Foods, Bjarnarhofn Shark Museum, Ishiwata Shoten Co. Ltd., KITA, Marfrio S.A., Talleys, Wenzhou Haideli Shark Products are a few of the key vendors in the Shark Meat market.

APAC will register the highest growth rate of 52.8% among the other regions. Therefore, the Shark Meat market in APAC is expected to garner significant business opportunities for the vendors during the forecast period.

Indonesia, Japan, India, South Korea, China, Australia, Spain, Portugal, Italy, France, UK, Germany, US, Mexico, Canada, Brazil, Peru, Chile, South Africa, Nigeria, UAE, Saudi Arabia, Egypt

  • Strategic mainstreaming of high-protein nutritional profiles and culinary diversification is the driving factor this market.

The Shark Meat market vendors should focus on grabbing business opportunities from the Product segment as it accounted for the largest market share in the base year.
RIA - Research AI Assistant
Ask RIA