Protein Market Size 2025-2029
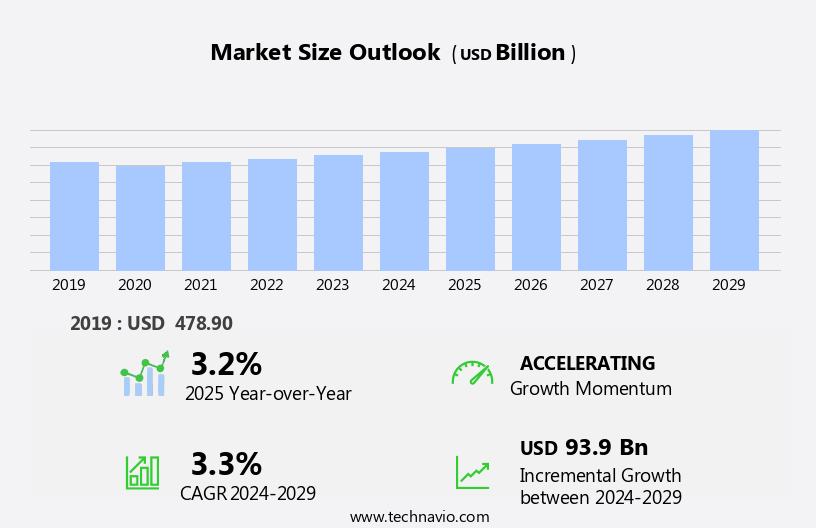
The protein market size is forecast to increase by USD 93.9 billion at a CAGR of 3.3% between 2024 and 2029.
- The market is experiencing significant growth, driven by the increasing popularity of sports and fitness activities. Consumers are increasingly recognizing the importance of protein in maintaining an active lifestyle, leading to a demand for protein supplements and snacks. This trend is further amplified by the rise in online sales channels, making it easier for consumers to access these products from anywhere. However, market growth is not without challenges. Regulatory hurdles impact adoption, as stringent regulations governing the production and labeling of protein supplements can create barriers for new entrants. Additionally, supply chain inconsistencies temper growth potential, as ensuring a consistent supply of high-quality protein sources remains a significant challenge. Plant-based protein products, including plant-based meat alternatives, vitamins, and dietary supplements, are gaining popularity as consumers seek more natural options.
- Companies seeking to capitalize on market opportunities must navigate these challenges effectively, focusing on regulatory compliance and supply chain optimization. By doing so, they can tap into the vast potential of this growing market and meet the increasing demand for protein products.
What will be the Size of the Protein Market during the forecast period?
- The market continues to evolve, with various protein sources gaining popularity among consumers seeking muscle growth, bone health, immune support, and weight loss. Protein production methods, including extraction from hemp, pea isolate, brown rice, soy isolate, and chia, have emerged as viable alternatives to traditional sources like whey. Protein trends lean towards plant-based options, with innovation driving the development of protein snacks, shakes, bars, and supplements. Regulations play a crucial role in ensuring protein safety and bioavailability, while protein analysis and testing are essential for maintaining quality and consistency. Plant protein sources, such as pea, soy, rice, and oilseed-based proteins, have gained significant traction due to their merit in muscle recovery and alignment with dietary trends like veganism and clean label.
- Protein requirements vary based on individual needs, with muscle recovery and endurance training demanding higher protein content. Protein processing techniques, such as hydrolysis and purification, enhance protein content and improve digestibility. The protein industry's ongoing research focuses on optimizing protein formulations for diverse applications, catering to the evolving needs of health-conscious consumers. These offerings prioritize nutritional value, easy usage, and eco-friendly packaging, reflecting the growing consumer preference for sustainable and transparent labeling
How is this Protein Industry segmented?
The protein industry research report provides comprehensive data (region-wise segment analysis), with forecasts and estimates in "USD billion" for the period 2025-2029, as well as historical data from 2019-2023 for the following segments.
- Source
- Plant
- Animal
- Microbial
- End-user
- Food and beverages
- Infant formulations
- Animal feed
- Others
- Channel
- Offline
- Online
- Geography
- North America
- US
- Europe
- France
- Germany
- Italy
- UK
- APAC
- Australia
- China
- India
- Japan
- South Korea
- Rest of World (ROW)
- North America
By Source Insights
The plant segment is estimated to witness significant growth during the forecast period. Plant-based proteins, derived from plants, fruits, grains, and vegetables, are increasingly used in food processing for various applications such as ready meals, meat alternatives, sports nutrition, and infant formulas. The global market for plant-proteins is experiencing significant growth due to several factors. One key reason is their cost-effectiveness, as plant-based protein production is generally less expensive than animal-based protein. Additionally, the increasing preference for vegetarianism among consumers worldwide is driving demand for plant-protein-based food products. Furthermore, plant proteins are more eco-friendly as they require fewer resources, including energy, water, and land, compared to animal-based protein production.
Protein quality is a crucial factor in the selection of protein sources. Amino acid composition plays a vital role in determining protein quality. Whey protein and protein concentrate are popular animal-derived protein sources, while pea protein and soy protein are commonly used plant-based protein sources. These supplements are utilized in various food applications, including desserts, sports nutrition, dietary supplements, and bakery products. Gluten-free protein options are essential for individuals with gluten intolerance or celiac disease. Protein purification techniques are used to enhance protein quality and remove impurities. Protein digestion and absorption are essential aspects of protein utilization in the body. Protein supplements, such as protein shakes, isolates, and powders, are popular among athletes and fitness enthusiasts to support muscle building and athletic performance.

The Plant segment was valued at USD 245.80 billion in 2019 and showed a gradual increase during the forecast period. Protein requirements vary based on age, sex, and physical activity levels. Protein deficiency can lead to health issues, including a weakened immune system and impaired muscle growth. Protein regulations ensure the safety and quality of protein products. Organic protein, non-GMO protein, and lactose-free protein options cater to consumers with specific dietary needs. Protein innovation continues to drive the market, with new protein sources and processing techniques being explored. Protein analysis and testing are crucial to ensure protein content and quality. Dairy-derived protein ingredients are particularly popular in nutrient-dense food items, such as sports and infant nutrition. Protein stability and bioavailability are essential factors in protein formulation and production. Protein trends include the use of plant-based proteins, protein blends, and protein bars. Weight management and protein intake are significant factors influencing protein consumption. Protein synthesis is a critical biological process that occurs in the body, and protein research continues to advance our understanding of its role in various physiological functions. The market growth is expected to continue, driven by increasing consumer awareness and demand for high-quality, sustainable protein sources.
Regional Analysis
APAC is estimated to contribute 58% to the growth of the global market during the forecast period. Technavio's analysts have elaborately explained the regional trends and drivers that shape the market during the forecast period.

The market experiences significant growth in the APAC region due to increasing health awareness, rising disposable incomes, and diverse dietary preferences. Consumers in countries like China, India, Japan, and Australia seek protein-rich foods, including plant-based proteins, dairy proteins, and alternative sources. Traditional protein consumption, such as seafood, soy-based products, and dairy, remains prominent, but innovative protein alternatives, like insect-based and lab-grown proteins, gain popularity. Fitness and wellness trends, along with government initiatives promoting nutrition, fuel the adoption of protein-enriched diets. Protein quality, amino acid profiles, and certifications, such as organic and gluten-free, influence consumer choices. Protein processing and testing ensure safety and stability, while protein absorption, blends, and isolates cater to various needs. Plant protein sources, such as cereals, oilseeds, and legumes, are gaining popularity due to their nutritional value, ease of usage, and eco-friendly packaging.
Whey, casein, soy, pea, and other protein types address protein deficiencies and muscle building requirements. Protein innovation continues with plant-based proteins, weight management, and protein powders, while sports nutrition and athletic performance drive demand for protein supplements. Protein regulations ensure production adheres to safety and quality standards. The market's evolution reflects consumers' evolving preferences and the industry's commitment to meeting diverse protein needs.
Market Dynamics
Our researchers analyzed the data with 2024 as the base year, along with the key drivers, trends, and challenges. A holistic analysis of drivers will help companies refine their marketing strategies to gain a competitive advantage.
What are the Protein market drivers leading to the rise in the adoption of Industry?
- The burgeoning fascination with sports and fitness pursuits serves as the primary catalyst for market growth. The market is experiencing significant growth due to the increasing awareness of health and fitness. With the rise of sports fitness as a global trend, more individuals are seeking ways to enhance their athletic performance and maintain optimal health. Protein, a crucial macronutrient, plays a vital role in muscle growth and repair, making it a popular choice among fitness enthusiasts. Two primary types of protein supplements dominate the market: whey protein and protein concentrate. Whey protein, derived from milk, is a complete protein, containing all essential amino acids. Protein concentrate, on the other hand, undergoes less processing and retains more of its natural nutrients, making it an attractive option for those seeking a more natural supplement.
- Additionally, there is a growing demand for hydrolyzed protein and protein formulations that cater to specific dietary needs, such as gluten-free, vegan, and pea protein. Protein purification techniques have advanced significantly, ensuring higher protein quality and improved protein digestion. Protein shakes have gained popularity as a convenient and efficient way to consume protein supplements. These supplements cater to various dietary requirements and preferences, making them accessible to a broad consumer base. The future of the market looks promising, with ongoing research and development in protein digestion and protein formulation technologies.
What are the Protein market trends shaping the Industry?
- The increasing popularity of online sales in the market signifies a significant market trend. Consumers are increasingly turning to e-commerce platforms to purchase proteins due to their convenience and accessibility. The protein industry continues to expand, driven by the increasing demand for high-quality protein isolates and supplements. Certifications such as organic and safety certifications play a significant role in consumer trust and market growth. Protein processing and testing are crucial for ensuring protein absorption, stability, and safety. Protein blends, including casein, are popular due to their unique benefits and versatility in various recipes. The market prioritizes innovation and research to meet consumers' evolving needs. Companies focus on improving protein processing techniques, enhancing product quality, and providing transparency throughout the supply chain.
- Protein supplements are a significant part of the market, with online sales experiencing rapid growth due to the convenience and reach they offer. Consumers benefit from the wealth of information available online, enabling informed purchasing decisions. The protein industry's future lies in continuous innovation, maintaining high standards, and catering to diverse consumer preferences.
How does Protein market faces challenges face during its growth?
- The proliferation of counterfeit protein supplements and snacks poses a significant threat to the growth of the industry, as consumers are increasingly drawn to these deceitful products that may compromise their health and erode trust in legitimate brands. The market is experiencing growing concerns over the proliferation of counterfeit products, which may contain substandard or unlisted ingredients, posing potential health risks for consumers. These products, often priced lower than authentic brands, are attracting unwary buyers. The National Collegiate Athletic Association (NCAA) has raised awareness of this issue, as many nutritional and dietary supplements, including protein-based ones, have been found to contain banned substances not indicated on the label. Such incidents have resulted in athletes testing positive and losing their eligibility, emphasizing the need for caution and consultation with athletic department staff before supplement use. Protein, a crucial macronutrient for muscle building and athletic performance, is a significant trend in sports nutrition.
- Protein requirements vary depending on individual needs, and consumers seek non-GMO, lactose-free, and soy protein options. Protein powders and bars are popular choices for convenience and portability. Protein research continues to advance our understanding of protein synthesis and its role in athletic performance, making it a dynamic and evolving market. Ensuring the authenticity and quality of protein products is essential to maintain consumer trust and promote long-term shelf life.
Exclusive Customer Landscape
The protein market forecasting report includes the adoption lifecycle of the market, covering from the innovator's stage to the laggard's stage. It focuses on adoption rates in different regions based on penetration. Furthermore, the protein market report also includes key purchase criteria and drivers of price sensitivity to help companies evaluate and develop their market growth analysis strategies.

Customer Landscape
Key Companies & Market Insights
Companies are implementing various strategies, such as strategic alliances, protein market forecast, partnerships, mergers and acquisitions, geographical expansion, and product/service launches, to enhance their presence in the industry.
AMCO Proteins - The company specializes in providing a range of plant-based proteins, including pea, soy, and wheat varieties.
The industry research and growth report includes detailed analyses of the competitive landscape of the market and information about key companies, including:
- AMCO Proteins
- Archer Daniels Midland Co.
- Arla Foods amba
- Bunge Global SA
- Cargill Inc.
- Darling Ingredients Inc.
- Fonterra Cooperative Group Ltd.
- Frieslandcampina NV
- Fuji Oil Holdings Inc.
- Gelita AG
- Glanbia plc
- Hilmar Cheese Company Inc.
- Ingredion Inc.
- International Flavors and Fragrances Inc.
- Kerry Group Plc
- LACTALIS Ingredients
- Puris
- Roquette Freres SA
- The Scoular Co.
- Wilmar International Ltd.
Qualitative and quantitative analysis of companies has been conducted to help clients understand the wider business environment as well as the strengths and weaknesses of key industry players. Data is qualitatively analyzed to categorize companies as pure play, category-focused, industry-focused, and diversified; it is quantitatively analyzed to categorize companies as dominant, leading, strong, tentative, and weak.
Recent Development and News in Protein Market
- In February 2024, Merck KGaA and Evonik Industries AG announced a strategic collaboration to expand their joint venture, Nutrition Science & Solutions GmbH. This partnership aimed to accelerate the development and commercialization of plant-based protein ingredients, addressing the growing demand for sustainable and alternative protein sources (Merck KGaA press release, 2024).
- In May 2025, Beyond Meat, a leading plant-based meat producer, unveiled its new product line, Beyond Sausage, in collaboration with Dunkin' Brands. This strategic partnership marked Beyond Meat's entry into the quick-service restaurant sector, expanding its reach beyond traditional grocery stores (Beyond Meat press release, 2025).
- In August 2024, Cargill, a global food and agriculture company, invested USD300 million in its protein business, including its textured vegetable protein (TVP) and textured soy protein (TSP) facilities. This significant investment demonstrated Cargill's commitment to expanding its plant-based protein production capacity to meet the increasing demand for alternative protein sources (Cargill press release, 2024)..
Research Analyst Overview
The market continues to evolve, driven by the increasing demand for high-quality, sustainable, and diverse protein sources. Hydrolyzed protein and protein isolate are popular choices for their superior digestibility and bioavailability, while protein certifications ensure transparency and trust in product quality. Organic protein and non-GMO protein cater to consumer preferences for natural and clean label options. Protein safety is a top priority, with rigorous testing and purification processes in place to ensure the highest standards. Pea protein and soy protein are gaining traction as plant-based alternatives to animal-derived proteins, addressing protein deficiency concerns and catering to vegan and vegetarian populations.
Protein formulation and innovation are key trends, with protein blends and protein stability technologies enhancing the functionality and effectiveness of protein products. Protein absorption and bioavailability are crucial factors, with research focusing on optimizing protein digestion and athletic performance. Protein industry players invest in protein processing and production technologies to meet the growing demand for protein-rich products. Protein powders, protein shakes, protein bars, and protein snacks are popular choices for weight management and muscle building, while protein recipes cater to the diverse culinary needs of consumers. Protein regulations and requirements continue to shape the market landscape, with ongoing research and innovation in protein synthesis and protein analysis driving future growth. The market is a dynamic and evolving space, with continuous unfolding of market activities and emerging patterns shaping its future trajectory.
Dive into Technavio's strong research methodology, blending expert interviews, extensive data synthesis, and validated models for unparalleled Protein Market insights. See full methodology.
|
Market Scope |
|
|
Report Coverage |
Details |
|
Page number |
208 |
|
Base year |
2024 |
|
Historic period |
2019-2023 |
|
Forecast period |
2025-2029 |
|
Growth momentum & CAGR |
Accelerate at a CAGR of 3.3% |
|
Market growth 2025-2029 |
USD 93.9 billion |
|
Market structure |
Fragmented |
|
YoY growth 2024-2025(%) |
3.2 |
|
Key countries |
US, China, Japan, India, South Korea, Australia, UK, Germany, France, and Italy |
|
Competitive landscape |
Leading Companies, Market Positioning of Companies, Competitive Strategies, and Industry Risks |
What are the Key Data Covered in this Protein Market Research and Growth Report?
- CAGR of the Protein industry during the forecast period
- Detailed information on factors that will drive the growth and forecasting between 2025 and 2029
- Precise estimation of the size of the market and its contribution of the industry in focus to the parent market
- Accurate predictions about upcoming growth and trends and changes in consumer behaviour
- Growth of the market across APAC, Europe, North America, South America, and Middle East and Africa
- Thorough analysis of the market's competitive landscape and detailed information about companies
- Comprehensive analysis of factors that will challenge the protein market growth of industry companies
We can help! Our analysts can customize this protein market research report to meet your requirements.
 RIA -
RIA - 
