Trampoline Market Analysis, Size, and Forecast 2026-2030: North America (US, Canada, and Mexico), Europe (Germany, UK, and France), APAC (China, Japan, and India), Middle East and Africa (UAE, Saudi Arabia, and South Africa), South America (Brazil and Argentina), and Rest of World (ROW)

Trampoline Market Analysis, Size, and Forecast 2026-2030:
North America (US, Canada, and Mexico), Europe (Germany, UK, and France), APAC (China, Japan, and India), Middle East and Africa (UAE, Saudi Arabia, and South Africa), South America (Brazil and Argentina), and Rest of World (ROW)

Published: Mar 2026 279 Pages SKU: IRTNTR40264

Market Overview at a Glance

$1.17 B
Market Opportunity
5.5%
CAGR 2025 - 2030
41.8%
North America Growth
$1.62 B
Round trampolines segment 2024

Trampoline Market Size 2026-2030

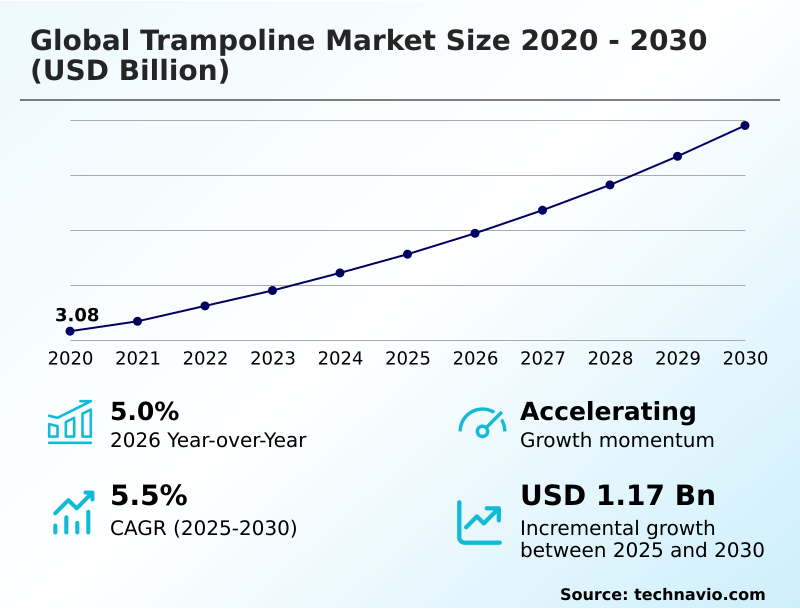
The trampoline market size is valued to increase by USD 1.17 billion, at a CAGR of 5.5% from 2025 to 2030. Expansion of family entertainment centers and indoor adventure parks will drive the trampoline market.

Major Market Trends & Insights

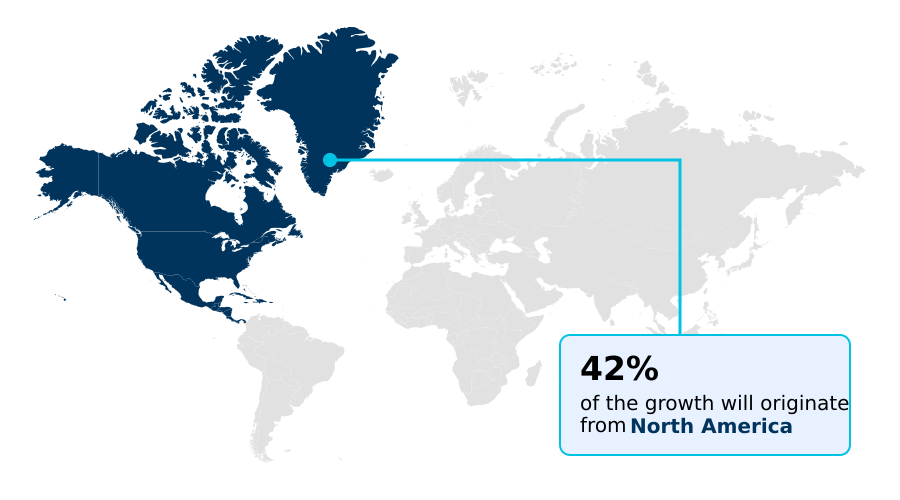
  • North America dominated the market and accounted for a 41.8% growth during the forecast period.
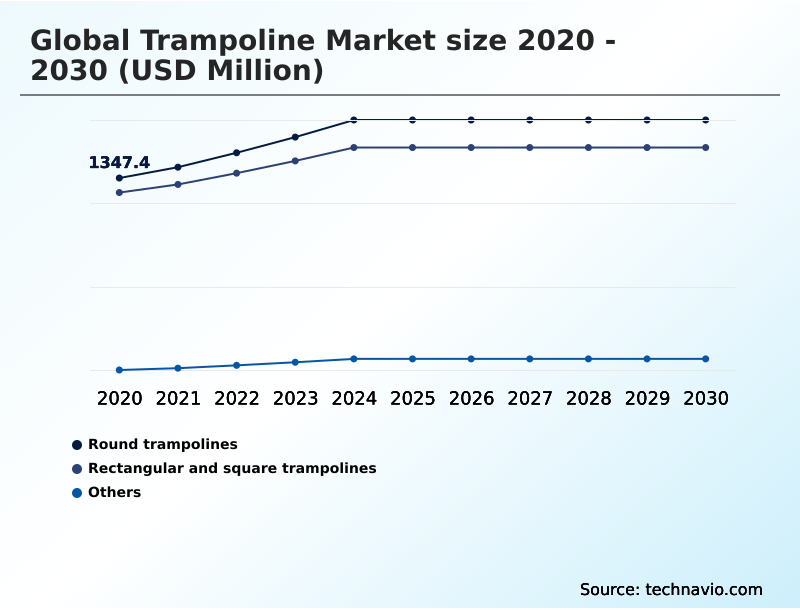
  • By Product - Round trampolines segment was valued at USD 1.62 billion in 2024
  • By End-user - Commercial segment accounted for the largest market revenue share in 2024

Market Size & Forecast

  • Market Opportunities: USD 1.88 billion
  • Market Future Opportunities: USD 1.17 billion
  • CAGR from 2025 to 2030 : 5.5%

Market Summary

  • The trampoline market is undergoing a significant transformation, evolving from a focus on simple recreational equipment to a sophisticated industry centered on active entertainment and athletic training. This shift is driven by the expansion of indoor adventure parks and a growing consumer demand for high-performance equipment for both residential and commercial use.
  • Innovations in safety, such as spring-free designs and advanced enclosure systems, are becoming standard. For instance, a commercial park operator leverages venue management solutions with digital waiver systems to streamline operations, reducing guest check-in times and enhancing safety compliance.
  • This focus on technology and safety, combined with the diversification into multi-attraction hubs featuring ninja warrior obstacle courses and augmented reality games, is reshaping the market. Challenges persist around regulatory complexity and supply chain volatility for materials like galvanized steel frames.
  • However, the integration of technology for both gamification and operational efficiency continues to create new opportunities, pushing the industry toward more immersive and safer user experiences that cater to a widening demographic, including fitness enthusiasts and competitive athletes seeking professional competition trampolines.

What will be the Size of the Trampoline Market during the forecast period?

Get Key Insights on Market Forecast (PDF) Request Free Sample

How is the Trampoline Market Segmented?

The trampoline industry research report provides comprehensive data (region-wise segment analysis), with forecasts and estimates in "USD million" for the period 2026-2030, as well as historical data from 2020-2024 for the following segments.

  • Product
    • Round trampolines
    • Rectangular and square trampolines
    • Others
  • End-user
    • Commercial
    • Individual
  • Distribution channel
    • Offline
    • Online
  • Geography
    • North America
      • US
      • Canada
      • Mexico
    • Europe
      • Germany
      • UK
      • France
    • APAC
      • China
      • Japan
      • India
    • Middle East and Africa
      • UAE
      • Saudi Arabia
      • South Africa
    • South America
      • Brazil
      • Argentina
    • Rest of World (ROW)

By Product Insights

The round trampolines segment is estimated to witness significant growth during the forecast period.

The market is segmented by product, end-user, and geography. North America is poised to contribute 41.8% of the market's incremental growth, driven by a strong preference for round trampolines in the residential sector.

These models, known for their self-centering mechanism, are foundational for backyard recreation. Innovation focuses on enhancing the safety enclosure net and using weather-resistant materials to extend product life. The institutional segment also influences this space, demanding certified equipment for training.

In the commercial realm, round trampolines are staples in family entertainment centers. This commercial diversification, combined with a focus on high-performance equipment, defines the segment's trajectory, moving beyond simple play to encompass athletic development and structured recreation.

Request Free Sample

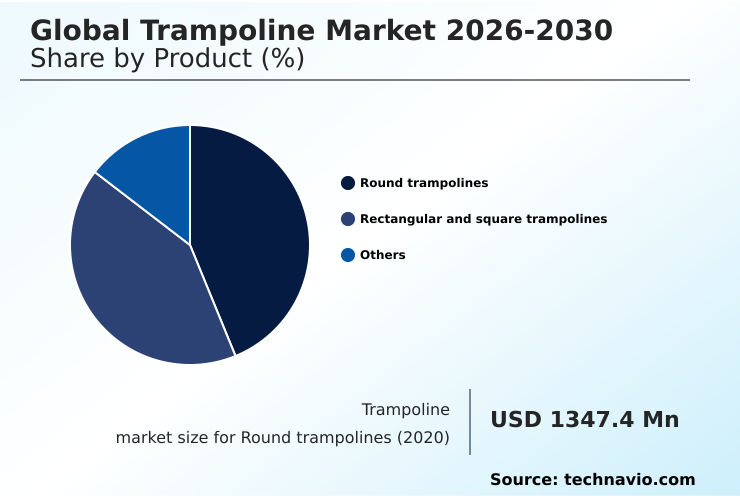
The Round trampolines segment was valued at USD 1.62 billion in 2024 and showed a gradual increase during the forecast period.

Request Free Sample

Regional Analysis

North America is estimated to contribute 41.8% to the growth of the global market during the forecast period.Technavio’s analysts have elaborately explained the regional trends and drivers that shape the market during the forecast period.

See How Trampoline Market Demand is Rising in North America Request Free Sample

The global trampoline market exhibits distinct regional dynamics, with North America leading in maturity and contributing over 41% of the market's incremental growth. In this region, a saturated commercial sector is driving innovation in phygital experiences and safety.

Europe, with a growth rate of 5.0%, is characterized by strict CEN safety standards and the adaptive reuse of retail spaces for indoor adventure parks.

The APAC region is the fastest-growing at 6.2%, fueled by a rising middle class seeking premium family entertainment centers in urban malls.

Across all regions, operators are adopting digital waiver systems and venue management solutions, which can improve operational efficiency by over 20%.

The institutional segment is also a key factor globally, with a consistent demand for high-performance equipment for trampoline gymnastics and competitive trampolining, driving a steady replacement cycle.

Market Dynamics

Our researchers analyzed the data with 2025 as the base year, along with the key drivers, trends, and challenges. A holistic analysis of drivers will help companies refine their marketing strategies to gain a competitive advantage.

  • Consumers and commercial operators are increasingly sophisticated in their purchasing decisions, leading to specific, long-tail inquiries that shape product development and marketing. Questions around the best round trampolines for safety features are common, pushing manufacturers to highlight innovations like weld-free frame structures.
  • The rectangular vs round trampoline for gymnastics debate drives sales of high-performance rectangular trampolines for athletes and those seeking a professional gymnastics trampoline for home use. The growing interest in in-ground trampoline installation cost and process reflects a trend toward landscape integration. Similarly, the popularity of spring-free trampoline benefits and drawbacks content shows a highly educated consumer base.
  • For the wellness market, searches for the best fitness rebounder for lymphatic drainage and the health benefits of using a fitness rebounder are prominent. In the B2B space, inquiries about commercial trampoline park equipment manufacturers and how to start an indoor trampoline park business are frequent. Operators also research trampoline park liability insurance requirements and franchise opportunities.
  • The rise of gamification is reflected in searches for augmented reality trampoline game system reviews and what a phygital trampoline game is. These detailed queries indicate that buyers are moving beyond basic features to demand specialized, high-value solutions, with facilities adopting advanced systems showing a 15% improvement in customer retention compared to those without.

What are the key market drivers leading to the rise in the adoption of Trampoline Industry?

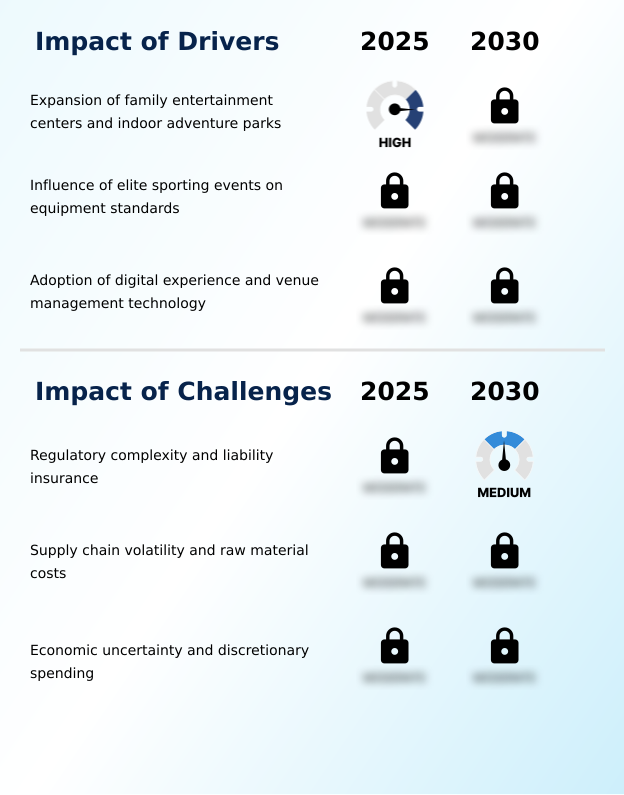
  • The primary market driver is the rapid expansion of family entertainment centers and indoor adventure parks, which are becoming anchor tenants in retail developments.

  • Market growth is primarily fueled by the strategic expansion of family entertainment centers, which are increasingly becoming anchor tenants in retail developments. This symbiotic relationship helps landlords drive foot traffic while providing operators with prime locations.
  • The influence of elite trampoline gymnastics and competitive trampolining also acts as a significant driver, creating a trickle-down demand for high-performance equipment in the institutional segment and among residential enthusiasts. This drives a consistent replacement cycle for certified equipment.
  • Furthermore, the adoption of digital venue management solutions is increasing park profitability, with some operators seeing a 10-15% uplift in average transaction values.
  • These efficiencies provide the capital for further expansion and investment in premium attractions, creating a self-sustaining growth loop for the active entertainment center model.

What are the market trends shaping the Trampoline Industry?

  • A dominant market trend is the commercial diversification from single-attraction venues to comprehensive, multi-attraction adventure hubs. This evolution aims to broaden demographic appeal and increase visitor engagement.

  • Key market trends are redefining the user experience and operational models. The most significant shift is commercial diversification, where operators are creating multi-attraction adventure hubs that serve as lifestyle destinations. This move broadens appeal beyond children, attracting teens and adults with offerings like ninja warrior obstacle courses. Another major trend is digital gamification, transforming passive play into active, phygital experiences.
  • The integration of augmented reality games and interactive projection walls drives repeat visits, with some parks reporting a 25% increase in visitor engagement. The residential aesthetic evolution is also notable, with demand for in-ground installations and muted color schemes growing. This design focus expands the addressable market to aesthetically conscious homeowners, improving product integration into outdoor living spaces.

What challenges does the Trampoline Industry face during its growth?

  • A key challenge restraining market growth stems from the increasing complexity of safety regulations and the rising costs of liability insurance for operators.

  • The market faces considerable headwinds from an increasingly stringent regulatory landscape and escalating operational costs. The primary challenge is regulatory complexity, with a lack of unified global standards forcing manufacturers to navigate a patchwork of regional rules like ASTM and CEN, which can increase R&D costs by up to 20%.
  • The associated issue of liability insurance is also intensifying, as rising premiums threaten the viability of smaller operators. Another critical restraint is supply chain volatility, particularly for raw materials like galvanized steel and polypropylene, where price fluctuations directly impact production costs and consumer pricing.
  • These factors, compounded by the sensitivity of the market to consumer discretionary spending during periods of economic uncertainty, require businesses to focus on operational resilience and value-driven offerings.

Exclusive Technavio Analysis on Customer Landscape

The trampoline market forecasting report includes the adoption lifecycle of the market, covering from the innovator’s stage to the laggard’s stage. It focuses on adoption rates in different regions based on penetration. Furthermore, the trampoline market report also includes key purchase criteria and drivers of price sensitivity to help companies evaluate and develop their market growth analysis strategies.

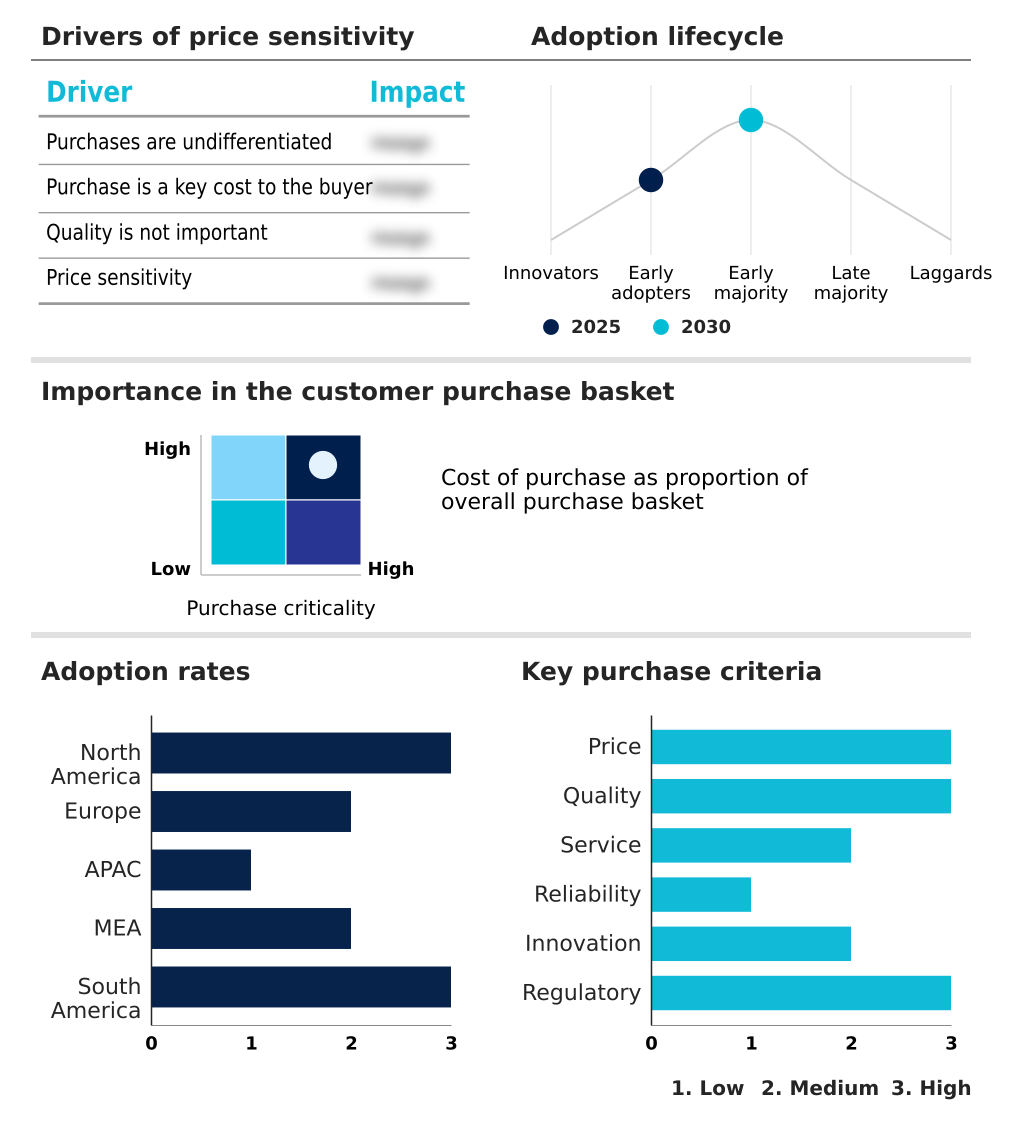
Customer Landscape of Trampoline Industry

Competitive Landscape

Companies are implementing various strategies, such as strategic alliances, trampoline market forecast, partnerships, mergers and acquisitions, geographical expansion, and product/service launches, to enhance their presence in the industry.

Bouncy Trampolines - Vendors provide a diverse portfolio of recreational and professional trampoline systems, encompassing spring-based and spring-free designs for residential, commercial, and competitive applications.

The industry research and growth report includes detailed analyses of the competitive landscape of the market and information about key companies, including:

  • Bouncy Trampolines
  • Domi Jump Inc.
  • Eurotramp Trampoline GmbH
  • Jump Star Trampolines
  • Jumpflex USA Limited
  • Jumpking Trampolines
  • JumpSport Inc.
  • North Trampoline Inc.
  • Plum Products Ltd
  • Sino Fourstar Group Co. Ltd.
  • SkyBound USA
  • Skywalker Holdings LLC
  • Sportspower Ltd.
  • Springfree Trampoline Inc.
  • Stamina Products Inc.
  • Super Jumper Inc.
  • Vuly Trampolines Pty Ltd.
  • Zhejiang Tianxin Co Ltd.

Qualitative and quantitative analysis of companies has been conducted to help clients understand the wider business environment as well as the strengths and weaknesses of key industry players. Data is qualitatively analyzed to categorize companies as pure play, category-focused, industry-focused, and diversified; it is quantitatively analyzed to categorize companies as dominant, leading, strong, tentative, and weak.

Recent Development and News in Trampoline market

  • In November, 2024, Roller Software released its 2025 Attractions Industry Benchmark Report, providing data that venues using integrated digital systems experienced higher average transaction values and repeat visits.
  • In February, 2025, Urban Air Adventure Park secured a lease for a new facility in Rowland Heights, California, reinforcing the strategy of integrating diverse attractions to expand consumer appeal.
  • In March, 2025, Springfree Trampoline's Costco Exclusive All-Black Jumbo Round Trampoline Bundle received the 2025 Family Choice Award, underscoring the market trend toward bundled, value-added accessories.
  • In April, 2025, Sky Zone expanded its presence in Texas with the grand opening of a new 40,000-square-foot facility in Frisco, highlighting the industry's focus on large-scale venues.

Dive into Technavio’s robust research methodology, blending expert interviews, extensive data synthesis, and validated models for unparalleled Trampoline Market insights. See full methodology.

Market Scope
Page number 279
Base year 2025
Historic period 2020-2024
Forecast period 2026-2030
Growth momentum & CAGR Accelerate at a CAGR of 5.5%
Market growth 2026-2030 USD 1168.3 million
Market structure Fragmented
YoY growth 2025-2026(%) 5.0%
Key countries US, Canada, Mexico, Germany, UK, France, Italy, Spain, The Netherlands, China, Japan, India, South Korea, Australia, Indonesia, UAE, Saudi Arabia, South Africa, Qatar, Nigeria, Brazil, Argentina and Chile
Competitive landscape Leading Companies, Market Positioning of Companies, Competitive Strategies, and Industry Risks

Request Free Sample

Research Analyst Overview

  • The trampoline market's architecture is defined by advancements in material science and safety engineering, moving far beyond basic recreational products. Core components like high-tensile springs and polypropylene jump mats now adhere to rigorous ASTM international standards and CEN safety standards, with TUV approval often being a key differentiator.
  • The industry is bifurcating into residential and commercial applications, with distinct innovations in each. The rise of spring-free design, using composite rod systems or leaf spring technology, directly addresses consumer safety concerns. In the commercial space, operators demand durable, commercial-grade apparatus with features like interactive projection walls and motion-tracking sensors.
  • For boardroom consideration, the adoption of integrated digital waiver systems is critical, as it has been shown to reduce administrative overhead by up to 30%, directly impacting profitability.
  • This technological integration, coupled with the demand for specialized equipment like rectangular performance trampolines and high-tension fitness trampolines, is compelling manufacturers to invest heavily in R&D to maintain a competitive edge through superior structural integrity and innovative features.

What are the Key Data Covered in this Trampoline Market Research and Growth Report?

  • What is the expected growth of the Trampoline Market between 2026 and 2030?

    • USD 1.17 billion, at a CAGR of 5.5%

  • What segmentation does the market report cover?

    • The report is segmented by Product (Round trampolines, Rectangular and square trampolines, and Others), End-user (Commercial, and Individual), Distribution Channel (Offline, and Online) and Geography (North America, Europe, APAC, Middle East and Africa, South America)

  • Which regions are analyzed in the report?

    • North America, Europe, APAC, Middle East and Africa and South America

  • What are the key growth drivers and market challenges?

    • Expansion of family entertainment centers and indoor adventure parks, Regulatory complexity and liability insurance

  • Who are the major players in the Trampoline Market?

    • Bouncy Trampolines, Domi Jump Inc., Eurotramp Trampoline GmbH, Jump Star Trampolines, Jumpflex USA Limited, Jumpking Trampolines, JumpSport Inc., North Trampoline Inc., Plum Products Ltd, Sino Fourstar Group Co. Ltd., SkyBound USA, Skywalker Holdings LLC, Sportspower Ltd., Springfree Trampoline Inc., Stamina Products Inc., Super Jumper Inc., Vuly Trampolines Pty Ltd. and Zhejiang Tianxin Co Ltd.

Market Research Insights

  • The market's momentum is heavily influenced by evolving consumer behaviors and operational efficiencies. The proliferation of family entertainment centers and multi-attraction adventure hubs is a direct response to demand for experiential retail, with operators leveraging these anchor tenants to drive foot traffic.
  • The adoption of advanced venue management solutions demonstrates a clear return, with some facilities reporting up to a 15% increase in repeat visitation rates after implementation. This commercial diversification is crucial as it mitigates risks tied to consumer discretionary spending. Furthermore, the residential aesthetic evolution is expanding the market to new households.
  • In regions like APAC, which shows a higher regional growth rate of 6.2% compared to Europe's 5.0%, the expansion of these lifestyle destinations is a key factor, demonstrating the global viability of the active entertainment center model.

We can help! Our analysts can customize this trampoline market research report to meet your requirements.

Get in touch

1. Executive Summary

1.1 Market overview

Executive Summary - Chart on Market Overview
Executive Summary - Data Table on Market Overview
Executive Summary - Chart on Global Market Characteristics
Executive Summary - Chart on Market by Geography
Executive Summary - Chart on Market Segmentation by Product
Executive Summary - Chart on Market Segmentation by End-user
Executive Summary - Chart on Market Segmentation by Distribution Channel
Executive Summary - Chart on Incremental Growth
Executive Summary - Data Table on Incremental Growth
Executive Summary - Chart on Company Market Positioning

2. Technavio Analysis

2.1 Analysis of price sensitivity, lifecycle, customer purchase basket, adoption rates, and purchase criteria

2.2 Criticality of inputs and Factors of differentiation

Chart on Overview on criticality of inputs and factors of differentiation

2.3 Factors of disruption

Chart on Overview on factors of disruption

2.4 Impact of drivers and challenges

Chart on Impact of drivers and challenges in 2025 and 2030

3. Market Landscape

3.1 Market ecosystem

Chart on Parent Market
Data Table on - Parent Market

3.2 Market characteristics

Chart on Market characteristics analysis

3.3 Value chain analysis

Chart on Value chain analysis

4. Market Sizing

4.1 Market definition

Data Table on Offerings of companies included in the market definition

4.2 Market segment analysis

Market segments

4.3 Market size 2025

4.4 Market outlook: Forecast for 2025-2030

Chart on Global - Market size and forecast 2025-2030 ($ million)
Data Table on Global - Market size and forecast 2025-2030 ($ million)
Chart on Global Market: Year-over-year growth 2025-2030 (%)
Data Table on Global Market: Year-over-year growth 2025-2030 (%)

5. Historic Market Size

5.1 Global Trampoline Market 2020 - 2024

Historic Market Size - Data Table on Global Trampoline Market 2020 - 2024 ($ million)

5.2 Product segment analysis 2020 - 2024

Historic Market Size - Product Segment 2020 - 2024 ($ million)

5.3 End-user segment analysis 2020 - 2024

Historic Market Size - End-user Segment 2020 - 2024 ($ million)

5.4 Distribution Channel segment analysis 2020 - 2024

Historic Market Size - Distribution Channel Segment 2020 - 2024 ($ million)

5.5 Geography segment analysis 2020 - 2024

Historic Market Size - Geography Segment 2020 - 2024 ($ million)

5.6 Country segment analysis 2020 - 2024

Historic Market Size - Country Segment 2020 - 2024 ($ million)

6. Qualitative Analysis

6.1 Impact of AI on the Global Trampoline Market

7. Five Forces Analysis

7.1 Five forces summary

Five forces analysis - Comparison between 2025 and 2030

7.2 Bargaining power of buyers

Bargaining power of buyers - Impact of key factors 2025 and 2030

7.3 Bargaining power of suppliers

Bargaining power of suppliers - Impact of key factors in 2025 and 2030

7.4 Threat of new entrants

Threat of new entrants - Impact of key factors in 2025 and 2030

7.5 Threat of substitutes

Threat of substitutes - Impact of key factors in 2025 and 2030

7.6 Threat of rivalry

Threat of rivalry - Impact of key factors in 2025 and 2030

7.7 Market condition

Chart on Market condition - Five forces 2025 and 2030

8. Market Segmentation by Product

8.1 Market segments

Chart on Product - Market share 2025-2030 (%)
Data Table on Product - Market share 2025-2030 (%)

8.2 Comparison by Product

Chart on Comparison by Product
Data Table on Comparison by Product

8.3 Round trampolines - Market size and forecast 2025-2030

Chart on Round trampolines - Market size and forecast 2025-2030 ($ million)
Data Table on Round trampolines - Market size and forecast 2025-2030 ($ million)
Chart on Round trampolines - Year-over-year growth 2025-2030 (%)
Data Table on Round trampolines - Year-over-year growth 2025-2030 (%)

8.4 Rectangular and square trampolines - Market size and forecast 2025-2030

Chart on Rectangular and square trampolines - Market size and forecast 2025-2030 ($ million)
Data Table on Rectangular and square trampolines - Market size and forecast 2025-2030 ($ million)
Chart on Rectangular and square trampolines - Year-over-year growth 2025-2030 (%)
Data Table on Rectangular and square trampolines - Year-over-year growth 2025-2030 (%)

8.5 Others - Market size and forecast 2025-2030

Chart on Others - Market size and forecast 2025-2030 ($ million)
Data Table on Others - Market size and forecast 2025-2030 ($ million)
Chart on Others - Year-over-year growth 2025-2030 (%)
Data Table on Others - Year-over-year growth 2025-2030 (%)

8.6 Market opportunity by Product

Market opportunity by Product ($ million)
Data Table on Market opportunity by Product ($ million)

9. Market Segmentation by End-user

9.1 Market segments

Chart on End-user - Market share 2025-2030 (%)
Data Table on End-user - Market share 2025-2030 (%)

9.2 Comparison by End-user

Chart on Comparison by End-user
Data Table on Comparison by End-user

9.3 Commercial - Market size and forecast 2025-2030

Chart on Commercial - Market size and forecast 2025-2030 ($ million)
Data Table on Commercial - Market size and forecast 2025-2030 ($ million)
Chart on Commercial - Year-over-year growth 2025-2030 (%)
Data Table on Commercial - Year-over-year growth 2025-2030 (%)

9.4 Individual - Market size and forecast 2025-2030

Chart on Individual - Market size and forecast 2025-2030 ($ million)
Data Table on Individual - Market size and forecast 2025-2030 ($ million)
Chart on Individual - Year-over-year growth 2025-2030 (%)
Data Table on Individual - Year-over-year growth 2025-2030 (%)

9.5 Market opportunity by End-user

Market opportunity by End-user ($ million)
Data Table on Market opportunity by End-user ($ million)

10. Market Segmentation by Distribution Channel

10.1 Market segments

Chart on Distribution Channel - Market share 2025-2030 (%)
Data Table on Distribution Channel - Market share 2025-2030 (%)

10.2 Comparison by Distribution Channel

Chart on Comparison by Distribution Channel
Data Table on Comparison by Distribution Channel

10.3 Offline - Market size and forecast 2025-2030

Chart on Offline - Market size and forecast 2025-2030 ($ million)
Data Table on Offline - Market size and forecast 2025-2030 ($ million)
Chart on Offline - Year-over-year growth 2025-2030 (%)
Data Table on Offline - Year-over-year growth 2025-2030 (%)

10.4 Online - Market size and forecast 2025-2030

Chart on Online - Market size and forecast 2025-2030 ($ million)
Data Table on Online - Market size and forecast 2025-2030 ($ million)
Chart on Online - Year-over-year growth 2025-2030 (%)
Data Table on Online - Year-over-year growth 2025-2030 (%)

10.5 Market opportunity by Distribution Channel

Market opportunity by Distribution Channel ($ million)
Data Table on Market opportunity by Distribution Channel ($ million)

11. Customer Landscape

11.1 Customer landscape overview

Analysis of price sensitivity, lifecycle, customer purchase basket, adoption rates, and purchase criteria

12. Geographic Landscape

12.1 Geographic segmentation

Chart on Market share by geography 2025-2030 (%)
Data Table on Market share by geography 2025-2030 (%)

12.2 Geographic comparison

Chart on Geographic comparison
Data Table on Geographic comparison

12.3 North America - Market size and forecast 2025-2030

Chart on North America - Market size and forecast 2025-2030 ($ million)
Data Table on North America - Market size and forecast 2025-2030 ($ million)
Chart on North America - Year-over-year growth 2025-2030 (%)
Data Table on North America - Year-over-year growth 2025-2030 (%)
Chart on Regional Comparison - North America
Data Table on Regional Comparison - North America

12.3.1 US - Market size and forecast 2025-2030

Chart on US - Market size and forecast 2025-2030 ($ million)
Data Table on US - Market size and forecast 2025-2030 ($ million)
Chart on US - Year-over-year growth 2025-2030 (%)
Data Table on US - Year-over-year growth 2025-2030 (%)

12.3.2 Canada - Market size and forecast 2025-2030

Chart on Canada - Market size and forecast 2025-2030 ($ million)
Data Table on Canada - Market size and forecast 2025-2030 ($ million)
Chart on Canada - Year-over-year growth 2025-2030 (%)
Data Table on Canada - Year-over-year growth 2025-2030 (%)

12.3.3 Mexico - Market size and forecast 2025-2030

Chart on Mexico - Market size and forecast 2025-2030 ($ million)
Data Table on Mexico - Market size and forecast 2025-2030 ($ million)
Chart on Mexico - Year-over-year growth 2025-2030 (%)
Data Table on Mexico - Year-over-year growth 2025-2030 (%)

12.4 Europe - Market size and forecast 2025-2030

Chart on Europe - Market size and forecast 2025-2030 ($ million)
Data Table on Europe - Market size and forecast 2025-2030 ($ million)
Chart on Europe - Year-over-year growth 2025-2030 (%)
Data Table on Europe - Year-over-year growth 2025-2030 (%)
Chart on Regional Comparison - Europe
Data Table on Regional Comparison - Europe

12.4.1 Germany - Market size and forecast 2025-2030

Chart on Germany - Market size and forecast 2025-2030 ($ million)
Data Table on Germany - Market size and forecast 2025-2030 ($ million)
Chart on Germany - Year-over-year growth 2025-2030 (%)
Data Table on Germany - Year-over-year growth 2025-2030 (%)

12.4.2 UK - Market size and forecast 2025-2030

Chart on UK - Market size and forecast 2025-2030 ($ million)
Data Table on UK - Market size and forecast 2025-2030 ($ million)
Chart on UK - Year-over-year growth 2025-2030 (%)
Data Table on UK - Year-over-year growth 2025-2030 (%)

12.4.3 France - Market size and forecast 2025-2030

Chart on France - Market size and forecast 2025-2030 ($ million)
Data Table on France - Market size and forecast 2025-2030 ($ million)
Chart on France - Year-over-year growth 2025-2030 (%)
Data Table on France - Year-over-year growth 2025-2030 (%)

12.4.4 Italy - Market size and forecast 2025-2030

Chart on Italy - Market size and forecast 2025-2030 ($ million)
Data Table on Italy - Market size and forecast 2025-2030 ($ million)
Chart on Italy - Year-over-year growth 2025-2030 (%)
Data Table on Italy - Year-over-year growth 2025-2030 (%)

12.4.5 Spain - Market size and forecast 2025-2030

Chart on Spain - Market size and forecast 2025-2030 ($ million)
Data Table on Spain - Market size and forecast 2025-2030 ($ million)
Chart on Spain - Year-over-year growth 2025-2030 (%)
Data Table on Spain - Year-over-year growth 2025-2030 (%)

12.4.6 The Netherlands - Market size and forecast 2025-2030

Chart on The Netherlands - Market size and forecast 2025-2030 ($ million)
Data Table on The Netherlands - Market size and forecast 2025-2030 ($ million)
Chart on The Netherlands - Year-over-year growth 2025-2030 (%)
Data Table on The Netherlands - Year-over-year growth 2025-2030 (%)

12.5 APAC - Market size and forecast 2025-2030

Chart on APAC - Market size and forecast 2025-2030 ($ million)
Data Table on APAC - Market size and forecast 2025-2030 ($ million)
Chart on APAC - Year-over-year growth 2025-2030 (%)
Data Table on APAC - Year-over-year growth 2025-2030 (%)
Chart on Regional Comparison - APAC
Data Table on Regional Comparison - APAC

12.5.1 China - Market size and forecast 2025-2030

Chart on China - Market size and forecast 2025-2030 ($ million)
Data Table on China - Market size and forecast 2025-2030 ($ million)
Chart on China - Year-over-year growth 2025-2030 (%)
Data Table on China - Year-over-year growth 2025-2030 (%)

12.5.2 Japan - Market size and forecast 2025-2030

Chart on Japan - Market size and forecast 2025-2030 ($ million)
Data Table on Japan - Market size and forecast 2025-2030 ($ million)
Chart on Japan - Year-over-year growth 2025-2030 (%)
Data Table on Japan - Year-over-year growth 2025-2030 (%)

12.5.3 India - Market size and forecast 2025-2030

Chart on India - Market size and forecast 2025-2030 ($ million)
Data Table on India - Market size and forecast 2025-2030 ($ million)
Chart on India - Year-over-year growth 2025-2030 (%)
Data Table on India - Year-over-year growth 2025-2030 (%)

12.5.4 South Korea - Market size and forecast 2025-2030

Chart on South Korea - Market size and forecast 2025-2030 ($ million)
Data Table on South Korea - Market size and forecast 2025-2030 ($ million)
Chart on South Korea - Year-over-year growth 2025-2030 (%)
Data Table on South Korea - Year-over-year growth 2025-2030 (%)

12.5.5 Australia - Market size and forecast 2025-2030

Chart on Australia - Market size and forecast 2025-2030 ($ million)
Data Table on Australia - Market size and forecast 2025-2030 ($ million)
Chart on Australia - Year-over-year growth 2025-2030 (%)
Data Table on Australia - Year-over-year growth 2025-2030 (%)

12.5.6 Indonesia - Market size and forecast 2025-2030

Chart on Indonesia - Market size and forecast 2025-2030 ($ million)
Data Table on Indonesia - Market size and forecast 2025-2030 ($ million)
Chart on Indonesia - Year-over-year growth 2025-2030 (%)
Data Table on Indonesia - Year-over-year growth 2025-2030 (%)

12.6 Middle East and Africa - Market size and forecast 2025-2030

Chart on Middle East and Africa - Market size and forecast 2025-2030 ($ million)
Data Table on Middle East and Africa - Market size and forecast 2025-2030 ($ million)
Chart on Middle East and Africa - Year-over-year growth 2025-2030 (%)
Data Table on Middle East and Africa - Year-over-year growth 2025-2030 (%)
Chart on Regional Comparison - Middle East and Africa
Data Table on Regional Comparison - Middle East and Africa

12.6.1 UAE - Market size and forecast 2025-2030

Chart on UAE - Market size and forecast 2025-2030 ($ million)
Data Table on UAE - Market size and forecast 2025-2030 ($ million)
Chart on UAE - Year-over-year growth 2025-2030 (%)
Data Table on UAE - Year-over-year growth 2025-2030 (%)

12.6.2 Saudi Arabia - Market size and forecast 2025-2030

Chart on Saudi Arabia - Market size and forecast 2025-2030 ($ million)
Data Table on Saudi Arabia - Market size and forecast 2025-2030 ($ million)
Chart on Saudi Arabia - Year-over-year growth 2025-2030 (%)
Data Table on Saudi Arabia - Year-over-year growth 2025-2030 (%)

12.6.3 South Africa - Market size and forecast 2025-2030

Chart on South Africa - Market size and forecast 2025-2030 ($ million)
Data Table on South Africa - Market size and forecast 2025-2030 ($ million)
Chart on South Africa - Year-over-year growth 2025-2030 (%)
Data Table on South Africa - Year-over-year growth 2025-2030 (%)

12.6.4 Qatar - Market size and forecast 2025-2030

Chart on Qatar - Market size and forecast 2025-2030 ($ million)
Data Table on Qatar - Market size and forecast 2025-2030 ($ million)
Chart on Qatar - Year-over-year growth 2025-2030 (%)
Data Table on Qatar - Year-over-year growth 2025-2030 (%)

12.6.5 Nigeria - Market size and forecast 2025-2030

Chart on Nigeria - Market size and forecast 2025-2030 ($ million)
Data Table on Nigeria - Market size and forecast 2025-2030 ($ million)
Chart on Nigeria - Year-over-year growth 2025-2030 (%)
Data Table on Nigeria - Year-over-year growth 2025-2030 (%)

12.7 South America - Market size and forecast 2025-2030

Chart on South America - Market size and forecast 2025-2030 ($ million)
Data Table on South America - Market size and forecast 2025-2030 ($ million)
Chart on South America - Year-over-year growth 2025-2030 (%)
Data Table on South America - Year-over-year growth 2025-2030 (%)
Chart on Regional Comparison - South America
Data Table on Regional Comparison - South America

12.7.1 Brazil - Market size and forecast 2025-2030

Chart on Brazil - Market size and forecast 2025-2030 ($ million)
Data Table on Brazil - Market size and forecast 2025-2030 ($ million)
Chart on Brazil - Year-over-year growth 2025-2030 (%)
Data Table on Brazil - Year-over-year growth 2025-2030 (%)

12.7.2 Argentina - Market size and forecast 2025-2030

Chart on Argentina - Market size and forecast 2025-2030 ($ million)
Data Table on Argentina - Market size and forecast 2025-2030 ($ million)
Chart on Argentina - Year-over-year growth 2025-2030 (%)
Data Table on Argentina - Year-over-year growth 2025-2030 (%)

12.7.3 Chile - Market size and forecast 2025-2030

Chart on Chile - Market size and forecast 2025-2030 ($ million)
Data Table on Chile - Market size and forecast 2025-2030 ($ million)
Chart on Chile - Year-over-year growth 2025-2030 (%)
Data Table on Chile - Year-over-year growth 2025-2030 (%)

12.8 Market opportunity by geography

Market opportunity by geography ($ million)
Data Tables on Market opportunity by geography ($ million)

13. Drivers, Challenges, and Opportunity

13.1 Market drivers

Expansion of family entertainment centers and indoor adventure parks
Influence of elite sporting events on equipment standards
Adoption of digital experience and venue management technology

13.2 Market challenges

Regulatory complexity and liability insurance
Supply chain volatility and raw material costs
Economic uncertainty and discretionary spending

13.3 Impact of drivers and challenges

Impact of drivers and challenges in 2025 and 2030

13.4 Market opportunities

Commercial diversification into multi-attraction adventure hubs
Technological integration and gamification of active play
Residential aesthetic evolution and landscape integration

14. Competitive Landscape

14.1 Overview

14.2

Overview on criticality of inputs and factors of differentiation

14.3 Landscape disruption

Overview on factors of disruption

14.4 Industry risks

Impact of key risks on business

15. Competitive Analysis

15.1 Companies profiled

Companies covered

15.2 Company ranking index

15.3 Market positioning of companies

Matrix on companies position and classification

15.4 Bouncy Trampolines

Bouncy Trampolines - Overview
Bouncy Trampolines - Product / Service
Bouncy Trampolines - Key offerings
SWOT

15.5 Domi Jump Inc.

Domi Jump Inc. - Overview
Domi Jump Inc. - Product / Service
Domi Jump Inc. - Key offerings
SWOT

15.6 Eurotramp Trampoline GmbH

Eurotramp Trampoline GmbH - Overview
Eurotramp Trampoline GmbH - Product / Service
Eurotramp Trampoline GmbH - Key offerings
SWOT

15.7 Jump Star Trampolines

Jump Star Trampolines - Overview
Jump Star Trampolines - Product / Service
Jump Star Trampolines - Key offerings
SWOT

15.8 Jumpflex USA Limited

Jumpflex USA Limited - Overview
Jumpflex USA Limited - Product / Service
Jumpflex USA Limited - Key offerings
SWOT

15.9 Jumpking Trampolines

Jumpking Trampolines - Overview
Jumpking Trampolines - Product / Service
Jumpking Trampolines - Key offerings
SWOT

15.10 JumpSport Inc.

JumpSport Inc. - Overview
JumpSport Inc. - Product / Service
JumpSport Inc. - Key offerings
SWOT

15.11 North Trampoline Inc.

North Trampoline Inc. - Overview
North Trampoline Inc. - Product / Service
North Trampoline Inc. - Key offerings
SWOT

15.12 Plum Products Ltd

Plum Products Ltd - Overview
Plum Products Ltd - Product / Service
Plum Products Ltd - Key offerings
SWOT

15.13 Sino Fourstar Group Co. Ltd.

Sino Fourstar Group Co. Ltd. - Overview
Sino Fourstar Group Co. Ltd. - Product / Service
Sino Fourstar Group Co. Ltd. - Key offerings
SWOT

15.14 SkyBound USA

SkyBound USA - Overview
SkyBound USA - Product / Service
SkyBound USA - Key offerings
SWOT

15.15 Skywalker Holdings LLC

Skywalker Holdings LLC - Overview
Skywalker Holdings LLC - Product / Service
Skywalker Holdings LLC - Key offerings
SWOT

15.16 Sportspower Ltd.

Sportspower Ltd. - Overview
Sportspower Ltd. - Product / Service
Sportspower Ltd. - Key offerings
SWOT

15.17 Springfree Trampoline Inc.

Springfree Trampoline Inc. - Overview
Springfree Trampoline Inc. - Product / Service
Springfree Trampoline Inc. - Key offerings
SWOT

15.18 Vuly Trampolines Pty Ltd.

Vuly Trampolines Pty Ltd. - Overview
Vuly Trampolines Pty Ltd. - Product / Service
Vuly Trampolines Pty Ltd. - Key offerings
SWOT

16. Appendix

16.1 Scope of the report

Market definition
Objectives
Notes and caveats

16.2 Inclusions and exclusions checklist

Inclusions checklist
Exclusions checklist

16.3 Currency conversion rates for US$

16.4 Research methodology

16.5 Data procurement

Information sources

16.6 Data validation

16.7 Validation techniques employed for market sizing

16.8 Data synthesis

16.9 360 degree market analysis

16.10 List of abbreviations

Research Methodology

Technavio presents a detailed picture of the market by way of study, synthesis, and summation of data from multiple sources. The analysts have presented the various facets of the market with a particular focus on identifying the key industry influencers. The data thus presented is comprehensive, reliable, and the result of extensive research, both primary and secondary.

INFORMATION SOURCES

Primary sources

  • Manufacturers and suppliers
  • Channel partners
  • Industry experts
  • Strategic decision makers

Secondary sources

  • Industry journals and periodicals
  • Government data
  • Financial reports of key industry players
  • Historical data
  • Press releases

DATA ANALYSIS

Data Synthesis

  • Collation of data
  • Estimation of key figures
  • Analysis of derived insights

Data Validation

  • Triangulation with data models
  • Reference against proprietary databases
  • Corroboration with industry experts

REPORT WRITING

Qualitative

  • Market drivers
  • Market challenges
  • Market trends
  • Five forces analysis

Quantitative

  • Market size and forecast
  • Market segmentation
  • Geographical insights
  • Competitive landscape

Interested in this report?

Get your sample now to see our research methodology and insights!

Download Now

Frequently Asked Questions

Trampoline market growth will increase by USD 1168.3 million during 2026-2030.

The Trampoline market is expected to grow at a CAGR of 5.5% during 2026-2030.

Trampoline market is segmented by Product (Round trampolines, Rectangular and square trampolines, Others) End-user (Commercial, Individual) Distribution channel (Offline, Online)

Bouncy Trampolines, Domi Jump Inc., Eurotramp Trampoline GmbH, Jump Star Trampolines, Jumpflex USA Limited, Jumpking Trampolines, JumpSport Inc., North Trampoline Inc., Plum Products Ltd, Sino Fourstar Group Co. Ltd., SkyBound USA, Skywalker Holdings LLC, Sportspower Ltd., Springfree Trampoline Inc., Stamina Products Inc., Super Jumper Inc., Vuly Trampolines Pty Ltd., Zhejiang Tianxin Co Ltd. are a few of the key vendors in the Trampoline market.

North America will register the highest growth rate of 41.8% among the other regions. Therefore, the Trampoline market in North America is expected to garner significant business opportunities for the vendors during the forecast period.

US, Canada, Mexico, Germany, UK, France, Italy, Spain, The Netherlands, China, Japan, India, South Korea, Australia, Indonesia, UAE, Saudi Arabia, South Africa, Qatar, Nigeria, Brazil, Argentina, Chile

  • Expansion of family entertainment centers and indoor adventure parks is the driving factor this market.

The Trampoline market vendors should focus on grabbing business opportunities from the Product segment as it accounted for the largest market share in the base year.
RIA - Research AI Assistant
Ask RIA