
AI In Media And Entertainment Industry Market Analysis, Size, and Forecast 2026-2030: North America (US, Canada, and Mexico), Europe (UK, Germany, and France), APAC (China, Japan, and India), South America (Brazil, Argentina, and Chile), Middle East and Africa (UAE, Saudi Arabia, and South Africa), and Rest of World (ROW)

AI In Media And Entertainment Industry Market Analysis, Size, and Forecast 2026-2030:
North America (US, Canada, and Mexico), Europe (UK, Germany, and France), APAC (China, Japan, and India), South America (Brazil, Argentina, and Chile), Middle East and Africa (UAE, Saudi Arabia, and South Africa), and Rest of World (ROW)

Published: Oct 2026 309 Pages SKU: IRTNTR80208

Market Overview at a Glance

$48.91 B
Market Opportunity
26.6%
CAGR 2025 - 2030
36.9%
North America Growth
$10.79 B
Machine learning segment 2024

Ai In Media And Entertainment Industry Market Size 2026-2030

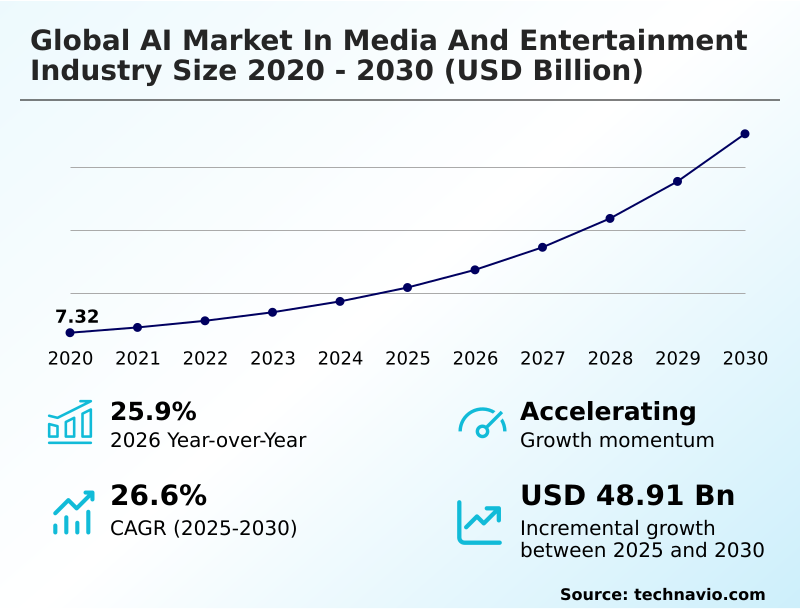
The ai in media and entertainment industry market size is valued to increase by USD 48.91 billion, at a CAGR of 26.6% from 2025 to 2030. Custom multimodal foundation models accelerate cinematic preproduction workflow automation efficiency will drive the ai in media and entertainment industry market.

Major Market Trends & Insights

  • North America dominated the market and accounted for a 36.9% growth during the forecast period.
  • By Technology - Machine learning segment was valued at USD 10.79 billion in 2024
  • By End-user - Media companies segment accounted for the largest market revenue share in 2024

Market Size & Forecast

  • Market Opportunities: USD 63.29 billion
  • Market Future Opportunities: USD 48.91 billion
  • CAGR from 2025 to 2030 : 26.6%

Market Summary

  • The AI In Media And Entertainment Industry functions as the critical computational infrastructure enabling modern content generation, behavioral targeting, and production automation. Media enterprises systematically transition from manual editing pipelines to dynamic programmatic ad delivery systems to scale personalized audience engagement.
  • In real-world broadcast operations, integrating generative neural networks allows digital publishers to automate closed caption synthesis and metadata extraction, driving massive supply chain efficiencies. Organizations deploying these advanced tools report a 45% acceleration in post-production delivery timelines compared to traditional manual workflows.
  • The urgent necessity to minimize physical production expenditures acts as a primary driver, as automated video editing capabilities drastically reduce expensive on-location reshoots. Conversely, the market faces significant structural constraints due to intellectual property disputes over training data.
  • Unauthorized ingestion of copyrighted material triggers complex legal liabilities, causing enterprise distributors to delay massive deployments until formalized synthetic media authentication standards provide absolute compliance guarantees.

What will be the Size of the Ai In Media And Entertainment Industry Market during the forecast period?
Get Key Insights on Market Forecast (PDF) Get Free Sample

How is the Ai In Media And Entertainment Industry Market Segmented?

The ai in media and entertainment industry industry research report provides comprehensive data (region-wise segment analysis), with forecasts and estimates in "USD million" for the period 2026-2030, as well as historical data from 2020-2024 for the following segments.

  • Technology
    • Machine learning
    • Computer vision
    • Speech recognition
  • End-user
    • Media companies
    • Gaming industry
    • Advertising agencies
    • Film production houses
  • Solution
    • Software
    • Services
    • Hardware
  • Geography
    • North America
      • US
      • Canada
      • Mexico
    • Europe
      • UK
      • Germany
      • France
      • Italy
      • Spain
      • The Netherlands
    • APAC
      • China
      • Japan
      • India
      • South Korea
      • Australia
      • Singapore
    • South America
      • Brazil
      • Argentina
      • Chile
    • Middle East and Africa
      • UAE
      • Saudi Arabia
      • South Africa
      • Israel
      • Qatar

By Technology Insights

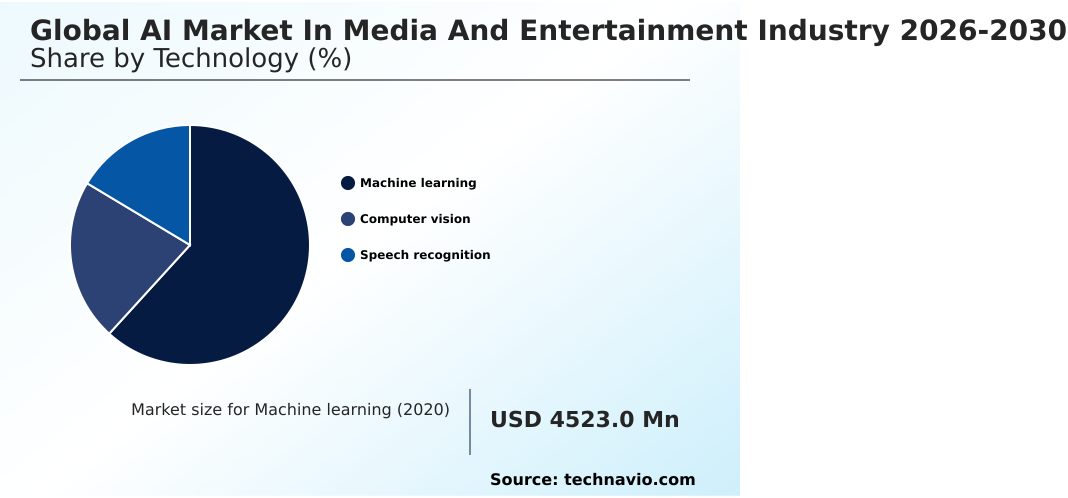
The machine learning segment is estimated to witness significant growth during the forecast period.

Machine learning models fundamentally restructure the AI In Media And Entertainment Industry by shifting reliance from manual editing toward dynamic ad insertion and automated workflow optimization.

Streaming platforms deploy advanced machine learning architectures to process massive subscriber interaction datasets, driving a structural change in how media is consumed and monetized. This continuous algorithmic refinement significantly enhances real-time predictive analytics, allowing broadcasters to adapt programming instantly.

Consequently, user retention metrics improve, with hyper personalized user interfaces reducing platform abandonment by up to 18%. By leveraging predictive audience analytics alongside predictive distribution models, content distributors uncover niche viewer segments, maximizing the commercial lifecycle of legacy assets.

The integration of contextual transformer models enables organizations to surface hyper-relevant digital media, proving essential for modern advertising and algorithmic content recommendation strategies.
Get Free Sample

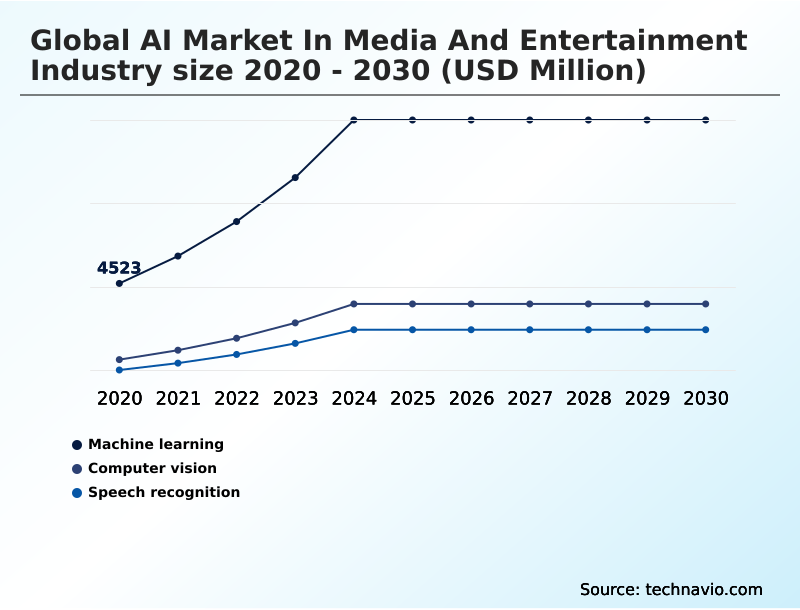
The Machine learning segment was valued at USD 10.79 billion in 2024 and showed a gradual increase during the forecast period.
Get Free Sample

Regional Analysis

North America is estimated to contribute 36.9% to the growth of the global market during the forecast period.Technavio’s analysts have elaborately explained the regional trends and drivers that shape the market during the forecast period.
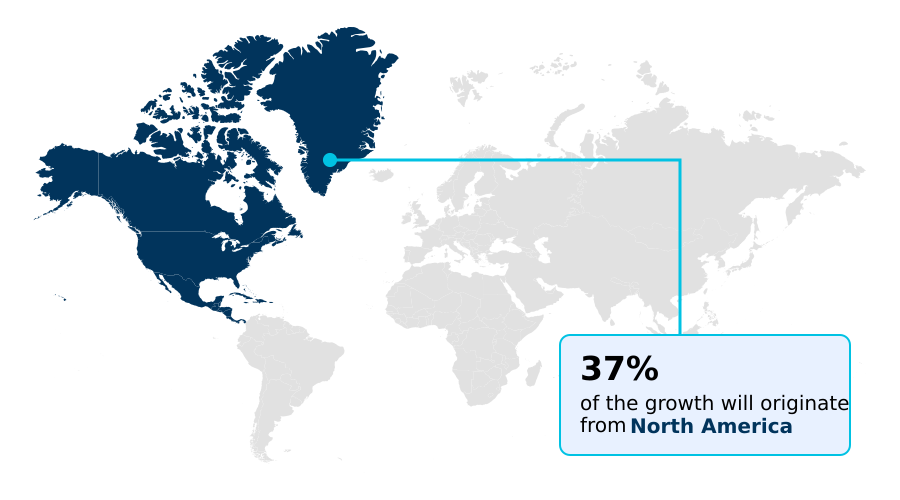
See How Ai In Media And Entertainment Industry Market Demand is Rising in North America Get Free Sample

The AI In Media And Entertainment Industry demonstrates stark operational contrasts between North America and APAC, driven by variations in legacy infrastructure and digital asset management adoption.

North America leads early enterprise adoption, where major studios heavily utilize spatial neural radiance fields and virtual set production to reduce physical filming costs. Facilities in this region have successfully compressed post-production timelines by 30% using autonomous visual generation.

In contrast, APAC experiences hyper-growth driven by mobile-first consumer habits, where platforms rely on localized audio dubbing and automated language translation to cross regional language barriers.

This strategic focus yields a 40% higher adoption rate of automated lip sync alignment compared to European markets.

Consequently, North American entities prioritize digital rights management to protect proprietary libraries, while Asian broadcasters prioritize real-time visual effects and programmatic ad delivery to maximize mobile user monetization.

Market Dynamics

Our researchers analyzed the data with 2025 as the base year, along with the key drivers, trends, and challenges. A holistic analysis of drivers will help companies refine their marketing strategies to gain a competitive advantage.

  • The operational framework of the AI In Media And Entertainment Industry is rapidly shifting as digital broadcasting ecosystems integrate advanced computational models to eliminate traditional creative bottlenecks. Enterprise media organizations are heavily investing in generative video model commercial deployment to synthesize highly realistic background environments, effectively bypassing the logistical constraints of physical location shooting.
  • By establishing automated pipelines, post-production teams achieve superior output speeds, rendering complex sequences up to three times faster than legacy manual rendering workflows. This operational efficiency is further enhanced by autonomous preproduction visual effects rendering, which allows directors to visualize intricate cinematic concepts instantly during the conceptual phase.
  • Furthermore, targeted marketing efforts are transformed through dynamic programmatic advertising budget optimization, enabling agencies to allocate capital instantly based on real-time viewer engagement signals rather than static historical data. Content localization, a historically labor-intensive compliance and distribution function, is now streamlined via synthetic voice cloning localization workflows.
  • This advancement allows global streaming platforms to distribute programming across diverse linguistic markets without the immense overhead of traditional recording studios. Ultimately, executing a predictive audience analytics operational integration ensures that digital media platforms can accurately forecast content performance and subscriber churn, securing long-term viewer retention and maximizing the commercial viability of extensive proprietary entertainment libraries.
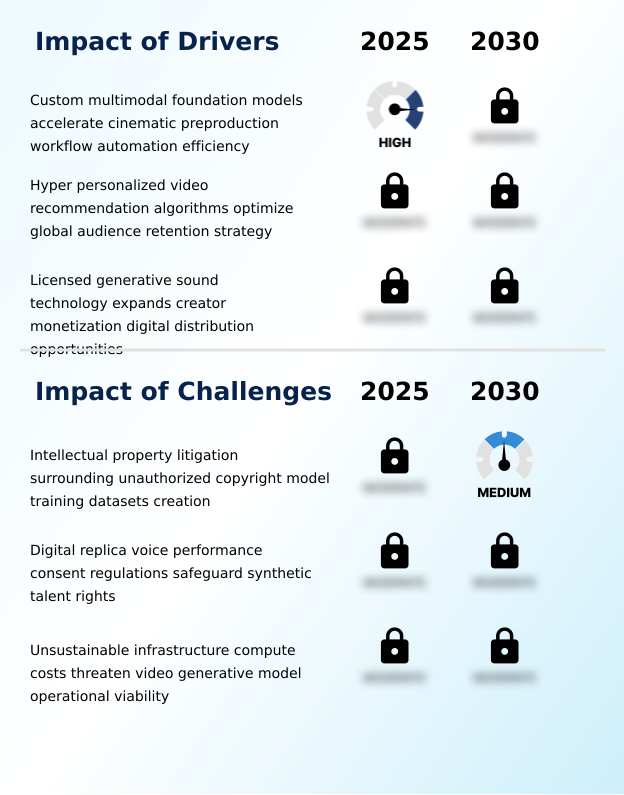
What are the key market drivers leading to the rise in the adoption of Ai In Media And Entertainment Industry Industry?

  • The adoption of custom multimodal foundation models acts as a primary market driver by accelerating cinematic preproduction workflows and significantly enhancing overall automation efficiency.

  • The pressing commercial need to minimize international distribution costs acts as a primary catalyst for the AI In Media And Entertainment Industry.
  • Traditional localization requires expensive human labor, prompting streaming platforms to rapidly deploy synthetic voice synthesis and cross channel performance tracking. Because generative neural networks accurately map regional dialects, networks utilize natural language processing pipelines to release content simultaneously worldwide.
  • This technological shift lowers global localization expenses by up to 45% compared to conventional dubbing processes. Furthermore, deploying intelligent broadcasting systems with automated video editing ensures flawless multi-regional delivery, driving a 20% increase in international subscriber acquisition.
  • As a result, media conglomerates achieve massive economies of scale, utilizing closed caption synthesis and automated live stream moderation to convert previously inaccessible markets into profitable digital revenue streams.

What are the market trends shaping the Ai In Media And Entertainment Industry Industry?

  • A prominent trend in the market is the strategic formation of commercial partnerships between legacy studios and technology developers. These alliances focus on training tailored foundation models exclusively on proprietary entertainment libraries to ensure intellectual property protection.

  • A defining structural shift in the AI In Media And Entertainment Industry is the enterprise integration of automated storyboard generation and procedural world generation within major game development studios. Because digital consumers demand vast interactive environments, developers face escalating budgets that render manual design unsustainable.
  • By adopting neural rendering techniques alongside real-time ray tracing, studios automatically construct complex 3D topographies, reducing initial environmental design costs by over 25% compared to traditional modeling. This automation enables creative teams to reallocate capital toward interactive narrative design and sophisticated behavioral data analysis. Consequently, publishing houses experience a 30% improvement in autonomous decision making during visual planning.
  • The utilization of high bandwidth memory chips ensures these massive models operate without latency, completely transforming how dynamic creative optimization is deployed.

What challenges does the Ai In Media And Entertainment Industry Industry face during its growth?

  • Intellectual property litigation stemming from the unauthorized creation of copyright model training datasets remains a critical challenge constraining industry expansion.

  • The rapid expansion of the AI In Media And Entertainment Industry is heavily constrained by unsustainable infrastructure compute costs and energy consumption overheads. Generating high-fidelity synthetic background replacement and executing facial recognition workflows require enormous processing power. Because high performance computing clusters consume vast amounts of electricity, production houses face operational expenditures that can outpace software revenues.
  • Rendering photorealistic environments utilizing tensor processing accelerators increases power consumption by nearly 50% compared to standard cloud computing infrastructure workloads. Furthermore, implementing mandatory deepfake identification pipelines and synthetic media authentication to ensure ethical content governance adds significant processing overhead.
  • Consequently, media executives are forced to limit the deployment of multimodal foundation models, acoustic modeling engines, and automated metadata tagging to specialized tier-one projects until more energy-efficient inference hardware becomes commercially available.

Exclusive Technavio Analysis on Customer Landscape

The ai in media and entertainment industry market forecasting report includes the adoption lifecycle of the market, covering from the innovator’s stage to the laggard’s stage. It focuses on adoption rates in different regions based on penetration. Furthermore, the ai in media and entertainment industry market report also includes key purchase criteria and drivers of price sensitivity to help companies evaluate and develop their market growth analysis strategies.
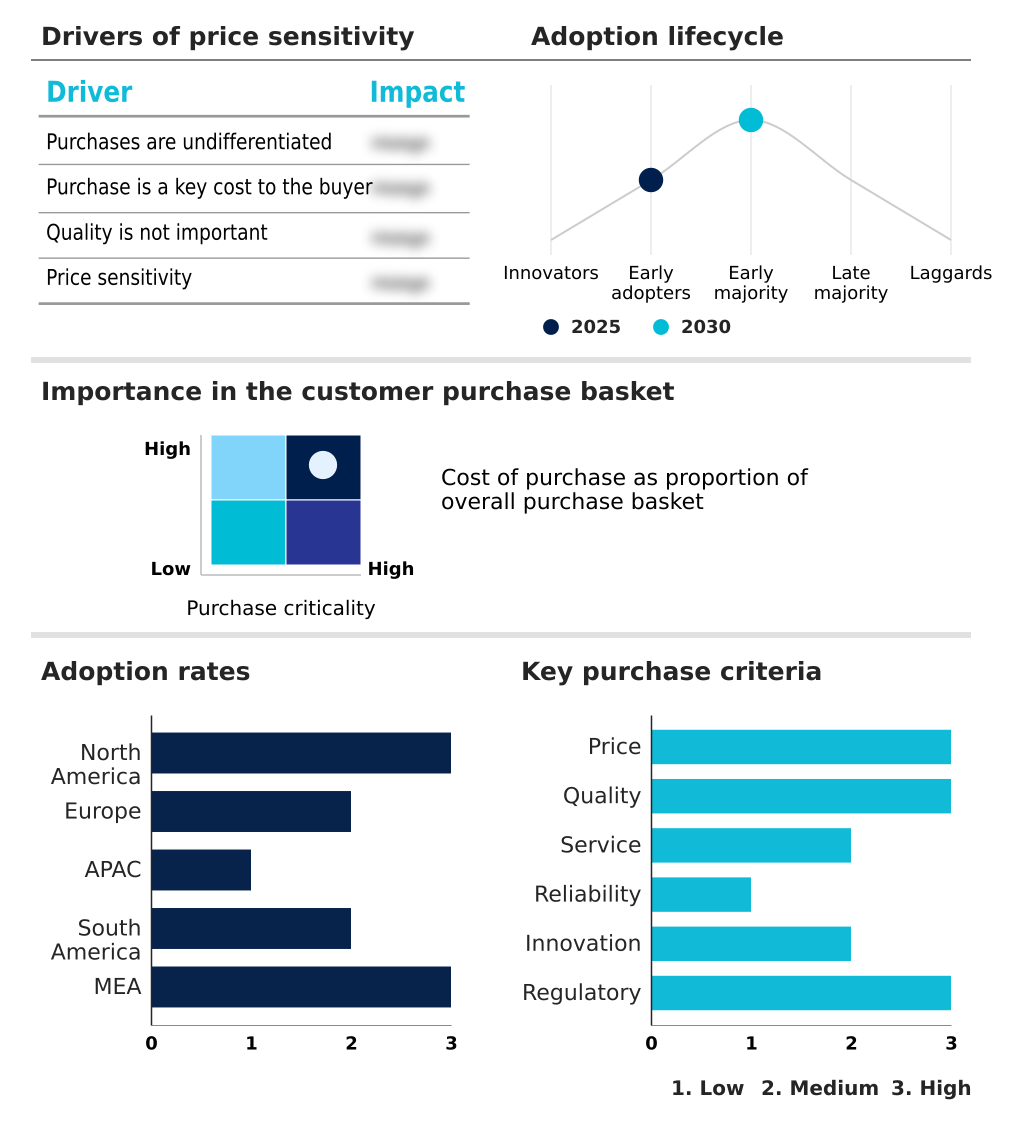
Customer Landscape of Ai In Media And Entertainment Industry Industry

Competitive Landscape

Companies are implementing various strategies, such as strategic alliances, ai in media and entertainment industry market forecast, partnerships, mergers and acquisitions, geographical expansion, and product/service launches, to enhance their presence in the industry.

Accenture Plc - The platform delivers comprehensive generative content creation, automated media operations transformation, and intelligent customer engagement services, significantly enhancing advertising optimization and operational workflows for enterprise broadcasting clients.

The industry research and growth report includes detailed analyses of the competitive landscape of the market and information about key companies, including:

  • Accenture Plc
  • Adobe Inc.
  • Amazon Web Services Inc.
  • Autodesk Inc.
  • Automation Anywhere Inc.
  • Canva Pty Ltd.
  • Deepbrain AI
  • Descript
  • Eleven Labs Inc.
  • Globant SA
  • Google LLC
  • HCL Technologies Ltd.
  • Imagine Communications Corp.
  • Kaltura Inc.
  • Microsoft Corp.
  • NVIDIA Corp.
  • Runway AI Inc.
  • Unity Technologies Inc.
  • Veritone Inc.
  • Wipro Ltd.

Qualitative and quantitative analysis of companies has been conducted to help clients understand the wider business environment as well as the strengths and weaknesses of key industry players. Data is qualitatively analyzed to categorize companies as pure play, category-focused, industry-focused, and diversified; it is quantitatively analyzed to categorize companies as dominant, leading, strong, tentative, and weak.

Recent Development and News in Ai in media and entertainment industry market

  • In the Application Software industry, the widespread adoption of cloud-based enterprise automation frameworks has enhanced cross-platform data integration, directly impacting AI In Media And Entertainment Industry demand by enabling a 35% improvement in multi-site digital asset management efficiency.
  • The implementation of stringent data privacy regulations like the European Union General Data Protection Regulation has mandated ethical content governance compliance, causing developers to embed synthetic media authentication protocols that reduce unauthorized dataset utilization liabilities by up to 40%.
  • Innovations in workflow interoperability tools have accelerated the deployment of high performance computing clusters, driving a 25% reduction in rendering latency for autonomous preproduction visual effects rendering across major broadcasting networks.
  • The transition toward continuous algorithmic refinement within unified collaboration suites has improved decentralized post-production communication, allowing studios to cut project revision cycles by 20% and significantly boosting demand for integrated natural language processing pipelines.

Dive into Technavio’s robust research methodology, blending expert interviews, extensive data synthesis, and validated models for unparalleled Ai In Media And Entertainment Industry Market insights. See full methodology.

Market Scope
Page number 309
Base year 2025
Historic period 2020-2024
Forecast period 2026-2030
Growth momentum & CAGR Accelerate at a CAGR of 26.6%
Market growth 2026-2030 USD 48913.6 million
Market structure Fragmented
YoY growth 2025-2026(%) 25.9%
Key countries US, Canada, Mexico, UK, Germany, France, Italy, Spain, The Netherlands, China, Japan, India, South Korea, Australia, Singapore, Brazil, Argentina, Chile, UAE, Saudi Arabia, South Africa, Israel and Qatar
Competitive landscape Leading Companies, Market Positioning of Companies, Competitive Strategies, and Industry Risks

Request Free Sample

Research Analyst Overview

  • The AI In Media And Entertainment Industry fundamentally reshapes enterprise production economics and intellectual property strategy. Boardrooms increasingly prioritize the integration of deepfake identification pipelines and robust digital rights management to ensure strict regulatory compliance and safeguard proprietary brand assets against unauthorized synthetic replication.
  • This strategic emphasis on ethical content governance forces media conglomerates to heavily vet third-party generative neural networks before commercial deployment. Transitioning to automated metadata tagging and facial recognition workflows enables asset managers to index massive historical archives instantly, improving content retrieval speeds by 40% over manual cataloging systems. Consequently, digital publishers can rapidly monetize legacy media through programmatic ad delivery.
  • The adoption of acoustic modeling engines directly impacts international product strategy, empowering studios to localize episodic television simultaneously across multiple languages. By deploying these highly specialized algorithmic frameworks, global broadcasters eliminate traditional production bottlenecks, enhance predictive audience analytics, and drastically reduce the operational overhead associated with conventional localized voiceover recording and subtitle generation.

What are the Key Data Covered in this Ai In Media And Entertainment Industry Market Research and Growth Report?

  • What is the expected growth of the Ai In Media And Entertainment Industry Market between 2026 and 2030?

    • USD 48.91 billion, at a CAGR of 26.6%

  • What segmentation does the market report cover?

    • The report is segmented by Technology (Machine learning, Computer vision, and Speech recognition), End-user (Media companies, Gaming industry, Advertising agencies, and Film production houses), Solution (Software, Services, and Hardware) and Geography (North America, Europe, APAC, South America, Middle East and Africa)

  • Which regions are analyzed in the report?

    • North America, Europe, APAC, South America and Middle East and Africa

  • What are the key growth drivers and market challenges?

    • Custom multimodal foundation models accelerate cinematic preproduction workflow automation efficiency, Intellectual property litigation surrounding unauthorized copyright model training datasets creation

  • Who are the major players in the Ai In Media And Entertainment Industry Market?

    • Accenture Plc, Adobe Inc., Amazon Web Services Inc., Autodesk Inc., Automation Anywhere Inc., Canva Pty Ltd., Deepbrain AI, Descript, Eleven Labs Inc., Globant SA, Google LLC, HCL Technologies Ltd., Imagine Communications Corp., Kaltura Inc., Microsoft Corp., NVIDIA Corp., Runway AI Inc., Unity Technologies Inc., Veritone Inc. and Wipro Ltd.

Market Research Insights

  • The AI In Media And Entertainment Industry represents a structural transformation in digital asset management and interactive media production. By integrating cloud computing infrastructure, enterprise broadcasters streamline global content distribution and eliminate localized data silos. This transition enables a 35% reduction in external server maintenance costs, dramatically optimizing corporate IT budgets.
  • Furthermore, leveraging dynamic creative optimization allows digital marketing agencies to boost click-through rates by up to 22% compared to static display campaigns. The deployment of tensor processing accelerators provides the essential computational power required for real-time video rendering, cutting processing latency in half and directly accelerating time-to-market for high-value episodic entertainment franchises.

We can help! Our analysts can customize this ai in media and entertainment industry market research report to meet your requirements.

Get in touch

1. Executive Summary

1.1 Market overview

Executive Summary - Chart on Market Overview
Executive Summary - Data Table on Market Overview
Executive Summary - Chart on Global Market Characteristics
Executive Summary - Chart on Market by Geography
Executive Summary - Chart on Market Segmentation by Technology
Executive Summary - Chart on Market Segmentation by End-user
Executive Summary - Chart on Market Segmentation by Solution
Executive Summary - Chart on Incremental Growth
Executive Summary - Data Table on Incremental Growth
Executive Summary - Chart on Company Market Positioning

2. Technavio Analysis

2.1 Analysis of price sensitivity, lifecycle, customer purchase basket, adoption rates, and purchase criteria

2.2 Criticality of inputs and Factors of differentiation

Chart on Overview on criticality of inputs and factors of differentiation

2.3 Factors of disruption

Chart on Overview on factors of disruption

2.4 Impact of drivers and challenges

Chart on Impact of drivers and challenges in 2025 and 2030

3. Market Landscape

3.1 Market ecosystem

Chart on Parent Market
Data Table on - Parent Market

3.2 Market characteristics

Chart on Market characteristics analysis

3.3 Value chain analysis

Chart on Value chain analysis

4. Market Sizing

4.1 Market definition

Data Table on Offerings of companies included in the market definition

4.2 Market segment analysis

Market segments

4.3 Market size 2025

4.4 Market outlook: Forecast for 2025-2030

Chart on Global - Market size and forecast 2025-2030 ($ million)
Data Table on Global - Market size and forecast 2025-2030 ($ million)
Chart on Global Market: Year-over-year growth 2025-2030 (%)
Data Table on Global Market: Year-over-year growth 2025-2030 (%)

5. Historic Market Size

5.1 Global AI Market In Media And Entertainment Industry 2020 - 2024

Historic Market Size - Data Table on Global AI Market In Media And Entertainment Industry 2020 - 2024 ($ million)

5.2 Technology segment analysis 2020 - 2024

Historic Market Size - Technology Segment 2020 - 2024 ($ million)

5.3 End-user segment analysis 2020 - 2024

Historic Market Size - End-user Segment 2020 - 2024 ($ million)

5.4 Solution segment analysis 2020 - 2024

Historic Market Size - Solution Segment 2020 - 2024 ($ million)

5.5 Geography segment analysis 2020 - 2024

Historic Market Size - Geography Segment 2020 - 2024 ($ million)

5.6 Country segment analysis 2020 - 2024

Historic Market Size - Country Segment 2020 - 2024 ($ million)

6. Qualitative Analysis

6.1 Impact of AI on global AI market in media and entertainment industry

6.2 Impact of geopolitical conflicts on global AI market in media and entertainment industry

7. Five Forces Analysis

7.1 Five forces summary

Five forces analysis - Comparison between 2025 and 2030

7.2 Bargaining power of buyers

Bargaining power of buyers - Impact of key factors 2025 and 2030

7.3 Bargaining power of suppliers

Bargaining power of suppliers - Impact of key factors in 2025 and 2030

7.4 Threat of new entrants

Threat of new entrants - Impact of key factors in 2025 and 2030

7.5 Threat of substitutes

Threat of substitutes - Impact of key factors in 2025 and 2030

7.6 Threat of rivalry

Threat of rivalry - Impact of key factors in 2025 and 2030

7.7 Market condition

Chart on Market condition - Five forces 2025 and 2030

8. Market Segmentation by Technology

8.1 Market segments

Chart on Technology - Market share 2025-2030 (%)
Data Table on Technology - Market share 2025-2030 (%)

8.2 Comparison by Technology

Chart on Comparison by Technology
Data Table on Comparison by Technology

8.3 Machine learning - Market size and forecast 2025-2030

Chart on Machine learning - Market size and forecast 2025-2030 ($ million)
Data Table on Machine learning - Market size and forecast 2025-2030 ($ million)
Chart on Machine learning - Year-over-year growth 2025-2030 (%)
Data Table on Machine learning - Year-over-year growth 2025-2030 (%)

8.4 Computer vision - Market size and forecast 2025-2030

Chart on Computer vision - Market size and forecast 2025-2030 ($ million)
Data Table on Computer vision - Market size and forecast 2025-2030 ($ million)
Chart on Computer vision - Year-over-year growth 2025-2030 (%)
Data Table on Computer vision - Year-over-year growth 2025-2030 (%)

8.5 Speech recognition - Market size and forecast 2025-2030

Chart on Speech recognition - Market size and forecast 2025-2030 ($ million)
Data Table on Speech recognition - Market size and forecast 2025-2030 ($ million)
Chart on Speech recognition - Year-over-year growth 2025-2030 (%)
Data Table on Speech recognition - Year-over-year growth 2025-2030 (%)

8.6 Market opportunity by Technology

Market opportunity by Technology ($ million)
Data Table on Market opportunity by Technology ($ million)

9. Market Segmentation by End-user

9.1 Market segments

Chart on End-user - Market share 2025-2030 (%)
Data Table on End-user - Market share 2025-2030 (%)

9.2 Comparison by End-user

Chart on Comparison by End-user
Data Table on Comparison by End-user

9.3 Media companies - Market size and forecast 2025-2030

Chart on Media companies - Market size and forecast 2025-2030 ($ million)
Data Table on Media companies - Market size and forecast 2025-2030 ($ million)
Chart on Media companies - Year-over-year growth 2025-2030 (%)
Data Table on Media companies - Year-over-year growth 2025-2030 (%)

9.4 Gaming industry - Market size and forecast 2025-2030

Chart on Gaming industry - Market size and forecast 2025-2030 ($ million)
Data Table on Gaming industry - Market size and forecast 2025-2030 ($ million)
Chart on Gaming industry - Year-over-year growth 2025-2030 (%)
Data Table on Gaming industry - Year-over-year growth 2025-2030 (%)

9.5 Advertising agencies - Market size and forecast 2025-2030

Chart on Advertising agencies - Market size and forecast 2025-2030 ($ million)
Data Table on Advertising agencies - Market size and forecast 2025-2030 ($ million)
Chart on Advertising agencies - Year-over-year growth 2025-2030 (%)
Data Table on Advertising agencies - Year-over-year growth 2025-2030 (%)

9.6 Film production houses - Market size and forecast 2025-2030

Chart on Film production houses - Market size and forecast 2025-2030 ($ million)
Data Table on Film production houses - Market size and forecast 2025-2030 ($ million)
Chart on Film production houses - Year-over-year growth 2025-2030 (%)
Data Table on Film production houses - Year-over-year growth 2025-2030 (%)

9.7 Market opportunity by End-user

Market opportunity by End-user ($ million)
Data Table on Market opportunity by End-user ($ million)

10. Market Segmentation by Solution

10.1 Market segments

Chart on Solution - Market share 2025-2030 (%)
Data Table on Solution - Market share 2025-2030 (%)

10.2 Comparison by Solution

Chart on Comparison by Solution
Data Table on Comparison by Solution

10.3 Software - Market size and forecast 2025-2030

Chart on Software - Market size and forecast 2025-2030 ($ million)
Data Table on Software - Market size and forecast 2025-2030 ($ million)
Chart on Software - Year-over-year growth 2025-2030 (%)
Data Table on Software - Year-over-year growth 2025-2030 (%)

10.4 Services - Market size and forecast 2025-2030

Chart on Services - Market size and forecast 2025-2030 ($ million)
Data Table on Services - Market size and forecast 2025-2030 ($ million)
Chart on Services - Year-over-year growth 2025-2030 (%)
Data Table on Services - Year-over-year growth 2025-2030 (%)

10.5 Hardware - Market size and forecast 2025-2030

Chart on Hardware - Market size and forecast 2025-2030 ($ million)
Data Table on Hardware - Market size and forecast 2025-2030 ($ million)
Chart on Hardware - Year-over-year growth 2025-2030 (%)
Data Table on Hardware - Year-over-year growth 2025-2030 (%)

10.6 Market opportunity by Solution

Market opportunity by Solution ($ million)
Data Table on Market opportunity by Solution ($ million)

11. Customer Landscape

11.1 Customer landscape overview

Analysis of price sensitivity, lifecycle, customer purchase basket, adoption rates, and purchase criteria

12. Geographic Landscape

12.1 Geographic segmentation

Chart on Market share by geography 2025-2030 (%)
Data Table on Market share by geography 2025-2030 (%)

12.2 Geographic comparison

Chart on Geographic comparison
Data Table on Geographic comparison

12.3 North America - Market size and forecast 2025-2030

Chart on North America - Market size and forecast 2025-2030 ($ million)
Data Table on North America - Market size and forecast 2025-2030 ($ million)
Chart on North America - Year-over-year growth 2025-2030 (%)
Data Table on North America - Year-over-year growth 2025-2030 (%)
Chart on Regional Comparison - North America
Data Table on Regional Comparison - North America

12.3.1 US - Market size and forecast 2025-2030

Chart on US - Market size and forecast 2025-2030 ($ million)
Data Table on US - Market size and forecast 2025-2030 ($ million)
Chart on US - Year-over-year growth 2025-2030 (%)
Data Table on US - Year-over-year growth 2025-2030 (%)

12.3.2 Canada - Market size and forecast 2025-2030

Chart on Canada - Market size and forecast 2025-2030 ($ million)
Data Table on Canada - Market size and forecast 2025-2030 ($ million)
Chart on Canada - Year-over-year growth 2025-2030 (%)
Data Table on Canada - Year-over-year growth 2025-2030 (%)

12.3.3 Mexico - Market size and forecast 2025-2030

Chart on Mexico - Market size and forecast 2025-2030 ($ million)
Data Table on Mexico - Market size and forecast 2025-2030 ($ million)
Chart on Mexico - Year-over-year growth 2025-2030 (%)
Data Table on Mexico - Year-over-year growth 2025-2030 (%)

12.4 Europe - Market size and forecast 2025-2030

Chart on Europe - Market size and forecast 2025-2030 ($ million)
Data Table on Europe - Market size and forecast 2025-2030 ($ million)
Chart on Europe - Year-over-year growth 2025-2030 (%)
Data Table on Europe - Year-over-year growth 2025-2030 (%)
Chart on Regional Comparison - Europe
Data Table on Regional Comparison - Europe

12.4.1 UK - Market size and forecast 2025-2030

Chart on UK - Market size and forecast 2025-2030 ($ million)
Data Table on UK - Market size and forecast 2025-2030 ($ million)
Chart on UK - Year-over-year growth 2025-2030 (%)
Data Table on UK - Year-over-year growth 2025-2030 (%)

12.4.2 Germany - Market size and forecast 2025-2030

Chart on Germany - Market size and forecast 2025-2030 ($ million)
Data Table on Germany - Market size and forecast 2025-2030 ($ million)
Chart on Germany - Year-over-year growth 2025-2030 (%)
Data Table on Germany - Year-over-year growth 2025-2030 (%)

12.4.3 France - Market size and forecast 2025-2030

Chart on France - Market size and forecast 2025-2030 ($ million)
Data Table on France - Market size and forecast 2025-2030 ($ million)
Chart on France - Year-over-year growth 2025-2030 (%)
Data Table on France - Year-over-year growth 2025-2030 (%)

12.4.4 Italy - Market size and forecast 2025-2030

Chart on Italy - Market size and forecast 2025-2030 ($ million)
Data Table on Italy - Market size and forecast 2025-2030 ($ million)
Chart on Italy - Year-over-year growth 2025-2030 (%)
Data Table on Italy - Year-over-year growth 2025-2030 (%)

12.4.5 Spain - Market size and forecast 2025-2030

Chart on Spain - Market size and forecast 2025-2030 ($ million)
Data Table on Spain - Market size and forecast 2025-2030 ($ million)
Chart on Spain - Year-over-year growth 2025-2030 (%)
Data Table on Spain - Year-over-year growth 2025-2030 (%)

12.4.6 The Netherlands - Market size and forecast 2025-2030

Chart on The Netherlands - Market size and forecast 2025-2030 ($ million)
Data Table on The Netherlands - Market size and forecast 2025-2030 ($ million)
Chart on The Netherlands - Year-over-year growth 2025-2030 (%)
Data Table on The Netherlands - Year-over-year growth 2025-2030 (%)

12.5 APAC - Market size and forecast 2025-2030

Chart on APAC - Market size and forecast 2025-2030 ($ million)
Data Table on APAC - Market size and forecast 2025-2030 ($ million)
Chart on APAC - Year-over-year growth 2025-2030 (%)
Data Table on APAC - Year-over-year growth 2025-2030 (%)
Chart on Regional Comparison - APAC
Data Table on Regional Comparison - APAC

12.5.1 China - Market size and forecast 2025-2030

Chart on China - Market size and forecast 2025-2030 ($ million)
Data Table on China - Market size and forecast 2025-2030 ($ million)
Chart on China - Year-over-year growth 2025-2030 (%)
Data Table on China - Year-over-year growth 2025-2030 (%)

12.5.2 Japan - Market size and forecast 2025-2030

Chart on Japan - Market size and forecast 2025-2030 ($ million)
Data Table on Japan - Market size and forecast 2025-2030 ($ million)
Chart on Japan - Year-over-year growth 2025-2030 (%)
Data Table on Japan - Year-over-year growth 2025-2030 (%)

12.5.3 India - Market size and forecast 2025-2030

Chart on India - Market size and forecast 2025-2030 ($ million)
Data Table on India - Market size and forecast 2025-2030 ($ million)
Chart on India - Year-over-year growth 2025-2030 (%)
Data Table on India - Year-over-year growth 2025-2030 (%)

12.5.4 South Korea - Market size and forecast 2025-2030

Chart on South Korea - Market size and forecast 2025-2030 ($ million)
Data Table on South Korea - Market size and forecast 2025-2030 ($ million)
Chart on South Korea - Year-over-year growth 2025-2030 (%)
Data Table on South Korea - Year-over-year growth 2025-2030 (%)

12.5.5 Australia - Market size and forecast 2025-2030

Chart on Australia - Market size and forecast 2025-2030 ($ million)
Data Table on Australia - Market size and forecast 2025-2030 ($ million)
Chart on Australia - Year-over-year growth 2025-2030 (%)
Data Table on Australia - Year-over-year growth 2025-2030 (%)

12.5.6 Singapore - Market size and forecast 2025-2030

Chart on Singapore - Market size and forecast 2025-2030 ($ million)
Data Table on Singapore - Market size and forecast 2025-2030 ($ million)
Chart on Singapore - Year-over-year growth 2025-2030 (%)
Data Table on Singapore - Year-over-year growth 2025-2030 (%)

12.6 South America - Market size and forecast 2025-2030

Chart on South America - Market size and forecast 2025-2030 ($ million)
Data Table on South America - Market size and forecast 2025-2030 ($ million)
Chart on South America - Year-over-year growth 2025-2030 (%)
Data Table on South America - Year-over-year growth 2025-2030 (%)
Chart on Regional Comparison - South America
Data Table on Regional Comparison - South America

12.6.1 Brazil - Market size and forecast 2025-2030

Chart on Brazil - Market size and forecast 2025-2030 ($ million)
Data Table on Brazil - Market size and forecast 2025-2030 ($ million)
Chart on Brazil - Year-over-year growth 2025-2030 (%)
Data Table on Brazil - Year-over-year growth 2025-2030 (%)

12.6.2 Argentina - Market size and forecast 2025-2030

Chart on Argentina - Market size and forecast 2025-2030 ($ million)
Data Table on Argentina - Market size and forecast 2025-2030 ($ million)
Chart on Argentina - Year-over-year growth 2025-2030 (%)
Data Table on Argentina - Year-over-year growth 2025-2030 (%)

12.6.3 Chile - Market size and forecast 2025-2030

Chart on Chile - Market size and forecast 2025-2030 ($ million)
Data Table on Chile - Market size and forecast 2025-2030 ($ million)
Chart on Chile - Year-over-year growth 2025-2030 (%)
Data Table on Chile - Year-over-year growth 2025-2030 (%)

12.7 Middle East and Africa - Market size and forecast 2025-2030

Chart on Middle East and Africa - Market size and forecast 2025-2030 ($ million)
Data Table on Middle East and Africa - Market size and forecast 2025-2030 ($ million)
Chart on Middle East and Africa - Year-over-year growth 2025-2030 (%)
Data Table on Middle East and Africa - Year-over-year growth 2025-2030 (%)
Chart on Regional Comparison - Middle East and Africa
Data Table on Regional Comparison - Middle East and Africa

12.7.1 UAE - Market size and forecast 2025-2030

Chart on UAE - Market size and forecast 2025-2030 ($ million)
Data Table on UAE - Market size and forecast 2025-2030 ($ million)
Chart on UAE - Year-over-year growth 2025-2030 (%)
Data Table on UAE - Year-over-year growth 2025-2030 (%)

12.7.2 Saudi Arabia - Market size and forecast 2025-2030

Chart on Saudi Arabia - Market size and forecast 2025-2030 ($ million)
Data Table on Saudi Arabia - Market size and forecast 2025-2030 ($ million)
Chart on Saudi Arabia - Year-over-year growth 2025-2030 (%)
Data Table on Saudi Arabia - Year-over-year growth 2025-2030 (%)

12.7.3 South Africa - Market size and forecast 2025-2030

Chart on South Africa - Market size and forecast 2025-2030 ($ million)
Data Table on South Africa - Market size and forecast 2025-2030 ($ million)
Chart on South Africa - Year-over-year growth 2025-2030 (%)
Data Table on South Africa - Year-over-year growth 2025-2030 (%)

12.7.4 Israel - Market size and forecast 2025-2030

Chart on Israel - Market size and forecast 2025-2030 ($ million)
Data Table on Israel - Market size and forecast 2025-2030 ($ million)
Chart on Israel - Year-over-year growth 2025-2030 (%)
Data Table on Israel - Year-over-year growth 2025-2030 (%)

12.7.5 Qatar - Market size and forecast 2025-2030

Chart on Qatar - Market size and forecast 2025-2030 ($ million)
Data Table on Qatar - Market size and forecast 2025-2030 ($ million)
Chart on Qatar - Year-over-year growth 2025-2030 (%)
Data Table on Qatar - Year-over-year growth 2025-2030 (%)

12.8 Market opportunity by geography

Market opportunity by geography ($ million)
Data Tables on Market opportunity by geography ($ million)

13. Drivers, Challenges, and Opportunity

13.1 Market drivers

Custom multimodal foundation models accelerate cinematic preproduction workflow automation efficiency
Hyper personalized video recommendation algorithms optimize global audience retention strategy
Licensed generative sound technology expands creator monetization digital distribution opportunities

13.2 Market challenges

Intellectual property litigation surrounding unauthorized copyright model training datasets creation
Digital replica voice performance consent regulations safeguard synthetic talent rights
Unsustainable infrastructure compute costs threaten video generative model operational viability

13.3 Impact of drivers and challenges

Impact of drivers and challenges in 2025 and 2030

13.4 Market opportunities

Commercial studio partnerships train tailored foundation models proprietary entertainment libraries
Short form episodic storytelling platforms integrate generative visual fx production
Enterprise creative software suites offer indemnified commercial safety guarantees

14. Competitive Landscape

14.1 Overview

14.2

Overview on criticality of inputs and factors of differentiation

14.3 Landscape disruption

Overview on factors of disruption

14.4 Industry risks

Impact of key risks on business

15. Competitive Analysis

15.1 Companies profiled

Companies covered

15.2 Company ranking index

15.3 Market positioning of companies

Matrix on companies position and classification

15.4 Accenture Plc

Accenture Plc - Overview
Accenture Plc - Business segments
Accenture Plc - Key news
Accenture Plc - Key offerings
Accenture Plc - Segment focus
SWOT

15.5 Adobe Inc.

Adobe Inc. - Overview
Adobe Inc. - Business segments
Adobe Inc. - Key news
Adobe Inc. - Key offerings
Adobe Inc. - Segment focus
SWOT

15.6 Amazon Web Services Inc.

Amazon Web Services Inc. - Overview
Amazon Web Services Inc. - Product / Service
Amazon Web Services Inc. - Key offerings
SWOT

15.7 Autodesk Inc.

Autodesk Inc. - Overview
Autodesk Inc. - Business segments
Autodesk Inc. - Key offerings
Autodesk Inc. - Segment focus
SWOT

15.8 Automation Anywhere Inc.

Automation Anywhere Inc. - Overview
Automation Anywhere Inc. - Product / Service
Automation Anywhere Inc. - Key offerings
SWOT

15.9 Canva Pty Ltd.

Canva Pty Ltd. - Overview
Canva Pty Ltd. - Product / Service
Canva Pty Ltd. - Key offerings
SWOT

15.10 Globant SA

Globant SA - Overview
Globant SA - Product / Service
Globant SA - Key offerings
SWOT

15.11 Google LLC

Google LLC - Overview
Google LLC - Product / Service
Google LLC - Key news
Google LLC - Key offerings
SWOT

15.12 HCL Technologies Ltd.

HCL Technologies Ltd. - Overview
HCL Technologies Ltd. - Business segments
HCL Technologies Ltd. - Key news
HCL Technologies Ltd. - Key offerings
HCL Technologies Ltd. - Segment focus
SWOT

15.13 Imagine Communications Corp.

Imagine Communications Corp. - Overview
Imagine Communications Corp. - Product / Service
Imagine Communications Corp. - Key offerings
SWOT

15.14 Microsoft Corp.

Microsoft Corp. - Overview
Microsoft Corp. - Business segments
Microsoft Corp. - Key news
Microsoft Corp. - Key offerings
Microsoft Corp. - Segment focus
SWOT

15.15 NVIDIA Corp.

NVIDIA Corp. - Overview
NVIDIA Corp. - Business segments
NVIDIA Corp. - Key news
NVIDIA Corp. - Key offerings
NVIDIA Corp. - Segment focus
SWOT

15.16 Unity Technologies Inc.

Unity Technologies Inc. - Overview
Unity Technologies Inc. - Business segments
Unity Technologies Inc. - Key offerings
Unity Technologies Inc. - Segment focus
SWOT

15.17 Veritone Inc.

Veritone Inc. - Overview
Veritone Inc. - Product / Service
Veritone Inc. - Key offerings
SWOT

15.18 Wipro Ltd.

Wipro Ltd. - Overview
Wipro Ltd. - Business segments
Wipro Ltd. - Key news
Wipro Ltd. - Key offerings
Wipro Ltd. - Segment focus
SWOT

16. Appendix

16.1 Scope of the report

Market definition
Objectives
Notes and caveats

16.2 Inclusions and exclusions checklist

Inclusions checklist
Exclusions checklist

16.3 Currency conversion rates for US$

16.4 Research methodology

16.5 Data procurement

Information sources

16.6 Data validation

16.7 Validation techniques employed for market sizing

16.8 Data synthesis

16.9 360 degree market analysis

16.10 List of abbreviations

Research Methodology

Technavio presents a detailed picture of the market by way of study, synthesis, and summation of data from multiple sources. The analysts have presented the various facets of the market with a particular focus on identifying the key industry influencers. The data thus presented is comprehensive, reliable, and the result of extensive research, both primary and secondary.

INFORMATION SOURCES

Primary sources

  • Manufacturers and suppliers
  • Channel partners
  • Industry experts
  • Strategic decision makers

Secondary sources

  • Industry journals and periodicals
  • Government data
  • Financial reports of key industry players
  • Historical data
  • Press releases

DATA ANALYSIS

Data Synthesis

  • Collation of data
  • Estimation of key figures
  • Analysis of derived insights

Data Validation

  • Triangulation with data models
  • Reference against proprietary databases
  • Corroboration with industry experts

REPORT WRITING

Qualitative

  • Market drivers
  • Market challenges
  • Market trends
  • Five forces analysis

Quantitative

  • Market size and forecast
  • Market segmentation
  • Geographical insights
  • Competitive landscape

Interested in this report?

Get your sample now to see our research methodology and insights!

Download Now

Frequently Asked Questions

Ai In Media And Entertainment Industry market growth will increase by USD 48913.6 million during 2026-2030.

The Ai In Media And Entertainment Industry market is expected to grow at a CAGR of 26.6% during 2026-2030.

Ai In Media And Entertainment Industry market is segmented by Technology (Machine learning, Computer vision, Speech recognition) End-user (Media companies, Gaming industry, Advertising agencies, Film production houses) Solution (Software, Services, Hardware)

Accenture Plc, Adobe Inc., Amazon Web Services Inc., Autodesk Inc., Automation Anywhere Inc., Canva Pty Ltd., Deepbrain AI, Descript, Eleven Labs Inc., Globant SA, Google LLC, HCL Technologies Ltd., Imagine Communications Corp., Kaltura Inc., Microsoft Corp., NVIDIA Corp., Runway AI Inc., Unity Technologies Inc., Veritone Inc., Wipro Ltd. are a few of the key vendors in the Ai In Media And Entertainment Industry market.

North America will register the highest growth rate of 36.9% among the other regions. Therefore, the Ai In Media And Entertainment Industry market in North America is expected to garner significant business opportunities for the vendors during the forecast period.

US, Canada, Mexico, UK, Germany, France, Italy, Spain, The Netherlands, China, Japan, India, South Korea, Australia, Singapore, Brazil, Argentina, Chile, UAE, Saudi Arabia, South Africa, Israel, Qatar

  • Custom multimodal foundation models accelerate cinematic preproduction workflow automation efficiency is the driving factor this market.

The Ai In Media And Entertainment Industry market vendors should focus on grabbing business opportunities from the Technology segment as it accounted for the largest market share in the base year.
RIA - Research AI Assistant
Ask RIA
