
Server Market Size 2026-2030
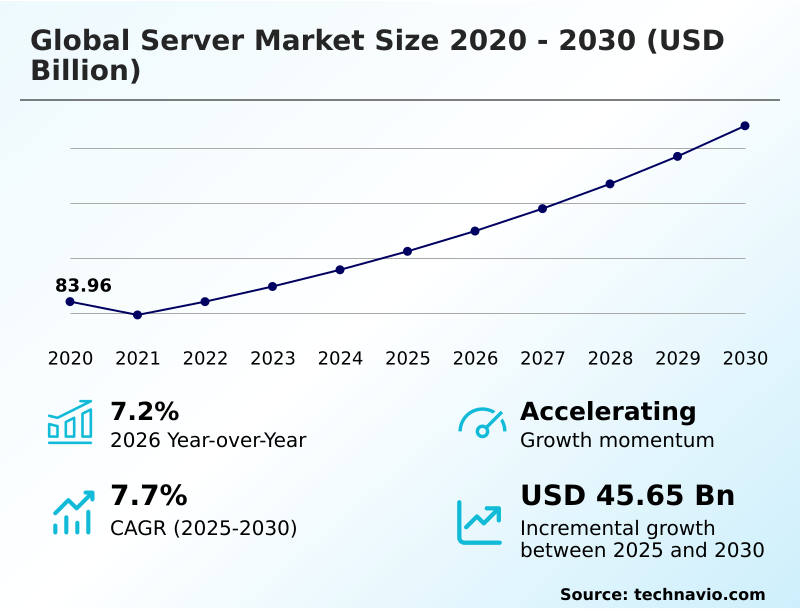
The server market size is valued to increase by USD 45.65 billion, at a CAGR of 7.7% from 2025 to 2030. Rising of generative AI and high-density accelerated computing will drive the server market.
Major Market Trends & Insights
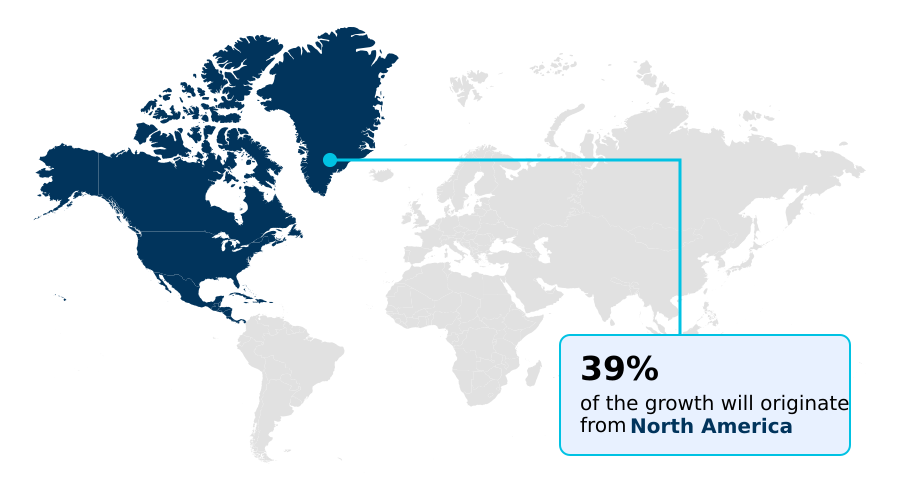
- North America dominated the market and accounted for a 38.8% growth during the forecast period.
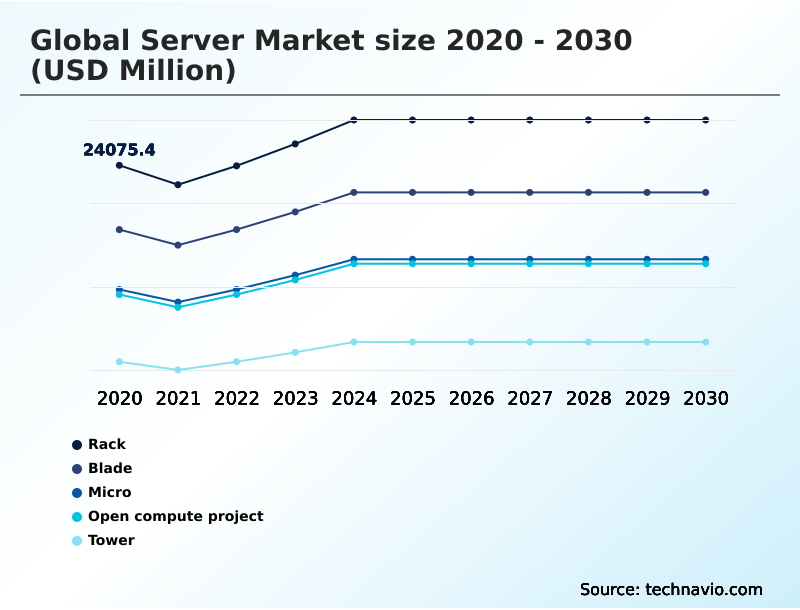
- By Product - Rack segment was valued at USD 27.29 billion in 2024
- By End-user - IT and telecom segment accounted for the largest market revenue share in 2024
Market Size & Forecast
- Market Opportunities: USD 63.92 billion
- Market Future Opportunities: USD 45.65 billion
- CAGR from 2025 to 2030 : 7.7%
Market Summary
- The server market is undergoing a significant transformation, moving beyond general-purpose hardware to a specialized infrastructure defined by accelerated computing and intensive artificial intelligence workloads. This evolution is driven by the expansion of hyperscale data centers and the integration of generative AI, which requires servers with high-performance graphics processing units and specialized accelerators.
- This technological shift is coupled with advancements in power management and thermal engineering, as the rising energy needs of high-density racks make direct-to-chip liquid cooling and other advanced solutions essential.
- For instance, a large cloud provider designing a new facility for AI training must prioritize a rack scale architecture with integrated liquid cooling to manage a high thermal design power, ensuring optimal performance without system throttling. Concurrently, the industry is navigating toward sovereign cloud mandates, which compel investment in domestic server capacities.
- The competitive landscape is also being reshaped by custom silicon and application-specific integrated circuits, further optimizing workload efficiency. This maturation of the hardware stack, including blade server chassis and composable infrastructure, solidifies the market's role as the critical backbone of the global digital economy, enabling the transition to agentic computing and autonomous industrial processes.
What will be the Size of the Server Market during the forecast period?
Get Key Insights on Market Forecast (PDF) Get Free Sample
How is the Server Market Segmented?
The server industry research report provides comprehensive data (region-wise segment analysis), with forecasts and estimates in "USD million" for the period 2026-2030, as well as historical data from 2020-2024 for the following segments.
- Product
- Rack
- Blade
- Micro
- Open compute project
- Tower
- End-user
- IT and telecom
- BFSI
- Government and defense
- Healthcare
- Others
- Channel
- Direct
- Reseller
- Geography
- North America
- US
- Canada
- Mexico
- Europe
- Germany
- UK
- France
- APAC
- China
- Japan
- India
- South America
- Brazil
- Argentina
- Middle East and Africa
- South Africa
- Saudi Arabia
- UAE
- Rest of World (ROW)
- North America
By Product Insights
The rack segment is estimated to witness significant growth during the forecast period.
The rack segment is the primary architecture for enterprise data centers, providing the foundational density for digital workloads.
This market growth is influenced by the deployment of high-performance computing clusters and AI infrastructures, demanding increased thermal efficiency at the rack level.
Consequently, there is a notable shift toward liquid-cooled rack solutions as air-cooling reaches its physical limitations for high-density GPU nodes. This transition to a high-density server infrastructure is enabling organizations to improve workload density by up to 40%.
The adoption of a modular server design also supports a high-availability system, which is critical for a modern hybrid cloud environment and ensures that data center power density can be managed effectively through innovative server thermal management.
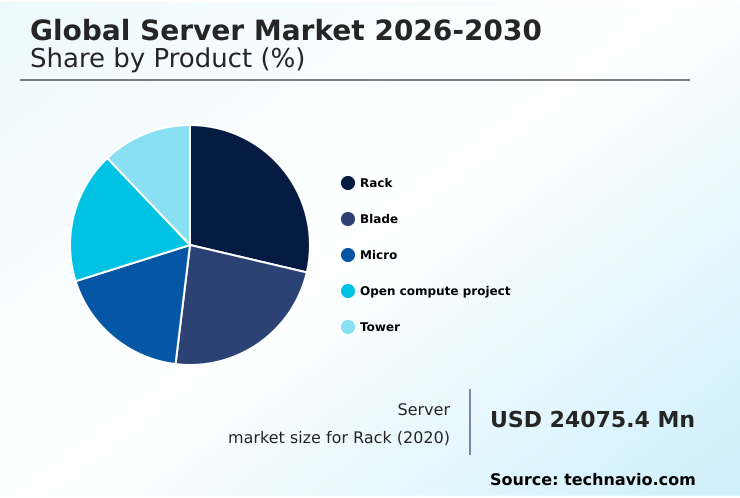
The Rack segment was valued at USD 27.29 billion in 2024 and showed a gradual increase during the forecast period.
Regional Analysis
North America is estimated to contribute 38.8% to the growth of the global market during the forecast period.Technavio’s analysts have elaborately explained the regional trends and drivers that shape the market during the forecast period.
See How Server Market Demand is Rising in North America Get Free Sample
The geographic landscape of the server market is characterized by distinct regional priorities. The North America region, contributing 38.82% of the market’s incremental growth, leads in hyperscale data center expansion and the adoption of accelerated computing for AI.
Europe, which accounts for 30.26% of growth, is driven by a focus on digital sovereignty and stringent environmental regulations, creating a robust demand for secure and energy-efficient hardware.
The APAC region is the fastest-growing and serves as a critical manufacturing hub, with local firms leveraging this advantage for cost-effective production. The expansion of 5G networks in technologically advanced APAC countries is also fueling demand for micro-edge servers.
An immersion cooling solution is becoming critical in all regions to manage heat. The need for a fault tolerant server and efficient workload optimization is a global requirement driving hardware choices.
Market Dynamics
Our researchers analyzed the data with 2025 as the base year, along with the key drivers, trends, and challenges. A holistic analysis of drivers will help companies refine their marketing strategies to gain a competitive advantage.
- Enterprises navigating the server market are engaged in a complex decision-making process, moving beyond simple procurement to strategic infrastructure design. A primary consideration involves assessing server total cost of ownership, which now extends beyond initial capital expenditure to include long-term power and cooling expenses.
- The impact of high-bandwidth memory on servers is a key factor for AI-centric businesses, as it directly affects the performance of training workloads. This leads to a detailed evaluation of the trade-offs between x86 and arm architecture, with the latter gaining traction due to its superior performance-per-watt in certain applications.
- Consequently, improving power usage effectiveness in datacenters has become a strategic imperative, with some facilities achieving a 25% reduction in non-computing energy use. This requires a holistic approach, from managing server firmware and security patches to implementing secure boot in enterprise servers. The challenges of data center consolidation are also being addressed through more flexible architectures.
- As organizations explore the deployment of network functions virtualization, the underlying hardware's ability to support such dynamic workloads becomes critical. This environment necessitates robust server lifecycle management best practices to ensure both security and operational efficiency.
What are the key market drivers leading to the rise in the adoption of Server Industry?
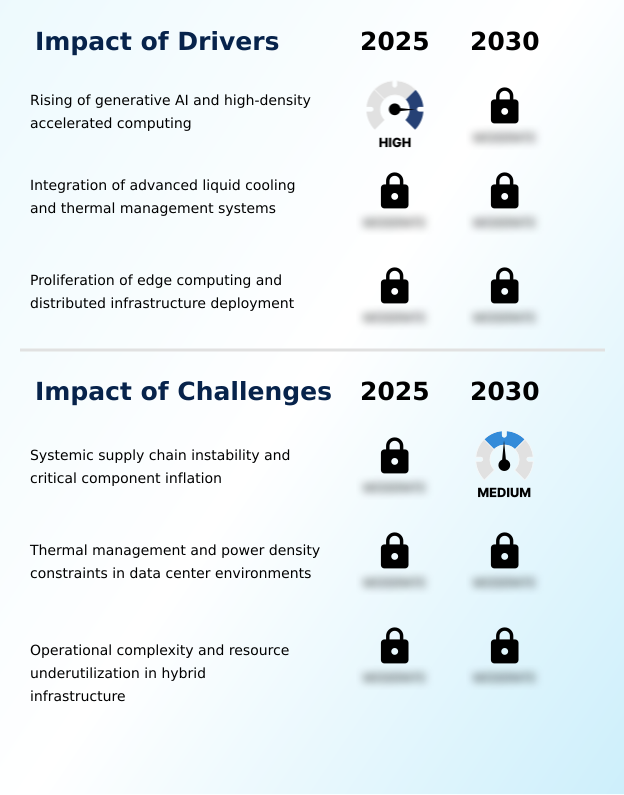
- The rise of generative AI and high-density accelerated computing is a key driver for the server market.
- The exponential growth of generative AI and high-performance computing is fundamentally reshaping the market, driving a shift from general-purpose CPU servers to an accelerated computing platform.
- This transition has led to a complete redesign of server architecture, where the integration of advanced liquid cooling has become critical, improving thermal efficiency by over 30% in high-density environments.
- This trend is creating a divergent market where the average selling price is rising due to the cost of accelerators. The dominance of AI-specific hardware, from an application-specific integrated circuit to a data processing unit, dictates long-term investment strategies.
- This structural shift toward an AI workload acceleration model is also driving the proliferation of edge computing hardware to support distributed infrastructure, where innovations in low-power processing are essential for real-time applications.
What are the market trends shaping the Server Industry?
- A mandatory shift toward advanced liquid cooling solutions is emerging as a key market trend, driven by the thermal demands of AI-ready infrastructure.
- The market is undergoing a significant transformation in thermal management due to the heat densities of AI and high-performance computing. Traditional air-cooling is becoming insufficient, leading to a mandatory shift toward liquid cooling, such as direct-to-chip systems. This transition is driven by hardware reliability and efficiency needs, with advanced cooling reducing power usage effectiveness ratios by up to 20%.
- The proliferation of an AI inference server and the focus on data localization requirements are making a ruggedized edge server more common. The adoption of liquid cooling enables higher rack density, allowing organizations to maximize facility footprints.
- A secure boot process and remote server management are becoming standard, reflecting a focus on both security and operational efficiency in a distributed computing model.
What challenges does the Server Industry face during its growth?
- Systemic supply chain instability and critical component inflation present a key challenge affecting industry growth.
- The market faces profound structural instability within its upstream supply chain, marked by component shortages and price hikes. The demand for advanced semiconductors and GPUs for AI has outpaced manufacturing capacity, leading to significant increases in the average selling price of server units, with some critical components seeing costs rise by over 60% in a single quarter.
- This volatility complicates server hardware procurement and extends hardware refresh cycle timelines. These server supply chain logistics issues are a primary restraint. Furthermore, operational complexity in multi-cloud server orchestration and the challenge of resource underutilization persist. This environment makes it difficult for OEMs to achieve economies of scale, forcing a strategic focus on IT infrastructure modernization and more resilient sourcing.
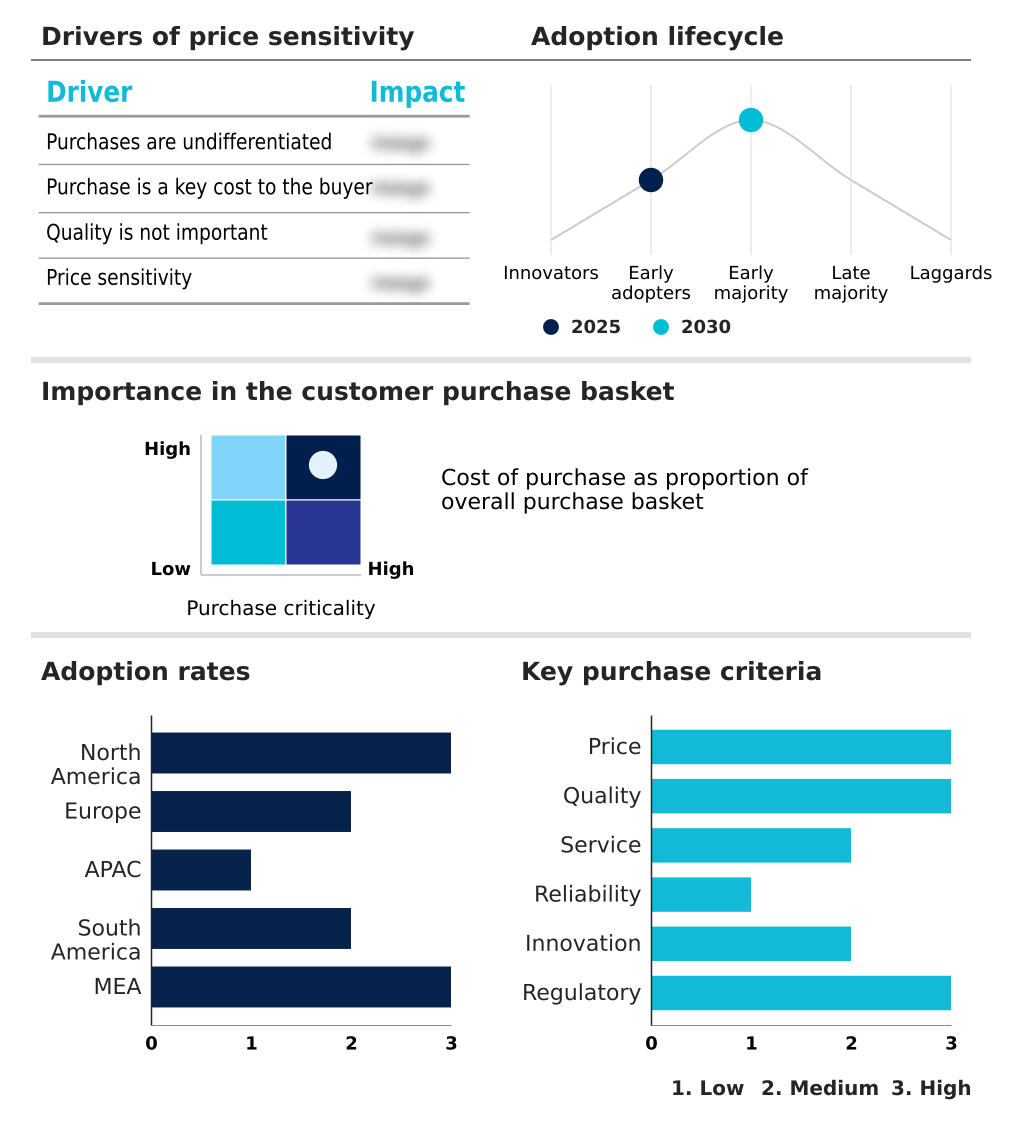
Exclusive Technavio Analysis on Customer Landscape
The server market forecasting report includes the adoption lifecycle of the market, covering from the innovator’s stage to the laggard’s stage. It focuses on adoption rates in different regions based on penetration. Furthermore, the server market report also includes key purchase criteria and drivers of price sensitivity to help companies evaluate and develop their market growth analysis strategies.
Customer Landscape of Server Industry
Competitive Landscape
Companies are implementing various strategies, such as strategic alliances, server market forecast, partnerships, mergers and acquisitions, geographical expansion, and product/service launches, to enhance their presence in the industry.
Advantech Co. Ltd. - The company landscape features a mix of multinational hardware manufacturers, specialized component suppliers, and integrated solution providers for the Global Server Market 2026-2030.
The industry research and growth report includes detailed analyses of the competitive landscape of the market and information about key companies, including:
- Advantech Co. Ltd.
- ASUSTeK Computer Inc.
- Atos SE
- Cisco Systems Inc.
- Dell Technologies Inc.
- Fujitsu Ltd.
- Gigabyte Technology Co. Ltd.
- H3C Technologies Co Ltd.
- Hewlett Packard Enterprise Co.
- Hitachi Ltd.
- Huawei Technologies Co. Ltd.
- IBM Corp.
- Inventec Corp.
- Lenovo Group Ltd.
- NEC Corp.
- NVIDIA Corp.
- Oracle Corp.
- Penguin Solutions Inc.
- Super Micro Computer Inc.
- Wiwynn Corp.
Qualitative and quantitative analysis of companies has been conducted to help clients understand the wider business environment as well as the strengths and weaknesses of key industry players. Data is qualitatively analyzed to categorize companies as pure play, category-focused, industry-focused, and diversified; it is quantitatively analyzed to categorize companies as dominant, leading, strong, tentative, and weak.
Recent Development and News in Server market
- In May, 2025, SealingTech introduced the AegisEdge MicroServer, a product designed to provide cybersecurity and AI-driven edge computing for critical infrastructure.
- In May, 2025, Google Cloud made its C4D virtual machine instances generally available, powered by fifth-generation AMD EPYC processors and optimized for high-performance general-purpose computing.
- In February, 2025, the prominent immersion cooling innovator Submer announced a significant global expansion of its SmartPod cooling systems designed specifically for high-density artificial intelligence facilities.
- In February, 2025, Hewlett Packard Enterprise introduced its next-generation ProLiant server series, which features a significantly enhanced AI-driven management suite designed for intelligent operations in hybrid cloud environments.
Dive into Technavio’s robust research methodology, blending expert interviews, extensive data synthesis, and validated models for unparalleled Server Market insights. See full methodology.
| Market Scope | |
|---|---|
| Page number | 318 |
| Base year | 2025 |
| Historic period | 2020-2024 |
| Forecast period | 2026-2030 |
| Growth momentum & CAGR | Accelerate at a CAGR of 7.7% |
| Market growth 2026-2030 | USD 45647.9 million |
| Market structure | Fragmented |
| YoY growth 2025-2026(%) | 7.2% |
| Key countries | US, Canada, Mexico, Germany, UK, France, Italy, Spain, The Netherlands, China, Japan, India, South Korea, Australia, Indonesia, Brazil, Argentina, Chile, South Africa, Saudi Arabia, UAE, Israel and Turkey |
| Competitive landscape | Leading Companies, Market Positioning of Companies, Competitive Strategies, and Industry Risks |
Research Analyst Overview
- The server market is defined by a decisive pivot toward specialized hardware optimized for next-generation computing paradigms. The integration of a dedicated graphics processing unit and high-bandwidth memory is no longer a niche requirement but a mainstream standard for any organization deploying AI-driven operations.
- This shift compels a re-evaluation of data center design, where thermal design power and power usage effectiveness are primary metrics. For instance, the adoption of autonomous server management platforms, which leverage predictive analytics within the management controller, has been shown to reduce manual interventions for routine hardware maintenance by over 60%.
- This evolution connects directly to boardroom strategy, as the selection of an accelerated computing platform, whether for a distributed data center or a high-performance computing cluster, now dictates long-term operational expenditure and competitive agility.
- The emphasis on a secure enclave technology and hardware-based encryption within the server firmware underscores the strategic importance of building resilient and trustworthy systems from the foundational silicon level, including the system on a chip, up to the hyper-converged infrastructure.
What are the Key Data Covered in this Server Market Research and Growth Report?
-
What is the expected growth of the Server Market between 2026 and 2030?
-
USD 45.65 billion, at a CAGR of 7.7%
-
-
What segmentation does the market report cover?
-
The report is segmented by Product (Rack, Blade, Micro, Open compute project, and Tower), End-user (IT and telecom, BFSI, Government and defense, Healthcare, and Others), Channel (Direct, and Reseller) and Geography (North America, Europe, APAC, South America, Middle East and Africa)
-
-
Which regions are analyzed in the report?
-
North America, Europe, APAC, South America and Middle East and Africa
-
-
What are the key growth drivers and market challenges?
-
Rising of generative AI and high-density accelerated computing, Systemic supply chain instability and critical component inflation
-
-
Who are the major players in the Server Market?
-
Advantech Co. Ltd., ASUSTeK Computer Inc., Atos SE, Cisco Systems Inc., Dell Technologies Inc., Fujitsu Ltd., Gigabyte Technology Co. Ltd., H3C Technologies Co Ltd., Hewlett Packard Enterprise Co., Hitachi Ltd., Huawei Technologies Co. Ltd., IBM Corp., Inventec Corp., Lenovo Group Ltd., NEC Corp., NVIDIA Corp., Oracle Corp., Penguin Solutions Inc., Super Micro Computer Inc. and Wiwynn Corp.
-
Market Research Insights
- Market dynamics are increasingly shaped by the purchasing power of hyperscale operators and the technological influence of semiconductor suppliers. This creates a competitive environment where hardware refresh cycles are accelerating, and total cost of ownership is a primary focus.
- The push for custom silicon development has demonstrated an ability to reduce power consumption by up to 25% for specific workloads, compelling innovation across the board. Furthermore, the adoption of advanced server thermal management strategies, such as direct liquid cooling, can improve power usage effectiveness by over 15%, a critical metric for data center energy efficiency.
- As enterprises pursue IT infrastructure modernization, the emphasis on a high-availability system and efficient workload scheduling efficiency is paramount. This intense focus on server performance-per-watt and data center footprint optimization is driving a reevaluation of traditional server hardware procurement strategies.
We can help! Our analysts can customize this server market research report to meet your requirements.
 RIA -
RIA - 
