Television Market Analysis, Size, and Forecast 2025-2029: North America (US and Canada), Europe (France, Germany, Italy, and UK), Middle East and Africa (Egypt, KSA, Oman, and UAE), APAC (China, India, and Japan), South America (Argentina and Brazil), and Rest of World (ROW)

Television Market Analysis, Size, and Forecast 2025-2029:
North America (US and Canada), Europe (France, Germany, Italy, and UK), Middle East and Africa (Egypt, KSA, Oman, and UAE), APAC (China, India, and Japan), South America (Argentina and Brazil), and Rest of World (ROW)

Published: Dec 2024 202 Pages SKU: IRTNTR41137

Market Overview at a Glance

$73.1 B
Market Opportunity
8.2%
CAGR
7.4
YoY growth 2024-2025(%)

Television Market Size 2025-2029

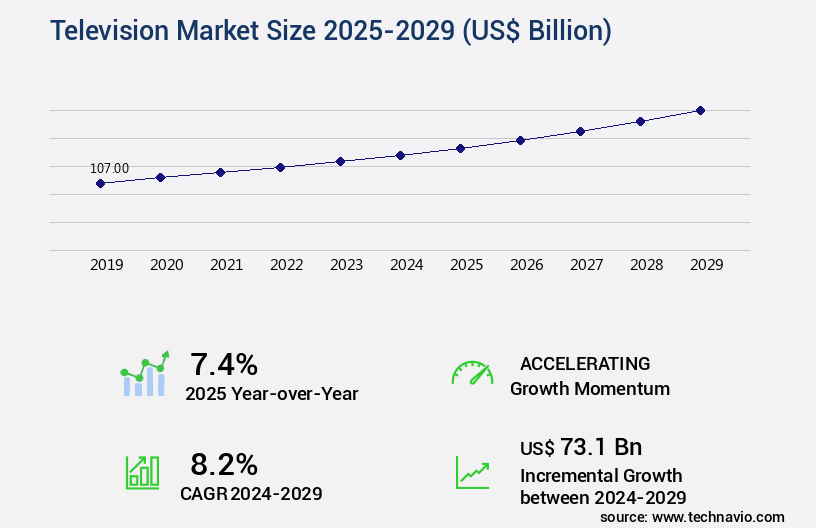
The television market size is valued to increase USD 73.1 billion, at a CAGR of 8.2% from 2024 to 2029. Product innovation and advances leading to portfolio extension and product premiumization will drive the television market.

Major Market Trends & Insights

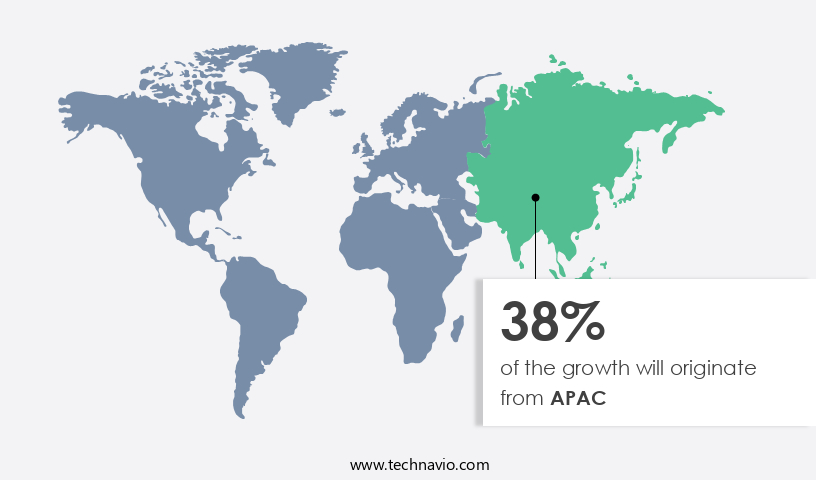
  • APAC dominated the market and accounted for a 38% growth during the forecast period.
  • By Technology - UHD segment was valued at USD 53.60 billion in 2023
  • By Display Size - Upto 43 inches segment accounted for the largest market revenue share in 2023

Market Size & Forecast

  • Market Opportunities: USD 109.44 billion
  • Market Future Opportunities: USD 73.10 billion
  • CAGR : 8.2%
  • APAC: Largest market in 2023

Market Summary

  • The market encompasses the production, distribution, and consumption of television services and devices. Core technologies, such as OLED and Quantum Dot, continue to drive innovation, leading to product premiumization through advanced features and higher resolutions, like 8K UHD. Applications span from traditional broadcasting to streaming services, with the latter experiencing significant growth. Service types include pay-TV, free-to-air, and subscription-based models. Regulations, like the European Union's Audiovisual Media Services Directive, influence market dynamics. Despite the advances, challenges persist, such as the lack of 4K content and high production costs.
  • The introduction of 8K UHD televisions represents a major leap forward in display technology, offering enhanced picture quality and immersive viewing experiences. The global OTT video market share is projected to reach 33.3% by 2026. This continuous evolution underscores the market's dynamic nature, offering opportunities for companies to expand their portfolios and cater to evolving consumer preferences.

What will be the Size of the Television Market during the forecast period?

Television Market Size

Get Key Insights on Market Forecast (PDF) Request Free Sample

How is the Television Market Segmented and what are the key trends of market segmentation?

The television industry research report provides comprehensive data (region-wise segment analysis), with forecasts and estimates in "USD billion" for the period 2025-2029, as well as historical data from 2019-2023 for the following segments.

  • Technology
    • UHD
    • HD
  • Display Size
    • Upto 43 inches
    • 55-64 inches
    • 48-50 inches
    • Greater than 65 inches
  • Type
    • Smart TV
    • LCD, Plasma, and LED TVs
    • Cathode-Ray Tube (CRT) and Rear-Projection TVs
  • Distribution Channel
    • Offline
    • Online
  • Screen Technology
    • LCD
    • OLED
    • QLED
    • MicroLED
  • Smart Features
    • Smart TV with Internet connectivity
    • Voice-controlled TV
    • TV with built-in streaming services
    • TV with gaming capabilities
  • Price Range
    • Mass
    • Premium
  • Application
    • Residential
    • Commercial
  • Geography
    • North America
      • US
      • Canada
    • Europe
      • France
      • Germany
      • Italy
      • UK
    • Middle East and Africa
      • Egypt
      • KSA
      • Oman
      • UAE
    • APAC
      • China
      • India
      • Japan
    • South America
      • Argentina
      • Brazil
    • Rest of World (ROW)

By Technology Insights

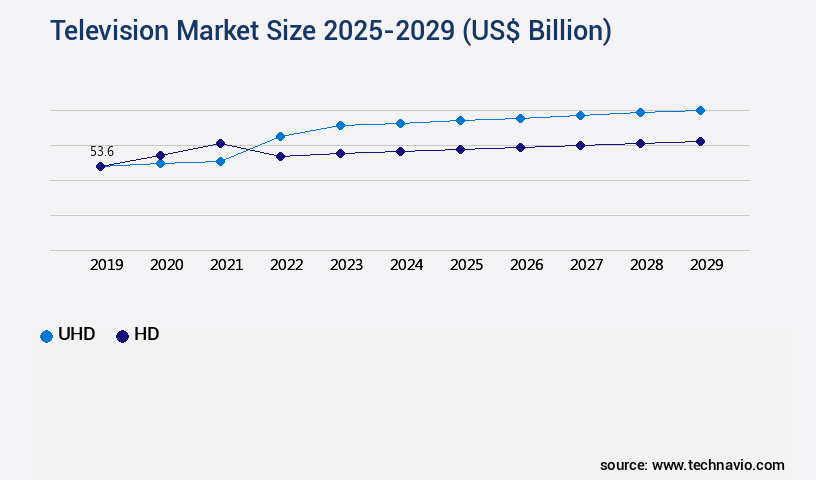
The uhd segment is estimated to witness significant growth during the forecast period.

The market continues to evolve, with significant advancements in display technologies and connectivity options. Currently, over 30% of televisions sold incorporate Wi-Fi connectivity, enabling seamless streaming of content from various sources. Micro LED technology and 8K resolution displays are gaining traction, offering enhanced brightness metrics and superior HDR picture quality. Smart TV platforms, such as those with LED backlight technology, are increasingly popular due to their energy efficiency and advanced features, including motion interpolation technology and voice control. Quantum dot technology and mini-LED backlighting are also emerging trends, providing improved color gamut coverage and local dimming technology for superior contrast ratio metrics.

Power consumption watts remains a crucial consideration, with energy efficiency ratings becoming increasingly important. USB connectivity and Ethernet connectivity are essential for easy content transfer and internet access. The market is expected to grow, with 35% of industry players forecasting increased demand for UHD televisions due to their advanced picture processing engines and support for streaming video services like Dolby Vision. Screen size variations cater to diverse consumer preferences, with refresh rate performance and response time metrics ensuring smooth visual experiences. Sound system technology and audio output channels continue to advance, offering immersive home theater experiences.

OLED burn-in prevention and HDMI connectivity are essential features for preventing screen damage and ensuring compatibility with various devices. In summary, the market is characterized by continuous innovation and advancements in display technologies, connectivity options, and energy efficiency. These trends cater to evolving consumer demands and expectations, ensuring the market remains dynamic and competitive.

Television Market Size

Request Free Sample

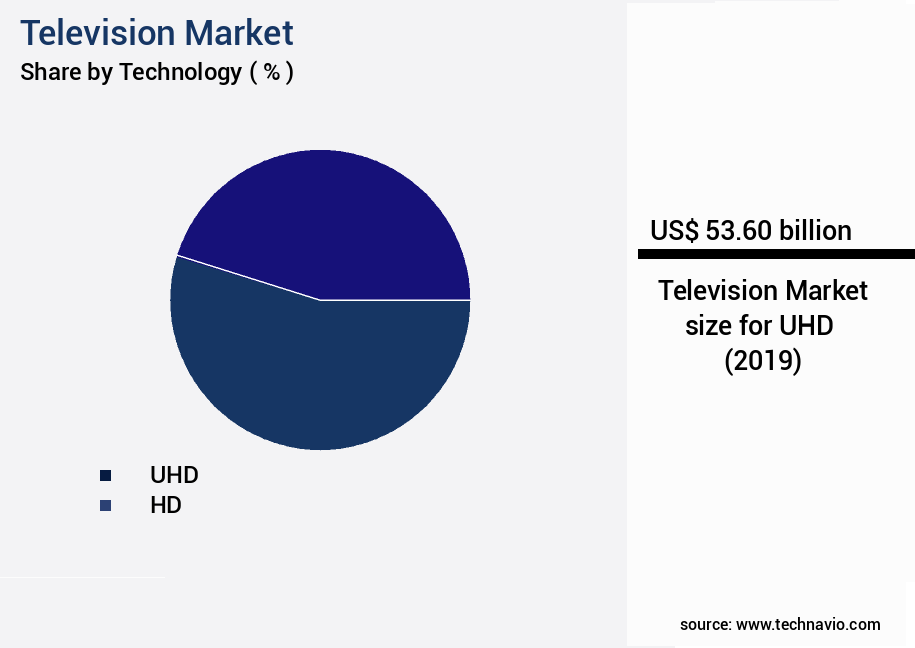
The UHD segment was valued at USD 53.60 billion in 2019 and showed a gradual increase during the forecast period.

Television Market Size

Request Free Sample

Regional Analysis

APAC is estimated to contribute 38% to the growth of the global market during the forecast period.Technavio's analysts have elaborately explained the regional trends and drivers that shape the market during the forecast period.

Television Market Share by Geography

See How Television Market Demand is Rising in APAC Request Free Sample

In the Asia-Pacific (APAC) region, HD and UHD television manufacturing is a significant industry hub. With numerous leading television manufacturers headquartered in APAC, particularly in China, the region hosts prominent companies of IC drivers and panel displays, as well as Original Equipment Manufacturers (OEMs). This presence of major players in the region results in a lower Average Selling Price (ASP) for televisions compared to other regions.

The reduced ASP encourages consumer adoption, as Chinese manufacturers offer UHD and HD televisions at lower prices than global brands like LG Electronics. The high domestic demand for affordable televisions in APAC is a testament to the region's dynamic the market.

Market Dynamics

Our researchers analyzed the data with 2024 as the base year, along with the key drivers, trends, and challenges. A holistic analysis of drivers will help companies refine their marketing strategies to gain a competitive advantage.

The market is a dynamic and technologically advanced industry, characterized by continuous innovation and competition. One of the key areas of focus is the enhancement of display quality through technologies such as OLED TV pixel response time analysis and local dimming zones, which significantly impact contrast levels. HDR peak brightness level measurement and wide color gamut coverage assessment are other essential aspects of high-definition television, with quantum dot technology color enhancement providing a notable boost. Manufacturers are increasingly investing in mini LED backlight uniformity testing and smart TV platform user interface usability to cater to evolving consumer preferences.

Streaming app compatibility verification and HDMI port bandwidth limitations testing are critical considerations to ensure seamless connectivity and content delivery. Wi-fi performance in streaming scenarios and TV energy efficiency rating comparison are essential factors for consumers seeking cost-effective and efficient solutions. Audio system frequency response analysis and picture processing engine algorithm details are crucial components of television performance. Motion interpolation technology artifacts and screen size and viewing distance recommendations are essential for delivering a superior viewing experience. Refresh rate impact on gaming performance and input lag measurement methodology are vital for gamers. Color accuracy under different lighting conditions and power consumption under various usage scenarios are significant concerns for both manufacturers and consumers.

Notably, a substantial portion of new product developments focus on enhancing picture quality and energy efficiency, with these features accounting for over 60% of the total R&D investments in the market. This data underscores the industry's commitment to delivering superior television experiences while addressing growing environmental concerns.

Television Market Size

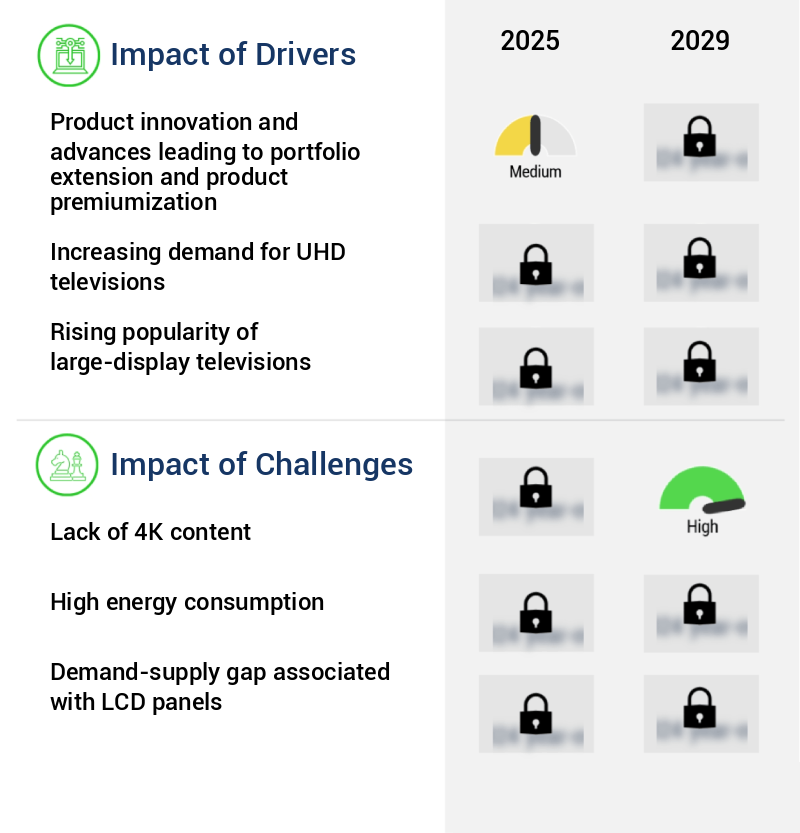
What are the key market drivers leading to the rise in the adoption of Television Industry?

  • Product innovation and advances, which include the development of new offerings and the enhancement of existing ones, serve as the primary catalyst for market growth through portfolio extension and product premiumization. 
  • The market experiences intense competition, fueled by technological innovations and evolving customer preferences. companies in this sector are continually investing in research and development to stay ahead. Major product advancements include improvements in technology, performance, features, and design. Consumers increasingly seek multifunctional televisions with minimal resource consumption. This dynamic market landscape underscores the importance of continuous innovation and adaptation to meet customer demands.

What are the market trends shaping the Television Industry?

  • The arrival of 8K Ultra High Definition televisions signifies the latest market trend. This technological advancement represents a significant shift in the television industry.
  • The market continues to evolve, with large-screen televisions, specifically those larger than 40 inches, increasingly being produced with Ultra High Definition (UHD) or 4K resolution. At the Consumer Electronics Show (CES) 2018, the next generation of UHD televisions with 8K resolution was unveiled. Boasting a higher resolution standard, 8K televisions offer approximately 8,000 horizontal pixels, quadrupling the total number compared to 4K. This growth in 8K televisions can be attributed to the escalating demand for high-resolution display devices and the advancement of content creation.
  • While some major companies, including LG, Samsung, and Sony, have introduced 8K television series, these are primarily proof-of-concept models and not yet available for consumers. The 8K televisions showcased at CES represented a significant leap forward in resolution technology.

What challenges does the Television Industry face during its growth?

  • The absence of a substantial 4K content library poses a significant challenge to the growth of the industry. 
  • The adoption of Ultra High Definition (UHD) televisions faces a significant challenge due to the limited availability of 4K content. This issue is compounded by the proprietary nature of 4K media, which restricts access and affects user experience. Over-the-top (OTT) platforms, including Sky Ltd., BT, Amazon Inc., and Netflix, are addressing this concern by gradually adding 4K content to their offerings. However, access to these premium videos remains limited due to additional costs. The primary hurdles associated with 4K and 8K resolutions are in-home capabilities and content distribution.
  • Despite the ownership of UHD devices, many consumers lack access to 4K content as broadcasters have yet to produce substantial amounts. The ongoing efforts of content creators and distributors to expand their 4K offerings will significantly impact the UHD the market's growth trajectory.

Exclusive Technavio Analysis on Customer Landscape

The television market forecasting report includes the adoption lifecycle of the market, covering from the innovator's stage to the laggard's stage. It focuses on adoption rates in different regions based on penetration. Furthermore, the television market report also includes key purchase criteria and drivers of price sensitivity to help companies evaluate and develop their market growth analysis strategies.

Television Market Share by Geography

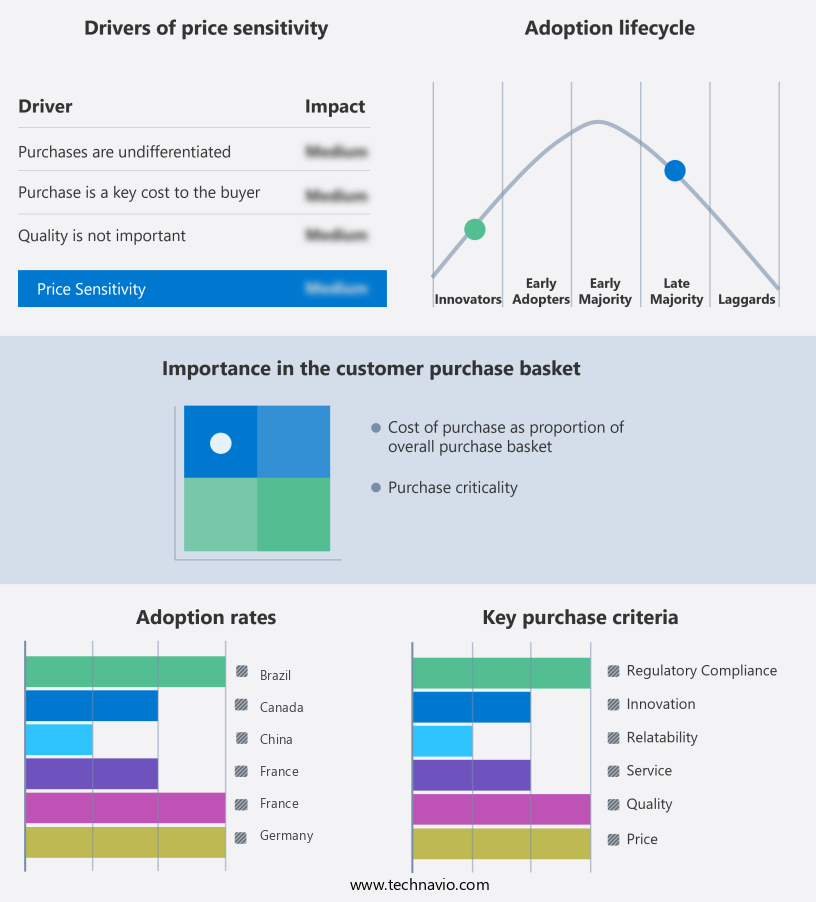
 Customer Landscape of Television Industry

Competitive Landscape

Companies are implementing various strategies, such as strategic alliances, television market forecast, partnerships, mergers and acquisitions, geographical expansion, and product/service launches, to enhance their presence in the industry.

Apple Inc. - This company specializes in the production and distribution of advanced televisions, including LCD, LED, and OLED models, delivering superior image quality and innovative technology to consumers worldwide.

The industry research and growth report includes detailed analyses of the competitive landscape of the market and information about key companies, including:

  • Apple Inc.
  • Changhong
  • Funai Electric Co. Ltd.
  • Haier Smart Home Co. Ltd.
  • Hisense International Co. Ltd.
  • Koninklijke Philips NV
  • Konka Group Co. Ltd.
  • LG Corp.
  • MIRC Electronics Ltd.
  • Panasonic Holdings Corp.
  • Roku Inc.
  • Samsung Electronics Co. Ltd.
  • Sceptre Inc.
  • Sharp Corp.
  • Skyworth Group Ltd.
  • Sony Group Corp.
  • TCL Industries Holdings Co. Ltd.
  • Toshiba Corporation
  • VIZIO Holding Corp.
  • Xiaomi Inc.

Qualitative and quantitative analysis of companies has been conducted to help clients understand the wider business environment as well as the strengths and weaknesses of key industry players. Data is qualitatively analyzed to categorize companies as pure play, category-focused, industry-focused, and diversified; it is quantitatively analyzed to categorize companies as dominant, leading, strong, tentative, and weak.

Recent Development and News in Television Market

  • In January 2024, Disney+, a leading streaming platform, announced the acquisition of MGM Studios for approximately USD16.2 billion, expanding its content library significantly (Disney Press Release, 2024). This strategic move aimed to strengthen Disney+'s position in the competitive streaming market.
  • In March 2024, Comcast and NBCUniversal, in collaboration with Amazon, launched a new ad-supported streaming service, Peacock Free, offering free access to a vast library of movies and TV shows (Comcast Press Release, 2024). This strategic partnership aimed to attract a broader audience and increase market penetration.
  • In April 2025, Roku, a leading streaming device manufacturer, reported a 43% increase in revenue year-over-year, reaching USD1.3 billion, driven by the growing demand for streaming services (Roku Q1 Earnings Report, 2025). This significant revenue growth underscores the increasing popularity of streaming services and the shift from traditional television.
  • In May 2025, the European Union passed the Digital Markets Act, which aims to regulate digital markets and promote fair competition, including the streaming sector (EU Press Release, 2025). This regulatory approval could lead to changes in the streaming market, including stricter content regulations and potential antitrust investigations.

Dive into Technavio's robust research methodology, blending expert interviews, extensive data synthesis, and validated models for unparalleled Television Market insights. See full methodology.

Market Scope

Report Coverage

Details

Page number

202

Base year

2024

Historic period

2019-2023

Forecast period

2025-2029

Growth momentum & CAGR

Accelerate at a CAGR of 8.2%

Market growth 2025-2029

USD 73.1 billion

Market structure

Fragmented

YoY growth 2024-2025(%)

7.4

Key countries

US, Canada, Germany, UK, Italy, France, China, India, Japan, Brazil, Egypt, UAE, Oman, Argentina, KSA, UAE, Brazil, and Rest of World (ROW)

Competitive landscape

Leading Companies, Market Positioning of Companies, Competitive Strategies, and Industry Risks

Request Free Sample

Research Analyst Overview

  • In the dynamic and ever-evolving market, Wi-Fi connectivity has become a standard feature, enabling seamless streaming of content from various sources. Micro LED technology and 8K resolution displays are gaining traction, offering enhanced brightness and exceptional picture quality. HDR picture quality, aided by mini-LED backlighting, delivers more vibrant colors and deeper blacks. LED backlight technology, with its energy efficiency ratings, continues to dominate the market. Smart TV platforms, with their advanced remote control features and voice control capabilities, are transforming user experiences. Motion interpolation technology ensures smoother visuals during fast-paced action scenes. Color gamut coverage, a critical aspect of picture quality, is expanding with the adoption of quantum dot technology.
  • Digital TV tuners and USB connectivity cater to traditional broadcast and local media storage needs. Ethernet connectivity and HDMI ports provide wired options for high-speed data transfer. Power consumption watts and energy efficiency ratings are essential considerations as consumers seek eco-friendly solutions. Refresh rate performance, response time metrics, and contrast ratio metrics are other essential performance indicators. OLED burn-in prevention technology ensures extended display life. Sound system technology, with its audio output channels and advanced processing engines, enhances the overall viewing experience. Dolby Vision support adds another layer of immersive visual and audio experiences.
  • Streaming video services have transformed content consumption patterns, with consumers increasingly opting for on-demand content. Screen size variations cater to diverse user preferences, while local dimming technology optimizes picture quality based on the content being displayed. The market continues to evolve, with ongoing advancements in technology and consumer preferences shaping its dynamics.

What are the Key Data Covered in this Television Market Research and Growth Report?

  • What is the expected growth of the Television Market between 2025 and 2029?

    • USD 73.1 billion, at a CAGR of 8.2%

  • What segmentation does the market report cover?

    • The report is segmented by Technology (UHD and HD), Display Size (Upto 43 inches, 55-64 inches, 48-50 inches, and Greater than 65 inches), Geography (APAC, North America, Europe, South America, and Middle East and Africa), Type (Smart TV, LCD, Plasma, and LED TVs, and Cathode-Ray Tube (CRT) and Rear-Projection TVs), Distribution Channel (Offline and Online), Screen Technology (LCD, OLED, QLED, and MicroLED), Smart Features (Smart TV with Internet connectivity, Voice-controlled TV, TV with built-in streaming services, and TV with gaming capabilities), Price Range (Mass and Premium), and Application (Residential and Commercial)

  • Which regions are analyzed in the report?

    • APAC, North America, Europe, South America, and Middle East and Africa

  • What are the key growth drivers and market challenges?

    • Product innovation and advances leading to portfolio extension and product premiumization, Lack of 4K content

  • Who are the major players in the Television Market?

    • Apple Inc., Changhong, Funai Electric Co. Ltd., Haier Smart Home Co. Ltd., Hisense International Co. Ltd., Koninklijke Philips NV, Konka Group Co. Ltd., LG Corp., MIRC Electronics Ltd., Panasonic Holdings Corp., Roku Inc., Samsung Electronics Co. Ltd., Sceptre Inc., Sharp Corp., Skyworth Group Ltd., Sony Group Corp., TCL Industries Holdings Co. Ltd., Toshiba Corporation, VIZIO Holding Corp., and Xiaomi Inc.

Market Research Insights

  • The market continues to evolve, with content streaming apps becoming increasingly popular and remote app capabilities enhancing user experience. According to industry estimates, streaming services accounted for 31% of total television viewing time in 2020, up from 23% in 2018. This trend is driven by the availability of high-definition HDR content and support for various audio decoding formats. Display panels have advanced significantly, with 4K becoming the new standard and 8K on the horizon. Power management systems and gaming mode settings are essential features for modern televisions, ensuring efficient energy usage and optimized performance. Parental control settings and accessibility features cater to diverse user needs, while firmware version control enables seamless software updates.
  • Television manufacturers prioritize picture enhancement modes, energy star certification, and user interface design to differentiate their products. Connectivity interfaces and wireless streaming protocols facilitate easy integration with other devices, while network security protocols safeguard user privacy. Supply chain management and manufacturing processes ensure consistent product quality, and color accuracy testing and input lag measurements contribute to improved viewing experiences. Dolby Atmos support and DTS audio enhance the audio experience, while multi-room audio systems and data encryption methods cater to modern home entertainment needs.

We can help! Our analysts can customize this television market research report to meet your requirements.

Get in touch

1 Executive Summary

  • 1.1 Market overview
    • Executive Summary - Chart on Market Overview
    • Executive Summary - Data Table on Market Overview
    • Executive Summary - Chart on Global Market Characteristics
    • Executive Summary - Chart on Market by Geography
    • Executive Summary - Chart on Market Segmentation by Technology
    • Executive Summary - Chart on Market Segmentation by Display Size
    • Executive Summary - Chart on Incremental Growth
    • Executive Summary - Data Table on Incremental Growth
    • Executive Summary - Chart on Company Market Positioning

2 Technavio Analysis

  • 2.1 Analysis of price sensitivity, lifecycle, customer purchase basket, adoption rates, and purchase criteria
    • Analysis of price sensitivity, lifecycle, customer purchase basket, adoption rates, and purchase criteria
  • 2.2 Criticality of inputs and Factors of differentiation
    • Overview on criticality of inputs and factors of differentiation
  • 2.3 Factors of disruption
    • Overview on factors of disruption
  • 2.4 Impact of drivers and challenges
    • Impact of drivers and challenges in 2024 and 2029

3 Market Landscape

  • 3.1 Market ecosystem
    • Parent Market
    • Data Table on - Parent Market
  • 3.2 Market characteristics
    • Market characteristics analysis
  • 3.3 Value chain analysis
    • Value chain analysis

4 Market Sizing

  • 4.1 Market definition
    • Offerings of companies included in the market definition
  • 4.2 Market segment analysis
    • Market segments
  • 4.3 Market size 2024
    • 4.4 Market outlook: Forecast for 2024-2029
      • Chart on Global - Market size and forecast 2024-2029 ($ billion)
      • Data Table on Global - Market size and forecast 2024-2029 ($ billion)
      • Chart on Global Market: Year-over-year growth 2024-2029 (%)
      • Data Table on Global Market: Year-over-year growth 2024-2029 (%)

    5 Historic Market Size

    • 5.1 Global Television Market 2019 - 2023
      • Historic Market Size - Data Table on Global Television Market 2019 - 2023 ($ billion)
    • 5.2 Technology segment analysis 2019 - 2023
      • Historic Market Size - Technology Segment 2019 - 2023 ($ billion)
    • 5.3 Display Size segment analysis 2019 - 2023
      • Historic Market Size - Display Size Segment 2019 - 2023 ($ billion)
    • 5.4 Geography segment analysis 2019 - 2023
      • Historic Market Size - Geography Segment 2019 - 2023 ($ billion)
    • 5.5 Country segment analysis 2019 - 2023
      • Historic Market Size - Country Segment 2019 - 2023 ($ billion)

    6 Qualitative Analysis

    • 6.1 The AI impact on Global Television Market

      7 Five Forces Analysis

      • 7.1 Five forces summary
        • Five forces analysis - Comparison between 2024 and 2029
      • 7.2 Bargaining power of buyers
        • Bargaining power of buyers - Impact of key factors 2024 and 2029
      • 7.3 Bargaining power of suppliers
        • Bargaining power of suppliers - Impact of key factors in 2024 and 2029
      • 7.4 Threat of new entrants
        • Threat of new entrants - Impact of key factors in 2024 and 2029
      • 7.5 Threat of substitutes
        • Threat of substitutes - Impact of key factors in 2024 and 2029
      • 7.6 Threat of rivalry
        • Threat of rivalry - Impact of key factors in 2024 and 2029
      • 7.7 Market condition
        • Chart on Market condition - Five forces 2024 and 2029

      8 Market Segmentation by Technology

      • 8.1 Market segments
        • Chart on Technology - Market share (2024-2029) (%)
        • Data Table on Technology - Market share (2024-2029) (%)
      • 8.2 Comparison by Technology
        • Chart on Comparison by Technology
        • Data Table on Comparison by Technology
      • 8.3 UHD - Market size and forecast (2024-2029)
        • Chart on UHD - Market size and forecast (2024-2029) ($ billion)
        • Data Table on UHD - Market size and forecast (2024-2029) ($ billion)
        • Chart on UHD - Year-over-year growth (2024-2029) (%)
        • Data Table on UHD - Year-over-year growth (2024-2029) (%)
      • 8.4 HD - Market size and forecast (2024-2029)
        • Chart on HD - Market size and forecast (2024-2029) ($ billion)
        • Data Table on HD - Market size and forecast (2024-2029) ($ billion)
        • Chart on HD - Year-over-year growth (2024-2029) (%)
        • Data Table on HD - Year-over-year growth (2024-2029) (%)
      • 8.5 Market opportunity by Technology
        • Market opportunity by Technology ($ billion)
        • Data Table on Market opportunity by Technology ($ billion)

      9 Market Segmentation by Display Size

      • 9.1 Market segments
        • Chart on Display Size - Market share (2024-2029) (%)
        • Data Table on Display Size - Market share (2024-2029) (%)
      • 9.2 Comparison by Display Size
        • Chart on Comparison by Display Size
        • Data Table on Comparison by Display Size
      • 9.3 Upto 43 inches - Market size and forecast (2024-2029)
        • Chart on Upto 43 inches - Market size and forecast (2024-2029) ($ billion)
        • Data Table on Upto 43 inches - Market size and forecast (2024-2029) ($ billion)
        • Chart on Upto 43 inches - Year-over-year growth (2024-2029) (%)
        • Data Table on Upto 43 inches - Year-over-year growth (2024-2029) (%)
      • 55-64 inches - Market size and forecast (2024-2029)
        • Chart on 55-64 inches - Market size and forecast (2024-2029) ($ billion)
        • Data Table on 55-64 inches - Market size and forecast (2024-2029) ($ billion)
        • Chart on 55-64 inches - Year-over-year growth (2024-2029) (%)
        • Data Table on 55-64 inches - Year-over-year growth (2024-2029) (%)
      • 48-50 inches - Market size and forecast (2024-2029)
        • Chart on 48-50 inches - Market size and forecast (2024-2029) ($ billion)
        • Data Table on 48-50 inches - Market size and forecast (2024-2029) ($ billion)
        • Chart on 48-50 inches - Year-over-year growth (2024-2029) (%)
        • Data Table on 48-50 inches - Year-over-year growth (2024-2029) (%)
      • 9.6 Greater than 65 inches - Market size and forecast (2024-2029)
        • Chart on Greater than 65 inches - Market size and forecast (2024-2029) ($ billion)
        • Data Table on Greater than 65 inches - Market size and forecast (2024-2029) ($ billion)
        • Chart on Greater than 65 inches - Year-over-year growth (2024-2029) (%)
        • Data Table on Greater than 65 inches - Year-over-year growth (2024-2029) (%)
      • 9.7 Market opportunity by Display Size
        • Market opportunity by Display Size ($ billion)
        • Data Table on Market opportunity by Display Size ($ billion)

      10 Market Segmentation by Type

      • 10.1 Market segments
        • Chart on Type - Market share (2024-2029) (%)
        • Data Table on Type - Market share (2024-2029) (%)
      • 10.2 Comparison by Type
        • Chart on Comparison by Type
        • Data Table on Comparison by Type
      • 10.3 Smart TV - Market size and forecast (2024-2029)
        • Chart on Smart TV - Market size and forecast (2024-2029) ($ billion)
        • Data Table on Smart TV - Market size and forecast (2024-2029) ($ billion)
        • Chart on Smart TV - Year-over-year growth (2024-2029) (%)
        • Data Table on Smart TV - Year-over-year growth (2024-2029) (%)
      • 10.4 LCD, Plasma, and LED TVs - Market size and forecast (2024-2029)
        • Chart on LCD, Plasma, and LED TVs - Market size and forecast (2024-2029) ($ billion)
        • Data Table on LCD, Plasma, and LED TVs - Market size and forecast (2024-2029) ($ billion)
        • Chart on LCD, Plasma, and LED TVs - Year-over-year growth (2024-2029) (%)
        • Data Table on LCD, Plasma, and LED TVs - Year-over-year growth (2024-2029) (%)
      • 10.5 Cathode-Ray Tube (CRT) and Rear-Projection TVs - Market size and forecast (2024-2029)
        • Chart on Cathode-Ray Tube (CRT) and Rear-Projection TVs - Market size and forecast (2024-2029) ($ billion)
        • Data Table on Cathode-Ray Tube (CRT) and Rear-Projection TVs - Market size and forecast (2024-2029) ($ billion)
        • Chart on Cathode-Ray Tube (CRT) and Rear-Projection TVs - Year-over-year growth (2024-2029) (%)
        • Data Table on Cathode-Ray Tube (CRT) and Rear-Projection TVs - Year-over-year growth (2024-2029) (%)
      • 10.6 Market opportunity by Type
        • Market opportunity by Type ($ billion)
        • Data Table on Market opportunity by Type ($ billion)

      11 Market Segmentation by Distribution Channel

      • 11.1 Market segments
        • Chart on Distribution Channel - Market share (2024-2029) (%)
        • Data Table on Distribution Channel - Market share (2024-2029) (%)
      • 11.2 Comparison by Distribution Channel
        • Chart on Comparison by Distribution Channel
        • Data Table on Comparison by Distribution Channel
      • 11.3 Offline - Market size and forecast (2024-2029)
        • Chart on Offline - Market size and forecast (2024-2029) ($ billion)
        • Data Table on Offline - Market size and forecast (2024-2029) ($ billion)
        • Chart on Offline - Year-over-year growth (2024-2029) (%)
        • Data Table on Offline - Year-over-year growth (2024-2029) (%)
      • 11.4 Online - Market size and forecast (2024-2029)
        • Chart on Online - Market size and forecast (2024-2029) ($ billion)
        • Data Table on Online - Market size and forecast (2024-2029) ($ billion)
        • Chart on Online - Year-over-year growth (2024-2029) (%)
        • Data Table on Online - Year-over-year growth (2024-2029) (%)
      • 11.5 Market opportunity by Distribution Channel
        • Market opportunity by Distribution Channel ($ billion)
        • Data Table on Market opportunity by Distribution Channel ($ billion)

      12 Market Segmentation by Screen Technology

      • 12.1 Market segments
        • Chart on Screen Technology - Market share (2024-2029) (%)
        • Data Table on Screen Technology - Market share (2024-2029) (%)
      • 12.2 Comparison by Screen Technology
        • Chart on Comparison by Screen Technology
        • Data Table on Comparison by Screen Technology
      • 12.3 LCD - Market size and forecast (2024-2029)
        • Chart on LCD - Market size and forecast (2024-2029) ($ billion)
        • Data Table on LCD - Market size and forecast (2024-2029) ($ billion)
        • Chart on LCD - Year-over-year growth (2024-2029) (%)
        • Data Table on LCD - Year-over-year growth (2024-2029) (%)
      • 12.4 OLED - Market size and forecast (2024-2029)
        • Chart on OLED - Market size and forecast (2024-2029) ($ billion)
        • Data Table on OLED - Market size and forecast (2024-2029) ($ billion)
        • Chart on OLED - Year-over-year growth (2024-2029) (%)
        • Data Table on OLED - Year-over-year growth (2024-2029) (%)
      • 12.5 QLED - Market size and forecast (2024-2029)
        • Chart on QLED - Market size and forecast (2024-2029) ($ billion)
        • Data Table on QLED - Market size and forecast (2024-2029) ($ billion)
        • Chart on QLED - Year-over-year growth (2024-2029) (%)
        • Data Table on QLED - Year-over-year growth (2024-2029) (%)
      • 12.6 MicroLED - Market size and forecast (2024-2029)
        • Chart on MicroLED - Market size and forecast (2024-2029) ($ billion)
        • Data Table on MicroLED - Market size and forecast (2024-2029) ($ billion)
        • Chart on MicroLED - Year-over-year growth (2024-2029) (%)
        • Data Table on MicroLED - Year-over-year growth (2024-2029) (%)
      • 12.7 Market opportunity by Screen Technology
        • Market opportunity by Screen Technology ($ billion)
        • Data Table on Market opportunity by Screen Technology ($ billion)

      13 Market Segmentation by Smart Features

      • 13.1 Market segments
        • Chart on Smart Features - Market share (2024-2029) (%)
        • Data Table on Smart Features - Market share (2024-2029) (%)
      • 13.2 Comparison by Smart Features
        • Chart on Comparison by Smart Features
        • Data Table on Comparison by Smart Features
      • 13.3 Smart TV with Internet connectivity - Market size and forecast (2024-2029)
        • Chart on Smart TV with Internet connectivity - Market size and forecast (2024-2029) ($ billion)
        • Data Table on Smart TV with Internet connectivity - Market size and forecast (2024-2029) ($ billion)
        • Chart on Smart TV with Internet connectivity - Year-over-year growth (2024-2029) (%)
        • Data Table on Smart TV with Internet connectivity - Year-over-year growth (2024-2029) (%)
      • 13.4 Voice-controlled TV - Market size and forecast (2024-2029)
        • Chart on Voice-controlled TV - Market size and forecast (2024-2029) ($ billion)
        • Data Table on Voice-controlled TV - Market size and forecast (2024-2029) ($ billion)
        • Chart on Voice-controlled TV - Year-over-year growth (2024-2029) (%)
        • Data Table on Voice-controlled TV - Year-over-year growth (2024-2029) (%)
      • 13.5 TV with built-in streaming services - Market size and forecast (2024-2029)
        • Chart on TV with built-in streaming services - Market size and forecast (2024-2029) ($ billion)
        • Data Table on TV with built-in streaming services - Market size and forecast (2024-2029) ($ billion)
        • Chart on TV with built-in streaming services - Year-over-year growth (2024-2029) (%)
        • Data Table on TV with built-in streaming services - Year-over-year growth (2024-2029) (%)
      • 13.6 TV with gaming capabilities - Market size and forecast (2024-2029)
        • Chart on TV with gaming capabilities - Market size and forecast (2024-2029) ($ billion)
        • Data Table on TV with gaming capabilities - Market size and forecast (2024-2029) ($ billion)
        • Chart on TV with gaming capabilities - Year-over-year growth (2024-2029) (%)
        • Data Table on TV with gaming capabilities - Year-over-year growth (2024-2029) (%)
      • 13.7 Market opportunity by Smart Features
        • Market opportunity by Smart Features ($ billion)
        • Data Table on Market opportunity by Smart Features ($ billion)

      14 Market Segmentation by Price Range

      • 14.1 Market segments
        • Chart on Price Range - Market share (2024-2029) (%)
        • Data Table on Price Range - Market share (2024-2029) (%)
      • 14.2 Comparison by Price Range
        • Chart on Comparison by Price Range
        • Data Table on Comparison by Price Range
      • 14.3 Mass - Market size and forecast (2024-2029)
        • Chart on Mass - Market size and forecast (2024-2029) ($ billion)
        • Data Table on Mass - Market size and forecast (2024-2029) ($ billion)
        • Chart on Mass - Year-over-year growth (2024-2029) (%)
        • Data Table on Mass - Year-over-year growth (2024-2029) (%)
      • 14.4 Premium - Market size and forecast (2024-2029)
        • Chart on Premium - Market size and forecast (2024-2029) ($ billion)
        • Data Table on Premium - Market size and forecast (2024-2029) ($ billion)
        • Chart on Premium - Year-over-year growth (2024-2029) (%)
        • Data Table on Premium - Year-over-year growth (2024-2029) (%)
      • 14.5 Market opportunity by Price Range
        • Market opportunity by Price Range ($ billion)
        • Data Table on Market opportunity by Price Range ($ billion)

      15 Market Segmentation by Application

      • 15.1 Market segments
        • Chart on Application - Market share (2024-2029) (%)
        • Data Table on Application - Market share (2024-2029) (%)
      • 15.2 Comparison by Application
        • Chart on Comparison by Application
        • Data Table on Comparison by Application
      • 15.3 Residential - Market size and forecast (2024-2029)
        • Chart on Residential - Market size and forecast (2024-2029) ($ billion)
        • Data Table on Residential - Market size and forecast (2024-2029) ($ billion)
        • Chart on Residential - Year-over-year growth (2024-2029) (%)
        • Data Table on Residential - Year-over-year growth (2024-2029) (%)
      • 15.4 Commercial - Market size and forecast (2024-2029)
        • Chart on Commercial - Market size and forecast (2024-2029) ($ billion)
        • Data Table on Commercial - Market size and forecast (2024-2029) ($ billion)
        • Chart on Commercial - Year-over-year growth (2024-2029) (%)
        • Data Table on Commercial - Year-over-year growth (2024-2029) (%)
      • 15.5 Market opportunity by Application
        • Market opportunity by Application ($ billion)
        • Data Table on Market opportunity by Application ($ billion)

      16 Customer Landscape

      • 16.1 Customer landscape overview
        • Analysis of price sensitivity, lifecycle, customer purchase basket, adoption rates, and purchase criteria

      17 Geographic Landscape

      • 17.1 Geographic segmentation
        • Chart on Market share by geography 2024-2029 (%)
        • Data Table on Market share by geography 2024-2029 (%)
      • 17.2 Geographic comparison
        • Chart on Geographic comparison
        • Data Table on Geographic comparison
      • 17.3 APAC - Market size and forecast 2024-2029
        • Chart on APAC - Market size and forecast 2024-2029 ($ billion)
        • Data Table on APAC - Market size and forecast 2024-2029 ($ billion)
        • Chart on APAC - Year-over-year growth 2024-2029 (%)
        • Data Table on APAC - Year-over-year growth 2024-2029 (%)
      • 17.4 North America - Market size and forecast 2024-2029
        • Chart on North America - Market size and forecast 2024-2029 ($ billion)
        • Data Table on North America - Market size and forecast 2024-2029 ($ billion)
        • Chart on North America - Year-over-year growth 2024-2029 (%)
        • Data Table on North America - Year-over-year growth 2024-2029 (%)
      • 17.5 Europe - Market size and forecast 2024-2029
        • Chart on Europe - Market size and forecast 2024-2029 ($ billion)
        • Data Table on Europe - Market size and forecast 2024-2029 ($ billion)
        • Chart on Europe - Year-over-year growth 2024-2029 (%)
        • Data Table on Europe - Year-over-year growth 2024-2029 (%)
      • 17.6 South America - Market size and forecast 2024-2029
        • Chart on South America - Market size and forecast 2024-2029 ($ billion)
        • Data Table on South America - Market size and forecast 2024-2029 ($ billion)
        • Chart on South America - Year-over-year growth 2024-2029 (%)
        • Data Table on South America - Year-over-year growth 2024-2029 (%)
      • 17.7 Middle East and Africa - Market size and forecast 2024-2029
        • Chart on Middle East and Africa - Market size and forecast 2024-2029 ($ billion)
        • Data Table on Middle East and Africa - Market size and forecast 2024-2029 ($ billion)
        • Chart on Middle East and Africa - Year-over-year growth 2024-2029 (%)
        • Data Table on Middle East and Africa - Year-over-year growth 2024-2029 (%)
      • 17.8 China - Market size and forecast 2024-2029
        • Chart on China - Market size and forecast 2024-2029 ($ billion)
        • Data Table on China - Market size and forecast 2024-2029 ($ billion)
        • Chart on China - Year-over-year growth 2024-2029 (%)
        • Data Table on China - Year-over-year growth 2024-2029 (%)
      • 17.9 US - Market size and forecast 2024-2029
        • Chart on US - Market size and forecast 2024-2029 ($ billion)
        • Data Table on US - Market size and forecast 2024-2029 ($ billion)
        • Chart on US - Year-over-year growth 2024-2029 (%)
        • Data Table on US - Year-over-year growth 2024-2029 (%)
      • 17.10 South Korea - Market size and forecast 2024-2029
        • Chart on South Korea - Market size and forecast 2024-2029 ($ billion)
        • Data Table on South Korea - Market size and forecast 2024-2029 ($ billion)
        • Chart on South Korea - Year-over-year growth 2024-2029 (%)
        • Data Table on South Korea - Year-over-year growth 2024-2029 (%)
      • 17.11 Germany - Market size and forecast 2024-2029
        • Chart on Germany - Market size and forecast 2024-2029 ($ billion)
        • Data Table on Germany - Market size and forecast 2024-2029 ($ billion)
        • Chart on Germany - Year-over-year growth 2024-2029 (%)
        • Data Table on Germany - Year-over-year growth 2024-2029 (%)
      • 17.12 India - Market size and forecast 2024-2029
        • Chart on India - Market size and forecast 2024-2029 ($ billion)
        • Data Table on India - Market size and forecast 2024-2029 ($ billion)
        • Chart on India - Year-over-year growth 2024-2029 (%)
        • Data Table on India - Year-over-year growth 2024-2029 (%)
      • 17.13 UK - Market size and forecast 2024-2029
        • Chart on UK - Market size and forecast 2024-2029 ($ billion)
        • Data Table on UK - Market size and forecast 2024-2029 ($ billion)
        • Chart on UK - Year-over-year growth 2024-2029 (%)
        • Data Table on UK - Year-over-year growth 2024-2029 (%)
      • 17.14 Japan - Market size and forecast 2024-2029
        • Chart on Japan - Market size and forecast 2024-2029 ($ billion)
        • Data Table on Japan - Market size and forecast 2024-2029 ($ billion)
        • Chart on Japan - Year-over-year growth 2024-2029 (%)
        • Data Table on Japan - Year-over-year growth 2024-2029 (%)
      • 17.15 Canada - Market size and forecast 2024-2029
        • Chart on Canada - Market size and forecast 2024-2029 ($ billion)
        • Data Table on Canada - Market size and forecast 2024-2029 ($ billion)
        • Chart on Canada - Year-over-year growth 2024-2029 (%)
        • Data Table on Canada - Year-over-year growth 2024-2029 (%)
      • 17.16 France - Market size and forecast 2024-2029
        • Chart on France - Market size and forecast 2024-2029 ($ billion)
        • Data Table on France - Market size and forecast 2024-2029 ($ billion)
        • Chart on France - Year-over-year growth 2024-2029 (%)
        • Data Table on France - Year-over-year growth 2024-2029 (%)
      • 17.17 Italy - Market size and forecast 2024-2029
        • Chart on Italy - Market size and forecast 2024-2029 ($ billion)
        • Data Table on Italy - Market size and forecast 2024-2029 ($ billion)
        • Chart on Italy - Year-over-year growth 2024-2029 (%)
        • Data Table on Italy - Year-over-year growth 2024-2029 (%)
      • 17.18 Market opportunity by geography
        • Market opportunity by geography ($ billion)
        • Data Tables on Market opportunity by geography ($ billion)
      • 17.19 Brazil - Market size and forecast (2024-2029)
        • Chart on Brazil - Market size and forecast (2024-2029) ($ billion)
        • Data Table on Brazil - Market size and forecast (2024-2029) ($ billion)
        • Chart on Brazil - Year-over-year growth (2024-2029) (%)
        • Data Table on Brazil - Year-over-year growth (2024-2029) (%)
      • 17.20 Egypt - Market size and forecast (2024-2029)
        • Chart on Egypt - Market size and forecast (2024-2029) ($ billion)
        • Data Table on Egypt - Market size and forecast (2024-2029) ($ billion)
        • Chart on Egypt - Year-over-year growth (2024-2029) (%)
        • Data Table on Egypt - Year-over-year growth (2024-2029) (%)
      • 17.21 UAE - Market size and forecast (2024-2029)
        • Chart on UAE - Market size and forecast (2024-2029) ($ billion)
        • Data Table on UAE - Market size and forecast (2024-2029) ($ billion)
        • Chart on UAE - Year-over-year growth (2024-2029) (%)
        • Data Table on UAE - Year-over-year growth (2024-2029) (%)
      • 17.22 Oman - Market size and forecast (2024-2029)
        • Chart on Oman - Market size and forecast (2024-2029) ($ billion)
        • Data Table on Oman - Market size and forecast (2024-2029) ($ billion)
        • Chart on Oman - Year-over-year growth (2024-2029) (%)
        • Data Table on Oman - Year-over-year growth (2024-2029) (%)
      • 17.23 Argentina - Market size and forecast (2024-2029)
        • Chart on Argentina - Market size and forecast (2024-2029) ($ billion)
        • Data Table on Argentina - Market size and forecast (2024-2029) ($ billion)
        • Chart on Argentina - Year-over-year growth (2024-2029) (%)
        • Data Table on Argentina - Year-over-year growth (2024-2029) (%)
      • 17.24 KSA - Market size and forecast (2024-2029)
        • Chart on KSA - Market size and forecast (2024-2029) ($ billion)
        • Data Table on KSA - Market size and forecast (2024-2029) ($ billion)
        • Chart on KSA - Year-over-year growth (2024-2029) (%)
        • Data Table on KSA - Year-over-year growth (2024-2029) (%)
      • 17.25 Rest of World (ROW) - Market size and forecast (2024-2029)
        • Chart on Rest of World (ROW) - Market size and forecast (2024-2029) ($ billion)
        • Data Table on Rest of World (ROW) - Market size and forecast (2024-2029) ($ billion)
        • Chart on Rest of World (ROW) - Year-over-year growth (2024-2029) (%)
        • Data Table on Rest of World (ROW) - Year-over-year growth (2024-2029) (%)

      18 Drivers, Challenges, and Opportunity/Restraints

      • 18.1 Market drivers
        • 18.2 Market challenges
          • 18.3 Impact of drivers and challenges
            • Impact of drivers and challenges in 2024 and 2029
          • 18.4 Market opportunities/restraints

            19 Competitive Landscape

            • 19.1 Overview
              • 19.2 Competitive Landscape
                • Overview on criticality of inputs and factors of differentiation
              • 19.3 Landscape disruption
                • Overview on factors of disruption
              • 19.4 Industry risks
                • Impact of key risks on business

              20 Competitive Analysis

              • 20.1 Companies profiled
                • Companies covered
              • 20.2 Market positioning of companies
                • Matrix on companies position and classification
              • 20.3 Apple Inc.
                • Apple Inc. - Overview
                • Apple Inc. - Product / Service
                • Apple Inc. - Key offerings
              • 20.4 Changhong
                • Changhong - Overview
                • Changhong - Product / Service
                • Changhong - Key offerings
              • 20.5 Funai Electric Co. Ltd.
                • Funai Electric Co. Ltd. - Overview
                • Funai Electric Co. Ltd. - Product / Service
                • Funai Electric Co. Ltd. - Key offerings
              • 20.6 Haier Smart Home Co. Ltd.
                • Haier Smart Home Co. Ltd. - Overview
                • Haier Smart Home Co. Ltd. - Product / Service
                • Haier Smart Home Co. Ltd. - Key offerings
              • 20.7 Hisense International Co. Ltd.
                • Hisense International Co. Ltd. - Overview
                • Hisense International Co. Ltd. - Product / Service
                • Hisense International Co. Ltd. - Key offerings
              • 20.8 Koninklijke Philips NV
                • Koninklijke Philips NV - Overview
                • Koninklijke Philips NV - Product / Service
                • Koninklijke Philips NV - Key offerings
              • 20.9 Konka Group Co. Ltd.
                • Konka Group Co. Ltd. - Overview
                • Konka Group Co. Ltd. - Product / Service
                • Konka Group Co. Ltd. - Key offerings
              • 20.10 LG Corp.
                • LG Corp. - Overview
                • LG Corp. - Product / Service
                • LG Corp. - Key offerings
              • 20.11 MIRC Electronics Ltd.
                • MIRC Electronics Ltd. - Overview
                • MIRC Electronics Ltd. - Product / Service
                • MIRC Electronics Ltd. - Key offerings
              • 20.12 Panasonic Holdings Corp.
                • Panasonic Holdings Corp. - Overview
                • Panasonic Holdings Corp. - Product / Service
                • Panasonic Holdings Corp. - Key offerings
              • 20.13 Roku Inc.
                • Roku Inc. - Overview
                • Roku Inc. - Product / Service
                • Roku Inc. - Key offerings
              • 20.14 Samsung Electronics Co. Ltd.
                • Samsung Electronics Co. Ltd. - Overview
                • Samsung Electronics Co. Ltd. - Product / Service
                • Samsung Electronics Co. Ltd. - Key offerings
              • 20.15 Sceptre Inc.
                • Sceptre Inc. - Overview
                • Sceptre Inc. - Product / Service
                • Sceptre Inc. - Key offerings
              • 20.16 Sharp Corp.
                • Sharp Corp. - Overview
                • Sharp Corp. - Product / Service
                • Sharp Corp. - Key offerings
              • 20.17 Skyworth Group Ltd.
                • Skyworth Group Ltd. - Overview
                • Skyworth Group Ltd. - Product / Service
                • Skyworth Group Ltd. - Key offerings
              • 20.18 Sony Group Corp.
                • Sony Group Corp. - Overview
                • Sony Group Corp. - Product / Service
                • Sony Group Corp. - Key offerings
              • 20.19 TCL Industries Holdings Co. Ltd.
                • TCL Industries Holdings Co. Ltd. - Overview
                • TCL Industries Holdings Co. Ltd. - Product / Service
                • TCL Industries Holdings Co. Ltd. - Key offerings
              • 20.20 Toshiba Corporation
                • Toshiba Corporation - Overview
                • Toshiba Corporation - Product / Service
                • Toshiba Corporation - Key offerings
              • 20.21 VIZIO Holding Corp.
                • VIZIO Holding Corp. - Overview
                • VIZIO Holding Corp. - Product / Service
                • VIZIO Holding Corp. - Key offerings
              • 20.22 Xiaomi Inc.
                • Xiaomi Inc. - Overview
                • Xiaomi Inc. - Product / Service
                • Xiaomi Inc. - Key offerings
              • 20.23 Apple Inc.
                • Apple Inc. - Overview
                • Apple Inc. - Product / Service
                • Apple Inc. - Key offerings
              • 20.24 Changhong
                • Changhong - Overview
                • Changhong - Product / Service
                • Changhong - Key offerings
              • 20.25 Funai Electric Co. Ltd.
                • Funai Electric Co. Ltd. - Overview
                • Funai Electric Co. Ltd. - Product / Service
                • Funai Electric Co. Ltd. - Key offerings
              • 20.26 Haier Smart Home Co. Ltd.
                • Haier Smart Home Co. Ltd. - Overview
                • Haier Smart Home Co. Ltd. - Product / Service
                • Haier Smart Home Co. Ltd. - Key offerings
              • 20.27 Hisense International Co. Ltd.
                • Hisense International Co. Ltd. - Overview
                • Hisense International Co. Ltd. - Product / Service
                • Hisense International Co. Ltd. - Key offerings
              • 20.28 Koninklijke Philips NV
                • Koninklijke Philips NV - Overview
                • Koninklijke Philips NV - Product / Service
                • Koninklijke Philips NV - Key offerings
              • 20.29 Konka Group Co. Ltd.
                • Konka Group Co. Ltd. - Overview
                • Konka Group Co. Ltd. - Product / Service
                • Konka Group Co. Ltd. - Key offerings
              • 20.30 LG Corp.
                • LG Corp. - Overview
                • LG Corp. - Product / Service
                • LG Corp. - Key offerings
              • 20.31 Micromax Informatics Ltd.
                • Micromax Informatics Ltd. - Overview
                • Micromax Informatics Ltd. - Product / Service
                • Micromax Informatics Ltd. - Key offerings
              • 20.32 MIRC Electronics Ltd.
                • MIRC Electronics Ltd. - Overview
                • MIRC Electronics Ltd. - Product / Service
                • MIRC Electronics Ltd. - Key offerings
              • 20.33 Panasonic Holdings Corp.
                • Panasonic Holdings Corp. - Overview
                • Panasonic Holdings Corp. - Product / Service
                • Panasonic Holdings Corp. - Key offerings
              • 20.34 Roku Inc.
                • Roku Inc. - Overview
                • Roku Inc. - Product / Service
                • Roku Inc. - Key offerings
              • 20.35 Samsung Electronics Co. Ltd.
                • Samsung Electronics Co. Ltd. - Overview
                • Samsung Electronics Co. Ltd. - Product / Service
                • Samsung Electronics Co. Ltd. - Key offerings
              • 20.36 Sceptre Inc.
                • Sceptre Inc. - Overview
                • Sceptre Inc. - Product / Service
                • Sceptre Inc. - Key offerings
              • 20.37 Sharp Corp.
                • Sharp Corp. - Overview
                • Sharp Corp. - Product / Service
                • Sharp Corp. - Key offerings
              • 20.38 Skyworth Group Ltd.
                • Skyworth Group Ltd. - Overview
                • Skyworth Group Ltd. - Product / Service
                • Skyworth Group Ltd. - Key offerings
              • 20.39 Sony Group Corp.
                • Sony Group Corp. - Overview
                • Sony Group Corp. - Product / Service
                • Sony Group Corp. - Key offerings
              • 20.40 TCL Industries Holdings Co. Ltd.
                • TCL Industries Holdings Co. Ltd. - Overview
                • TCL Industries Holdings Co. Ltd. - Product / Service
                • TCL Industries Holdings Co. Ltd. - Key offerings
              • 20.41 Toshiba Corporation
                • Toshiba Corporation - Overview
                • Toshiba Corporation - Product / Service
                • Toshiba Corporation - Key offerings
              • 20.42 VIZIO Holding Corp.
                • VIZIO Holding Corp. - Overview
                • VIZIO Holding Corp. - Product / Service
                • VIZIO Holding Corp. - Key offerings
              • 20.43 Xiaomi Inc.
                • Xiaomi Inc. - Overview
                • Xiaomi Inc. - Product / Service
                • Xiaomi Inc. - Key offerings

              21 Appendix

              • 21.1 Scope of the report
                • 21.2 Inclusions and exclusions checklist
                  • Inclusions checklist
                  • Exclusions checklist
                • 21.3 Currency conversion rates for US$
                  • Currency conversion rates for US$
                • 21.4 Research methodology
                  • Research methodology
                • 21.5 Data procurement
                  • Information sources
                • 21.6 Data validation
                  • Data validation
                • 21.7 Validation techniques employed for market sizing
                  • Validation techniques employed for market sizing
                • 21.8 Data synthesis
                  • Data synthesis
                • 21.9 360 degree market analysis
                  • 360 degree market analysis
                • 21.10 List of abbreviations
                  • List of abbreviations

                Research Methodology

                Technavio presents a detailed picture of the market by way of study, synthesis, and summation of data from multiple sources. The analysts have presented the various facets of the market with a particular focus on identifying the key industry influencers. The data thus presented is comprehensive, reliable, and the result of extensive research, both primary and secondary.

                INFORMATION SOURCES

                Primary sources

                • Manufacturers and suppliers
                • Channel partners
                • Industry experts
                • Strategic decision makers

                Secondary sources

                • Industry journals and periodicals
                • Government data
                • Financial reports of key industry players
                • Historical data
                • Press releases

                DATA ANALYSIS

                Data Synthesis

                • Collation of data
                • Estimation of key figures
                • Analysis of derived insights

                Data Validation

                • Triangulation with data models
                • Reference against proprietary databases
                • Corroboration with industry experts

                REPORT WRITING

                Qualitative

                • Market drivers
                • Market challenges
                • Market trends
                • Five forces analysis

                Quantitative

                • Market size and forecast
                • Market segmentation
                • Geographical insights
                • Competitive landscape

                Interested in this report?

                Get your sample now to see our research methodology and insights!

                Download Now

                Frequently Asked Questions

                Television market growth will increase by $ 73.1 bn during 2025-2029 .

                The Television market is expected to grow at a CAGR of 8.2% during 2025-2029 .

                Television market is segmented by Technology( UHD, HD) Display Size( Upto 43 inches, 55-64 inches, 48-50 inches, Greater than 65 inches, MEA)

                Apple Inc., Changhong, Funai Electric Co. Ltd., Haier Smart Home Co. Ltd., Hisense International Co. Ltd., Koninklijke Philips NV, Konka Group Co. Ltd., LG Corp., MIRC Electronics Ltd., Panasonic Holdings Corp., Roku Inc., Samsung Electronics Co. Ltd., Sceptre Inc., Sharp Corp., Skyworth Group Ltd., Sony Group Corp., TCL Industries Holdings Co. Ltd., Toshiba Corporation, VIZIO Holding Corp., Xiaomi Inc. are a few of the key vendors in the Television market.

                APAC will register the highest growth rate of 38% among the other regions. Therefore, the Television market in APAC is expected to garner significant business opportunities for the vendors during the forecast period.

                US, Canada, Germany, UK, Italy, France, China, India, Japan, Brazil, Egypt, UAE, Oman, Argentina, KSA, UAE, Brazil, Rest of World (ROW)

                • Product innovation and advances leading to portfolio extension and product premiumizationThe competition in the global television market has been getting more intense over the years. In addition is the driving factor this market.
                • the growing innovations and advances in technology have changed the demand and preferences of customers is the driving factor this market.
                • which has propelled the demand for innovative products. This has compelled the vendors operating in the global television market to continually engage in research and development and innovations to survive in the competitive market environment. The major product innovations introduced in the global television market are in terms of technology is the driving factor this market.
                • performance is the driving factor this market.
                • feature is the driving factor this market.
                • and design. In addition is the driving factor this market.
                • customers seek televisions that are capable of performing multiple tasks with minimal resources. To meet such evolving customer needs is the driving factor this market.
                • vendors are continuously widening their product portfolio as per the growing and varying consumer demand.In addition is the driving factor this market.
                • with the growing purchasing power and rising disposable income is the driving factor this market.
                • customers are gradually increasing their spending on consumer electronics products is the driving factor this market.
                • such as televisions. This has propelled the demand for premium televisions and led to the growth of the global television market. The increased demand for premium televisions has also attracted investments by vendors for innovating products and adopting new technologies that have a positive impact on the performance of televisions and for reforming the interior aesthetic appeal of televisions. Furthermore is the driving factor this market.
                • vendors are also offering products that are innovative and smart. These products are priced higher than traditional televisions. The growth in product premiumization and product line extension is the driving factor this market.
                • coupled with the growing customer expenditure on consumer electronics products is the driving factor this market.
                • will drive value sales in the global television market during the forecast period. is the driving factor this market.

                The Television market vendors should focus on grabbing business opportunities from the UHD segment as it accounted for the largest market share in the base year.