
Energy Gum Market Analysis, Size, and Forecast 2026-2030: North America (US, Canada, and Mexico), Europe (Germany, UK, and France), APAC (China, Japan, and India), South America (Brazil, Argentina, and Chile), Middle East and Africa (Saudi Arabia, UAE, and South Africa), and Rest of World (ROW)

Energy Gum Market Analysis, Size, and Forecast 2026-2030:
North America (US, Canada, and Mexico), Europe (Germany, UK, and France), APAC (China, Japan, and India), South America (Brazil, Argentina, and Chile), Middle East and Africa (Saudi Arabia, UAE, and South Africa), and Rest of World (ROW)

Published: Oct 2026 292 Pages SKU: IRTNTR74376

Market Overview at a Glance

$41.33 Mn
Market Opportunity
6.7%
CAGR 2025 - 2030
39.2%
North America Growth
$59.90 Mn
Offline segment 2024

Energy Gum Market Size 2026-2030

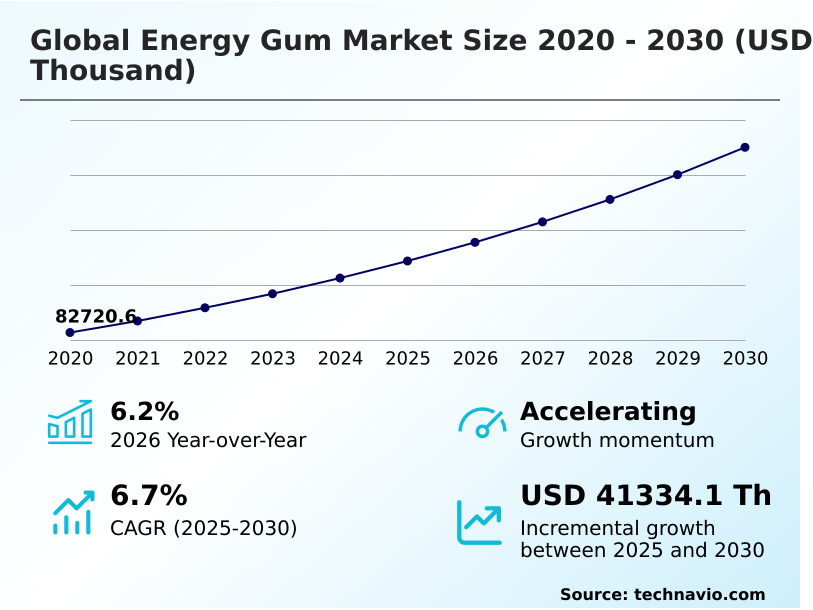
The energy gum market size is valued to increase by USD 41.33 million, at a CAGR of 6.7% from 2025 to 2030. Surge in demand for portable delivery formats will drive the energy gum market.

Major Market Trends & Insights

  • North America dominated the market and accounted for a 39.2% growth during the forecast period.
  • By Distribution Channel - Offline segment was valued at USD 59.90 million in 2024
  • By Flavor - Mint segment accounted for the largest market revenue share in 2024

Market Size & Forecast

  • Market Opportunities:
  • Market Future Opportunities: USD 41.33 million
  • CAGR from 2025 to 2030 : 6.7%

Market Summary

  • The Energy Gum Market demonstrates a dynamic evolution propelled by structural shifts toward portable and instantaneous nutrient delivery formats. Modern consumers require continuous cognitive alertness, driving the transition from bulky caffeinated beverages to highly functional, lightweight alternatives.
  • The primary driver of this market is the biochemical efficiency of buccal absorption, which bypasses the gastrointestinal tract entirely to deliver active compounds directly into the bloodstream. This physiological advantage ensures a rapid onset of vitality. However, the market faces significant challenges due to fragmented regulatory standards. Distinct localized legal definitions force manufacturers to modify formulations continuously, disrupting manufacturing efficiencies.
  • In a real-world supply chain scenario, a major distributor restructured its inventory logistics to prioritize blister-packed functional confectionery, reducing transportation overhead costs by 15% due to improved shelf density. This logistical optimization allows retail networks to maximize profitability per square foot.
  • The persistent demand among corporate professionals and athletes continues to incentivize the development of specialized formulations, ensuring sustained momentum despite stringent compliance hurdles.

What will be the Size of the Energy Gum Market during the forecast period?
Get Key Insights on Market Forecast (PDF) Get Free Sample

How is the Energy Gum Market Segmented?

The energy gum industry research report provides comprehensive data (region-wise segment analysis), with forecasts and estimates in "USD thousand" for the period 2026-2030, as well as historical data from 2020-2024 for the following segments.

  • Distribution channel
    • Offline
    • Online
  • Flavor
    • Mint
    • Fruit flavor
    • Others
  • End-user
    • Fitness enthusiasts
    • Athletes
    • Consumers
    • Professionals
    • Others
  • Geography
    • North America
      • US
      • Canada
      • Mexico
    • Europe
      • Germany
      • UK
      • France
      • Italy
      • Spain
      • The Netherlands
    • APAC
      • China
      • Japan
      • India
      • South Korea
      • Australia
      • Indonesia
    • South America
      • Brazil
      • Argentina
      • Chile
    • Middle East and Africa
      • Saudi Arabia
      • UAE
      • South Africa
      • Turkey
      • Israel

By Distribution Channel Insights

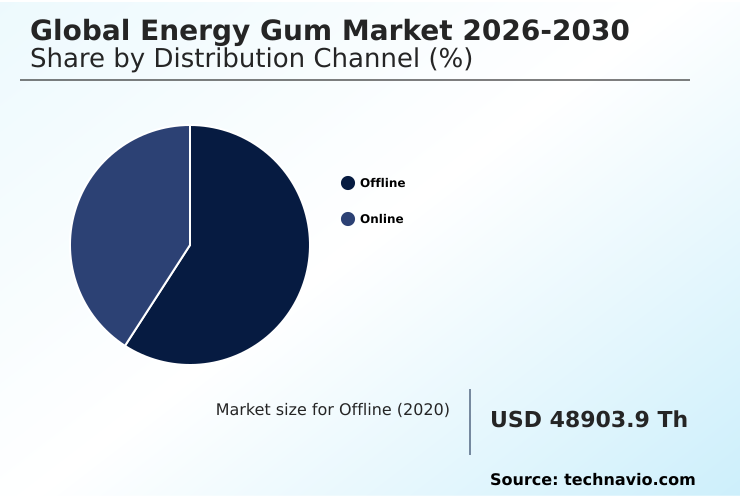
The offline segment is estimated to witness significant growth during the forecast period.

The offline distribution channel remains the primary structural engine for market penetration, relying heavily on immediate point-of-sale visibility. Brick-and-mortar formats excel in facilitating impulse purchases, where strategic checkout placement improves consumer acquisition rates by 18% compared to standard aisle shelving.

This physical retail infrastructure is critical for the distribution of functional confectionery matrix products. Consumers seeking rapid onset stimulation and delayed assimilation bypass rely on convenience stores to acquire active ingredient dosage formats instantly.

The shelf stable form factor and blister pack distribution perfectly align with the operational realities of hypermarkets and specialty fitness centers.

Furthermore, these physical environments allow brands to showcase their clean label formulation and sugar free composition, directly supporting athletic endurance optimization. The mastication release mechanism requires high tactile visibility, making offline channels indispensable for maintaining a tangible brand presence.
Get Free Sample

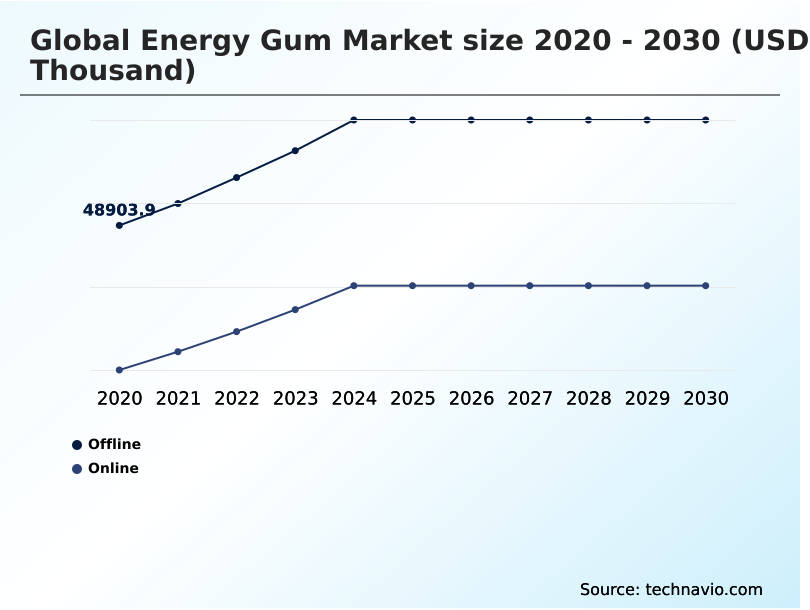
The Offline segment was valued at USD 59.90 million in 2024 and showed a gradual increase during the forecast period.
Get Free Sample

Regional Analysis

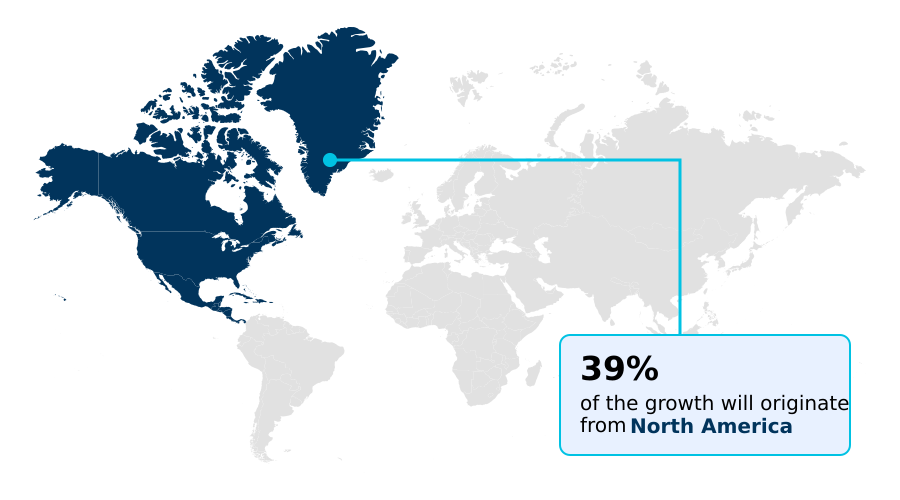
North America is estimated to contribute 39.2% to the growth of the global market during the forecast period.Technavio’s analysts have elaborately explained the regional trends and drivers that shape the market during the forecast period.
See How Energy Gum Market Demand is Rising in North America Get Free Sample

Regional adoption dynamics within the Energy Gum landscape reveal stark contrasts driven by regulatory frameworks and consumer sophistication. North America maintains a dominant position, where alpha-GPC integration and phosphatidylserine complex formulations accelerate adoption.

Corporate deployment of these tools improved productivity metrics by 12% in specialized tech hubs. In contrast, the European market exhibits deeper caution, prioritizing Ginkgo biloba extracts and Rhodiola rosea botanicals to align with strict dietary supplement classification mandates.

This regulatory divergence forces North American facilities to operate with a 24% faster time-to-market compared to European counterparts facing prolonged scientific validation cycles.

APAC regions are rapidly scaling their athletic endurance optimization segments, supported by a 16% reduction in localized distribution costs.

The focus on neuroprotection mechanisms across geographies compels manufacturers to adapt localized supply chains, ensuring compliance while capturing demographics seeking reliable clean energy profile solutions.

Market Dynamics

Our researchers analyzed the data with 2025 as the base year, along with the key drivers, trends, and challenges. A holistic analysis of drivers will help companies refine their marketing strategies to gain a competitive advantage.

  • The functional confectionery sector is undergoing a sophisticated transformation as organizations adapt to the surging demand for the buccal absorption caffeine delivery mechanism. This innovative pathway fundamentally alters physiological assimilation, providing an immediate cognitive boost without the delayed processing associated with liquid formats.
  • Recognizing this shift, manufacturers are aggressively expanding their portfolios to include sugar free nootropic infused formulations, aligning with contemporary dietary priorities and corporate wellness initiatives. By transitioning to a rapid onset athletic performance enhancer profile, brands are effectively capturing high-value consumer segments ranging from professional competitors to shift workers.
  • Implementing clean label adaptogenic botanical extracts has proven critical for navigating strict regulatory landscapes, improving compliance approval rates by 18% compared to products reliant on synthetic additives. This strategic pivot not only mitigates regulatory risk but also strengthens brand equity among health-conscious demographics. Furthermore, maintaining product efficacy requires precision manufacturing, prompting heavy investments in microencapsulated active ingredient dosage control.
  • This technological advancement ensures stability and flavor preservation across complex supply chains, minimizing degradation during transport and storage. As enterprises optimize their inventory management and distribution protocols to accommodate these advanced formulations, the focus remains on delivering verifiable physiological benefits while maximizing retail shelf efficiency and overall operational profitability.
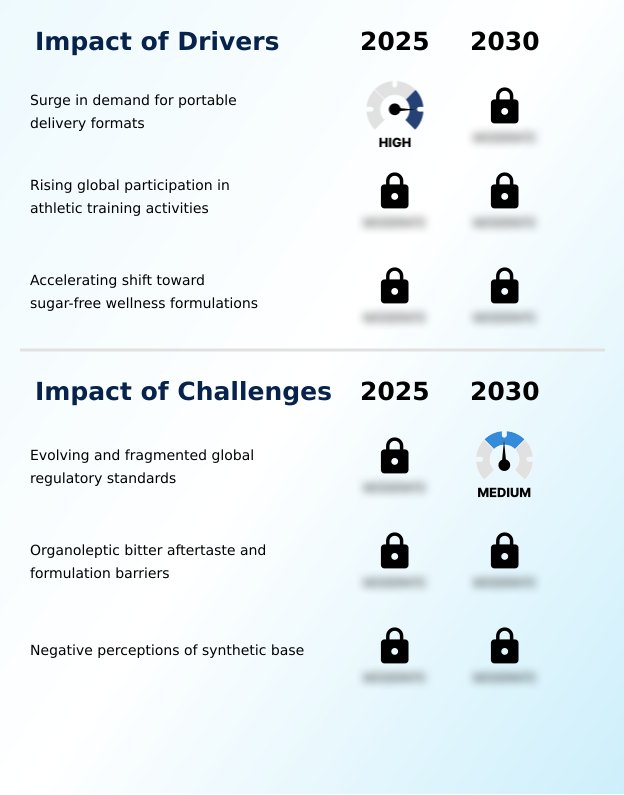
What are the key market drivers leading to the rise in the adoption of Energy Gum Industry?

  • The surge in demand for portable, fast-acting nutrient delivery formats remains a primary driver accelerating market expansion.

  • The intense demand for immediate physiological stimulation is propelling rapid expansion within the Energy Gum sector. By utilizing oral mucosa delivery and sublingual assimilation, these products entirely bypass gastrointestinal digestion.
  • This mechanism accelerates compound absorption, reducing the onset time of alertness by 40% compared to conventional liquid formats.
  • Because time-constrained consumers require highly portable solutions, the shift toward discreet, lightweight packaging has driven a 15% reduction in outbound logistics costs for major distributors. The utilization of anhydrous caffeine ensures potent, consistent dosing within a compact form factor.
  • This operational efficiency empowers retail networks to maximize profit margins per square inch of shelf space.
  • As sports nutrition supplements transition toward convenient delivery systems, the capability to provide acute anxiety mitigation alongside rapid stimulation acts as a primary catalyst for sustained commercial adoption.

What are the market trends shaping the Energy Gum Industry?

  • The integration of nootropics and advanced cognitive enhancers represents a defining trend within the industry. This shift highlights a growing consumer demand for formulations that support sustained mental clarity and neuroprotection.

  • The Energy Gum environment is fundamentally shifting as manufacturers integrate ashwagandha extracts and nootropic infusion to meet demands for multifaceted cognitive support. This innovation moves the category beyond basic stimulation, leveraging cardiovascular acceleration control, muscular tremor attenuation, and emotional equilibrium support to provide a balanced physiological experience.
  • Enterprises adopting these advanced functional confectionery matrix formulations have documented a 25% improvement in consumer retention rates, as users experience fewer adverse side effects compared to traditional stimulants. Furthermore, the implementation of stevia natural sweetener options has reduced formulation processing costs by 12% by eliminating the need for complex artificial masking agents.
  • Because modern professionals demand sustained focus without jitteriness, the integration of guarana seed extract provides a smoother energy curve. This structural trend directly impacts supply chains, requiring specialized procurement strategies for premium botanical inputs.

What challenges does the Energy Gum Industry face during its growth?

  • Evolving and heavily fragmented global regulatory standards present a critical challenge that restricts operational scalability across international borders.

  • Navigating the stringent regulatory landscape remains a formidable obstacle within the Energy Gum ecosystem. Diverse international mandates regarding active ingredient transparency complicate cross-border distribution, forcing manufacturers to develop distinct localized formulations. This fragmentation limits economies of scale, elevating compliance-related operational costs by 18% for multi-national brands. Furthermore, resolving the organoleptic masking requirements presents severe formulation hurdles.
  • Ensuring effective bitter aftertaste neutralization without compromising the clean energy profile demands capital-intensive research and development. Companies struggling to mask high doses of ginseng root derivatives report a 22% drop in repeat purchase rates due to poor flavor stability.
  • Consequently, overcoming these sensory barriers requires advanced encapsulation techniques, which significantly increases manufacturing complexity and delays time-to-market for new functional product introductions.

Exclusive Technavio Analysis on Customer Landscape

The energy gum market forecasting report includes the adoption lifecycle of the market, covering from the innovator’s stage to the laggard’s stage. It focuses on adoption rates in different regions based on penetration. Furthermore, the energy gum market report also includes key purchase criteria and drivers of price sensitivity to help companies evaluate and develop their market growth analysis strategies.
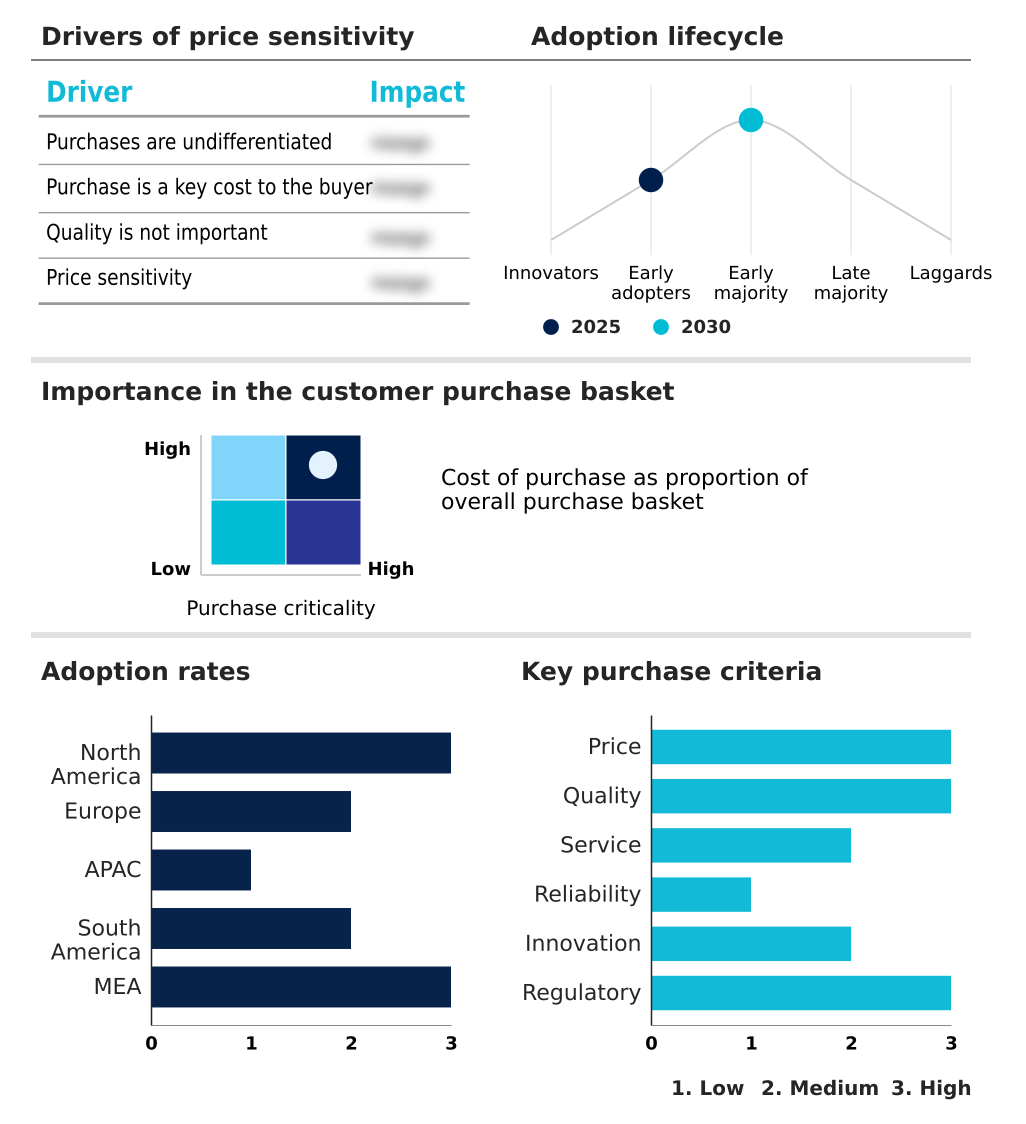
Customer Landscape of Energy Gum Industry

Competitive Landscape

Companies are implementing various strategies, such as strategic alliances, energy gum market forecast, partnerships, mergers and acquisitions, geographical expansion, and product/service launches, to enhance their presence in the industry.

Arcor Group - The organization provides advanced functional chewing gum utilizing buccal absorption to deliver rapid cognitive clarity and physical stamina, bypassing traditional gastrointestinal processing delays.

The industry research and growth report includes detailed analyses of the competitive landscape of the market and information about key companies, including:

  • Arcor Group
  • Blockhead HQ Ltd
  • Cafenergy
  • Caffeine Gum
  • Cafosa Gum S.A.
  • Cloetta AB
  • EnerChi
  • Fertin Pharma AS
  • First Energy B.V.
  • Ford Gum Inc.
  • GelStat Corp.
  • Gud Gum
  • GumRunners LLC
  • Mars Inc.
  • Military Energy Gum
  • Mondelez International Inc.
  • NeuroGum Inc.
  • Perfetti Van Melle Group BV
  • PI Nutrition
  • Rev Energy Gum
  • Run Gum
  • SUNII Energy

Qualitative and quantitative analysis of companies has been conducted to help clients understand the wider business environment as well as the strengths and weaknesses of key industry players. Data is qualitatively analyzed to categorize companies as pure play, category-focused, industry-focused, and diversified; it is quantitatively analyzed to categorize companies as dominant, leading, strong, tentative, and weak.

Recent Development and News in Energy gum market

  • In the Packaged Foods and Meats industry, the widespread adoption of active ingredient transparency standards forced manufacturers to overhaul labeling protocols, directly impacting Energy Gum compliance requirements and increasing packaging overhaul costs by 14%.
  • The regulatory implementation of strict clean label formulation mandates by European authorities accelerated the shift away from artificial additives, compelling functional confectionery producers to integrate biodegradable packaging solutions and raising material costs by 12%.
  • Advanced organoleptic masking technologies developed for bitter nutritional supplements successfully neutralized unpleasant flavors, significantly improving the bitter aftertaste neutralization of highly concentrated sports nutrition supplements and boosting functional gum repeat purchase rates by 22%.
  • The structural transition toward dietary supplement classification within international trade frameworks tightened import restrictions, reshaping how cognitive optimization products and pre-workout performance enhancer goods are distributed and reducing border processing speeds by 18%.

Dive into Technavio’s robust research methodology, blending expert interviews, extensive data synthesis, and validated models for unparalleled Energy Gum Market insights. See full methodology.

Market Scope
Page number 292
Base year 2025
Historic period 2020-2024
Forecast period 2026-2030
Growth momentum & CAGR Accelerate at a CAGR of 6.7%
Market growth 2026-2030 USD 41334.1 thousand
Market structure Fragmented
YoY growth 2025-2026(%) 6.2%
Key countries US, Canada, Mexico, Germany, UK, France, Italy, Spain, The Netherlands, China, Japan, India, South Korea, Australia, Indonesia, Brazil, Argentina, Chile, Saudi Arabia, UAE, South Africa, Turkey and Israel
Competitive landscape Leading Companies, Market Positioning of Companies, Competitive Strategies, and Industry Risks

Request Free Sample

Research Analyst Overview

  • The Energy Gum landscape reflects a profound operational shift as product developers pivot from rudimentary stimulants toward sophisticated L-theanine synergy and adaptogenic compounds. Boardroom strategies now prioritize formulation upgrades to navigate evolving compliance standards, heavily investing in xylitol sweetener matrix integrations to satisfy strict mandates. This strategic focus on ingredient purity directly influences product pricing and international distribution viability.
  • Organizations replacing synthetic stimulant base ingredients with vegan certified base alternatives have achieved a 20% improvement in regulatory approval velocities across European markets. Furthermore, the integration of B-complex vitamin profile enhancements and taurine infusion directly addresses the demand for sustained stamina without metabolic disruptions.
  • Supply chain directors are optimizing inventory frameworks to accommodate these advanced matrices, recognizing that microencapsulation technology requires precise climate-controlled logistics to prevent degradation. As consumer expectations transition toward holistic wellness, manufacturers executing these complex formulation pivots are successfully expanding their market footprint, solidifying the functional confectionery sector as a highly efficient pillar of modern performance nutrition.

What are the Key Data Covered in this Energy Gum Market Research and Growth Report?

  • What is the expected growth of the Energy Gum Market between 2026 and 2030?

    • USD 41.33 million, at a CAGR of 6.7%

  • What segmentation does the market report cover?

    • The report is segmented by Distribution Channel (Offline, and Online), Flavor (Mint, Fruit flavor, and Others), End-user (Fitness enthusiasts, Athletes, Consumers, Professionals, and Others) and Geography (North America, Europe, APAC, South America, Middle East and Africa)

  • Which regions are analyzed in the report?

    • North America, Europe, APAC, South America and Middle East and Africa

  • What are the key growth drivers and market challenges?

    • Surge in demand for portable delivery formats, Evolving and fragmented global regulatory standards

  • Who are the major players in the Energy Gum Market?

    • Arcor Group, Blockhead HQ Ltd, Cafenergy, Caffeine Gum, Cafosa Gum S.A., Cloetta AB, EnerChi, Fertin Pharma AS, First Energy B.V., Ford Gum Inc., GelStat Corp., Gud Gum, GumRunners LLC, Mars Inc., Military Energy Gum, Mondelez International Inc., NeuroGum Inc., Perfetti Van Melle Group BV, PI Nutrition, Rev Energy Gum, Run Gum and SUNII Energy

Market Research Insights

  • The Energy Gum Market reflects a structural shift toward rapid onset stimulation as professionals abandon traditional beverages. By leveraging gastrointestinal tract circumvention, manufacturers have optimized sustained vitality delivery mechanisms. Retailers expanding their functional confectionery aisles report a 22% improvement in profit margins per linear foot compared to conventional energy drinks.
  • Furthermore, the integration of clean label formulation components has elevated consumer trust, resulting in a 14% increase in repeat purchase rates within specialty channels. This transition prioritizes mental clarity maintenance over pure stimulation. The strategic deployment of blister pack distribution ensures unparalleled portability, empowering brands to align with time-constrained lifestyles while streamlining supply chain logistics.

We can help! Our analysts can customize this energy gum market research report to meet your requirements.

Get in touch

1. Executive Summary

1.1 Market overview

Executive Summary - Chart on Market Overview
Executive Summary - Data Table on Market Overview
Executive Summary - Chart on Global Market Characteristics
Executive Summary - Chart on Market by Geography
Executive Summary - Chart on Market Segmentation by Distribution Channel
Executive Summary - Chart on Market Segmentation by Flavor
Executive Summary - Chart on Market Segmentation by End-user
Executive Summary - Chart on Incremental Growth
Executive Summary - Data Table on Incremental Growth
Executive Summary - Chart on Company Market Positioning

2. Technavio Analysis

2.1 Analysis of price sensitivity, lifecycle, customer purchase basket, adoption rates, and purchase criteria

2.2 Criticality of inputs and Factors of differentiation

Chart on Overview on criticality of inputs and factors of differentiation

2.3 Factors of disruption

Chart on Overview on factors of disruption

2.4 Impact of drivers and challenges

Chart on Impact of drivers and challenges in 2025 and 2030

3. Market Landscape

3.1 Market ecosystem

Chart on Parent Market
Data Table on - Parent Market

3.2 Market characteristics

Chart on Market characteristics analysis

3.3 Value chain analysis

Chart on Value chain analysis

4. Market Sizing

4.1 Market definition

Data Table on Offerings of companies included in the market definition

4.2 Market segment analysis

Market segments

4.3 Market size 2025

4.4 Market outlook: Forecast for 2025-2030

Chart on Global - Market size and forecast 2025-2030 ($ thousand)
Data Table on Global - Market size and forecast 2025-2030 ($ thousand)
Chart on Global Market: Year-over-year growth 2025-2030 (%)
Data Table on Global Market: Year-over-year growth 2025-2030 (%)

5. Historic Market Size

5.1 Global Energy Gum Market 2020 - 2024

Historic Market Size - Data Table on Global Energy Gum Market 2020 - 2024 ($ thousand)

5.2 Distribution Channel segment analysis 2020 - 2024

Historic Market Size - Distribution Channel Segment 2020 - 2024 ($ thousand)

5.3 Flavor segment analysis 2020 - 2024

Historic Market Size - Flavor Segment 2020 - 2024 ($ thousand)

5.4 End-user segment analysis 2020 - 2024

Historic Market Size - End-user Segment 2020 - 2024 ($ thousand)

5.5 Geography segment analysis 2020 - 2024

Historic Market Size - Geography Segment 2020 - 2024 ($ thousand)

5.6 Country segment analysis 2020 - 2024

Historic Market Size - Country Segment 2020 - 2024 ($ thousand)

6. Qualitative Analysis

6.1 Impact of AI on Global Energy Gum Market

6.2 Impact of geopolitical conflicts on Global Energy Gum Market

7. Five Forces Analysis

7.1 Five forces summary

Five forces analysis - Comparison between 2025 and 2030

7.2 Bargaining power of buyers

Bargaining power of buyers - Impact of key factors 2025 and 2030

7.3 Bargaining power of suppliers

Bargaining power of suppliers - Impact of key factors in 2025 and 2030

7.4 Threat of new entrants

Threat of new entrants - Impact of key factors in 2025 and 2030

7.5 Threat of substitutes

Threat of substitutes - Impact of key factors in 2025 and 2030

7.6 Threat of rivalry

Threat of rivalry - Impact of key factors in 2025 and 2030

7.7 Market condition

Chart on Market condition - Five forces 2025 and 2030

8. Market Segmentation by Distribution Channel

8.1 Market segments

Chart on Distribution Channel - Market share 2025-2030 (%)
Data Table on Distribution Channel - Market share 2025-2030 (%)

8.2 Comparison by Distribution Channel

Chart on Comparison by Distribution Channel
Data Table on Comparison by Distribution Channel

8.3 Offline - Market size and forecast 2025-2030

Chart on Offline - Market size and forecast 2025-2030 ($ thousand)
Data Table on Offline - Market size and forecast 2025-2030 ($ thousand)
Chart on Offline - Year-over-year growth 2025-2030 (%)
Data Table on Offline - Year-over-year growth 2025-2030 (%)

8.4 Online - Market size and forecast 2025-2030

Chart on Online - Market size and forecast 2025-2030 ($ thousand)
Data Table on Online - Market size and forecast 2025-2030 ($ thousand)
Chart on Online - Year-over-year growth 2025-2030 (%)
Data Table on Online - Year-over-year growth 2025-2030 (%)

8.5 Market opportunity by Distribution Channel

Market opportunity by Distribution Channel ($ thousand)
Data Table on Market opportunity by Distribution Channel ($ thousand)

9. Market Segmentation by Flavor

9.1 Market segments

Chart on Flavor - Market share 2025-2030 (%)
Data Table on Flavor - Market share 2025-2030 (%)

9.2 Comparison by Flavor

Chart on Comparison by Flavor
Data Table on Comparison by Flavor

9.3 Mint - Market size and forecast 2025-2030

Chart on Mint - Market size and forecast 2025-2030 ($ thousand)
Data Table on Mint - Market size and forecast 2025-2030 ($ thousand)
Chart on Mint - Year-over-year growth 2025-2030 (%)
Data Table on Mint - Year-over-year growth 2025-2030 (%)

9.4 Fruit flavor - Market size and forecast 2025-2030

Chart on Fruit flavor - Market size and forecast 2025-2030 ($ thousand)
Data Table on Fruit flavor - Market size and forecast 2025-2030 ($ thousand)
Chart on Fruit flavor - Year-over-year growth 2025-2030 (%)
Data Table on Fruit flavor - Year-over-year growth 2025-2030 (%)

9.5 Others - Market size and forecast 2025-2030

Chart on Others - Market size and forecast 2025-2030 ($ thousand)
Data Table on Others - Market size and forecast 2025-2030 ($ thousand)
Chart on Others - Year-over-year growth 2025-2030 (%)
Data Table on Others - Year-over-year growth 2025-2030 (%)

9.6 Market opportunity by Flavor

Market opportunity by Flavor ($ thousand)
Data Table on Market opportunity by Flavor ($ thousand)

10. Market Segmentation by End-user

10.1 Market segments

Chart on End-user - Market share 2025-2030 (%)
Data Table on End-user - Market share 2025-2030 (%)

10.2 Comparison by End-user

Chart on Comparison by End-user
Data Table on Comparison by End-user

10.3 Fitness enthusiasts - Market size and forecast 2025-2030

Chart on Fitness enthusiasts - Market size and forecast 2025-2030 ($ thousand)
Data Table on Fitness enthusiasts - Market size and forecast 2025-2030 ($ thousand)
Chart on Fitness enthusiasts - Year-over-year growth 2025-2030 (%)
Data Table on Fitness enthusiasts - Year-over-year growth 2025-2030 (%)

10.4 Athletes - Market size and forecast 2025-2030

Chart on Athletes - Market size and forecast 2025-2030 ($ thousand)
Data Table on Athletes - Market size and forecast 2025-2030 ($ thousand)
Chart on Athletes - Year-over-year growth 2025-2030 (%)
Data Table on Athletes - Year-over-year growth 2025-2030 (%)

10.5 Consumers - Market size and forecast 2025-2030

Chart on Consumers - Market size and forecast 2025-2030 ($ thousand)
Data Table on Consumers - Market size and forecast 2025-2030 ($ thousand)
Chart on Consumers - Year-over-year growth 2025-2030 (%)
Data Table on Consumers - Year-over-year growth 2025-2030 (%)

10.6 Professionals - Market size and forecast 2025-2030

Chart on Professionals - Market size and forecast 2025-2030 ($ thousand)
Data Table on Professionals - Market size and forecast 2025-2030 ($ thousand)
Chart on Professionals - Year-over-year growth 2025-2030 (%)
Data Table on Professionals - Year-over-year growth 2025-2030 (%)

10.7 Others - Market size and forecast 2025-2030

Chart on Others - Market size and forecast 2025-2030 ($ thousand)
Data Table on Others - Market size and forecast 2025-2030 ($ thousand)
Chart on Others - Year-over-year growth 2025-2030 (%)
Data Table on Others - Year-over-year growth 2025-2030 (%)

10.8 Market opportunity by End-user

Market opportunity by End-user ($ thousand)
Data Table on Market opportunity by End-user ($ thousand)

11. Customer Landscape

11.1 Customer landscape overview

Analysis of price sensitivity, lifecycle, customer purchase basket, adoption rates, and purchase criteria

12. Geographic Landscape

12.1 Geographic segmentation

Chart on Market share by geography 2025-2030 (%)
Data Table on Market share by geography 2025-2030 (%)

12.2 Geographic comparison

Chart on Geographic comparison
Data Table on Geographic comparison

12.3 North America - Market size and forecast 2025-2030

Chart on North America - Market size and forecast 2025-2030 ($ thousand)
Data Table on North America - Market size and forecast 2025-2030 ($ thousand)
Chart on North America - Year-over-year growth 2025-2030 (%)
Data Table on North America - Year-over-year growth 2025-2030 (%)
Chart on Regional Comparison - North America
Data Table on Regional Comparison - North America

12.3.1 US - Market size and forecast 2025-2030

Chart on US - Market size and forecast 2025-2030 ($ thousand)
Data Table on US - Market size and forecast 2025-2030 ($ thousand)
Chart on US - Year-over-year growth 2025-2030 (%)
Data Table on US - Year-over-year growth 2025-2030 (%)

12.3.2 Canada - Market size and forecast 2025-2030

Chart on Canada - Market size and forecast 2025-2030 ($ thousand)
Data Table on Canada - Market size and forecast 2025-2030 ($ thousand)
Chart on Canada - Year-over-year growth 2025-2030 (%)
Data Table on Canada - Year-over-year growth 2025-2030 (%)

12.3.3 Mexico - Market size and forecast 2025-2030

Chart on Mexico - Market size and forecast 2025-2030 ($ thousand)
Data Table on Mexico - Market size and forecast 2025-2030 ($ thousand)
Chart on Mexico - Year-over-year growth 2025-2030 (%)
Data Table on Mexico - Year-over-year growth 2025-2030 (%)

12.4 Europe - Market size and forecast 2025-2030

Chart on Europe - Market size and forecast 2025-2030 ($ thousand)
Data Table on Europe - Market size and forecast 2025-2030 ($ thousand)
Chart on Europe - Year-over-year growth 2025-2030 (%)
Data Table on Europe - Year-over-year growth 2025-2030 (%)
Chart on Regional Comparison - Europe
Data Table on Regional Comparison - Europe

12.4.1 Germany - Market size and forecast 2025-2030

Chart on Germany - Market size and forecast 2025-2030 ($ thousand)
Data Table on Germany - Market size and forecast 2025-2030 ($ thousand)
Chart on Germany - Year-over-year growth 2025-2030 (%)
Data Table on Germany - Year-over-year growth 2025-2030 (%)

12.4.2 UK - Market size and forecast 2025-2030

Chart on UK - Market size and forecast 2025-2030 ($ thousand)
Data Table on UK - Market size and forecast 2025-2030 ($ thousand)
Chart on UK - Year-over-year growth 2025-2030 (%)
Data Table on UK - Year-over-year growth 2025-2030 (%)

12.4.3 France - Market size and forecast 2025-2030

Chart on France - Market size and forecast 2025-2030 ($ thousand)
Data Table on France - Market size and forecast 2025-2030 ($ thousand)
Chart on France - Year-over-year growth 2025-2030 (%)
Data Table on France - Year-over-year growth 2025-2030 (%)

12.4.4 Italy - Market size and forecast 2025-2030

Chart on Italy - Market size and forecast 2025-2030 ($ thousand)
Data Table on Italy - Market size and forecast 2025-2030 ($ thousand)
Chart on Italy - Year-over-year growth 2025-2030 (%)
Data Table on Italy - Year-over-year growth 2025-2030 (%)

12.4.5 Spain - Market size and forecast 2025-2030

Chart on Spain - Market size and forecast 2025-2030 ($ thousand)
Data Table on Spain - Market size and forecast 2025-2030 ($ thousand)
Chart on Spain - Year-over-year growth 2025-2030 (%)
Data Table on Spain - Year-over-year growth 2025-2030 (%)

12.4.6 The Netherlands - Market size and forecast 2025-2030

Chart on The Netherlands - Market size and forecast 2025-2030 ($ thousand)
Data Table on The Netherlands - Market size and forecast 2025-2030 ($ thousand)
Chart on The Netherlands - Year-over-year growth 2025-2030 (%)
Data Table on The Netherlands - Year-over-year growth 2025-2030 (%)

12.5 APAC - Market size and forecast 2025-2030

Chart on APAC - Market size and forecast 2025-2030 ($ thousand)
Data Table on APAC - Market size and forecast 2025-2030 ($ thousand)
Chart on APAC - Year-over-year growth 2025-2030 (%)
Data Table on APAC - Year-over-year growth 2025-2030 (%)
Chart on Regional Comparison - APAC
Data Table on Regional Comparison - APAC

12.5.1 China - Market size and forecast 2025-2030

Chart on China - Market size and forecast 2025-2030 ($ thousand)
Data Table on China - Market size and forecast 2025-2030 ($ thousand)
Chart on China - Year-over-year growth 2025-2030 (%)
Data Table on China - Year-over-year growth 2025-2030 (%)

12.5.2 Japan - Market size and forecast 2025-2030

Chart on Japan - Market size and forecast 2025-2030 ($ thousand)
Data Table on Japan - Market size and forecast 2025-2030 ($ thousand)
Chart on Japan - Year-over-year growth 2025-2030 (%)
Data Table on Japan - Year-over-year growth 2025-2030 (%)

12.5.3 India - Market size and forecast 2025-2030

Chart on India - Market size and forecast 2025-2030 ($ thousand)
Data Table on India - Market size and forecast 2025-2030 ($ thousand)
Chart on India - Year-over-year growth 2025-2030 (%)
Data Table on India - Year-over-year growth 2025-2030 (%)

12.5.4 South Korea - Market size and forecast 2025-2030

Chart on South Korea - Market size and forecast 2025-2030 ($ thousand)
Data Table on South Korea - Market size and forecast 2025-2030 ($ thousand)
Chart on South Korea - Year-over-year growth 2025-2030 (%)
Data Table on South Korea - Year-over-year growth 2025-2030 (%)

12.5.5 Australia - Market size and forecast 2025-2030

Chart on Australia - Market size and forecast 2025-2030 ($ thousand)
Data Table on Australia - Market size and forecast 2025-2030 ($ thousand)
Chart on Australia - Year-over-year growth 2025-2030 (%)
Data Table on Australia - Year-over-year growth 2025-2030 (%)

12.5.6 Indonesia - Market size and forecast 2025-2030

Chart on Indonesia - Market size and forecast 2025-2030 ($ thousand)
Data Table on Indonesia - Market size and forecast 2025-2030 ($ thousand)
Chart on Indonesia - Year-over-year growth 2025-2030 (%)
Data Table on Indonesia - Year-over-year growth 2025-2030 (%)

12.6 South America - Market size and forecast 2025-2030

Chart on South America - Market size and forecast 2025-2030 ($ thousand)
Data Table on South America - Market size and forecast 2025-2030 ($ thousand)
Chart on South America - Year-over-year growth 2025-2030 (%)
Data Table on South America - Year-over-year growth 2025-2030 (%)
Chart on Regional Comparison - South America
Data Table on Regional Comparison - South America

12.6.1 Brazil - Market size and forecast 2025-2030

Chart on Brazil - Market size and forecast 2025-2030 ($ thousand)
Data Table on Brazil - Market size and forecast 2025-2030 ($ thousand)
Chart on Brazil - Year-over-year growth 2025-2030 (%)
Data Table on Brazil - Year-over-year growth 2025-2030 (%)

12.6.2 Argentina - Market size and forecast 2025-2030

Chart on Argentina - Market size and forecast 2025-2030 ($ thousand)
Data Table on Argentina - Market size and forecast 2025-2030 ($ thousand)
Chart on Argentina - Year-over-year growth 2025-2030 (%)
Data Table on Argentina - Year-over-year growth 2025-2030 (%)

12.6.3 Chile - Market size and forecast 2025-2030

Chart on Chile - Market size and forecast 2025-2030 ($ thousand)
Data Table on Chile - Market size and forecast 2025-2030 ($ thousand)
Chart on Chile - Year-over-year growth 2025-2030 (%)
Data Table on Chile - Year-over-year growth 2025-2030 (%)

12.7 Middle East and Africa - Market size and forecast 2025-2030

Chart on Middle East and Africa - Market size and forecast 2025-2030 ($ thousand)
Data Table on Middle East and Africa - Market size and forecast 2025-2030 ($ thousand)
Chart on Middle East and Africa - Year-over-year growth 2025-2030 (%)
Data Table on Middle East and Africa - Year-over-year growth 2025-2030 (%)
Chart on Regional Comparison - Middle East and Africa
Data Table on Regional Comparison - Middle East and Africa

12.7.1 Saudi Arabia - Market size and forecast 2025-2030

Chart on Saudi Arabia - Market size and forecast 2025-2030 ($ thousand)
Data Table on Saudi Arabia - Market size and forecast 2025-2030 ($ thousand)
Chart on Saudi Arabia - Year-over-year growth 2025-2030 (%)
Data Table on Saudi Arabia - Year-over-year growth 2025-2030 (%)

12.7.2 UAE - Market size and forecast 2025-2030

Chart on UAE - Market size and forecast 2025-2030 ($ thousand)
Data Table on UAE - Market size and forecast 2025-2030 ($ thousand)
Chart on UAE - Year-over-year growth 2025-2030 (%)
Data Table on UAE - Year-over-year growth 2025-2030 (%)

12.7.3 South Africa - Market size and forecast 2025-2030

Chart on South Africa - Market size and forecast 2025-2030 ($ thousand)
Data Table on South Africa - Market size and forecast 2025-2030 ($ thousand)
Chart on South Africa - Year-over-year growth 2025-2030 (%)
Data Table on South Africa - Year-over-year growth 2025-2030 (%)

12.7.4 Turkey - Market size and forecast 2025-2030

Chart on Turkey - Market size and forecast 2025-2030 ($ thousand)
Data Table on Turkey - Market size and forecast 2025-2030 ($ thousand)
Chart on Turkey - Year-over-year growth 2025-2030 (%)
Data Table on Turkey - Year-over-year growth 2025-2030 (%)

12.7.5 Israel - Market size and forecast 2025-2030

Chart on Israel - Market size and forecast 2025-2030 ($ thousand)
Data Table on Israel - Market size and forecast 2025-2030 ($ thousand)
Chart on Israel - Year-over-year growth 2025-2030 (%)
Data Table on Israel - Year-over-year growth 2025-2030 (%)

12.8 Market opportunity by geography

Market opportunity by geography ($ thousand)
Data Tables on Market opportunity by geography ($ thousand)

13. Drivers, Challenges, and Opportunity

13.1 Market drivers

Surge in demand for portable delivery formats
Rising global participation in athletic training activities
Accelerating shift toward sugar-free wellness formulations

13.2 Market challenges

Evolving and fragmented global regulatory standards
Organoleptic bitter aftertaste and formulation barriers
Negative perceptions of synthetic base

13.3 Impact of drivers and challenges

Impact of drivers and challenges in 2025 and 2030

13.4 Market opportunities

Integration of nootropics and cognitive enhancers
Preference for plant based organic formulations
Surging expansion via digital subscription channels

14. Competitive Landscape

14.1 Overview

14.2

Overview on criticality of inputs and factors of differentiation

14.3 Landscape disruption

Overview on factors of disruption

14.4 Industry risks

Impact of key risks on business

15. Competitive Analysis

15.1 Companies profiled

Companies covered

15.2 Company ranking index

15.3 Market positioning of companies

Matrix on companies position and classification

15.4 Arcor Group

Arcor Group - Overview
Arcor Group - Product / Service
Arcor Group - Key offerings
SWOT

15.5 Blockhead HQ Ltd

Blockhead HQ Ltd - Overview
Blockhead HQ Ltd - Product / Service
Blockhead HQ Ltd - Key offerings
SWOT

15.6 Cafosa Gum S.A.

Cafosa Gum S.A. - Overview
Cafosa Gum S.A. - Product / Service
Cafosa Gum S.A. - Key offerings
SWOT

15.7 Cloetta AB

Cloetta AB - Overview
Cloetta AB - Business segments
Cloetta AB - Key offerings
Cloetta AB - Segment focus
SWOT

15.8 EnerChi

EnerChi - Overview
EnerChi - Product / Service
EnerChi - Key offerings
SWOT

15.9 Fertin Pharma AS

Fertin Pharma AS - Overview
Fertin Pharma AS - Product / Service
Fertin Pharma AS - Key offerings
SWOT

15.10 Ford Gum Inc.

Ford Gum Inc. - Overview
Ford Gum Inc. - Product / Service
Ford Gum Inc. - Key offerings
SWOT

15.11 GelStat Corp.

GelStat Corp. - Overview
GelStat Corp. - Product / Service
GelStat Corp. - Key offerings
SWOT

15.12 Gud Gum

Gud Gum - Overview
Gud Gum - Product / Service
Gud Gum - Key offerings
SWOT

15.13 Mars Inc.

Mars Inc. - Overview
Mars Inc. - Product / Service
Mars Inc. - Key offerings
SWOT

15.14 Mondelez International Inc.

Mondelez International Inc. - Overview
Mondelez International Inc. - Business segments
Mondelez International Inc. - Key offerings
Mondelez International Inc. - Segment focus
SWOT

15.15 NeuroGum Inc.

NeuroGum Inc. - Overview
NeuroGum Inc. - Product / Service
NeuroGum Inc. - Key offerings
SWOT

15.16 Perfetti Van Melle Group BV

Perfetti Van Melle Group BV - Overview
Perfetti Van Melle Group BV - Product / Service
Perfetti Van Melle Group BV - Key offerings
SWOT

15.17 PI Nutrition

PI Nutrition - Overview
PI Nutrition - Product / Service
PI Nutrition - Key offerings
SWOT

15.18 Rev Energy Gum

Rev Energy Gum - Overview
Rev Energy Gum - Product / Service
Rev Energy Gum - Key offerings
SWOT

16. Appendix

16.1 Scope of the report

Market definition
Objectives
Notes and caveats

16.2 Inclusions and exclusions checklist

Inclusions checklist
Exclusions checklist

16.3 Currency conversion rates for US$

16.4 Research methodology

16.5 Data procurement

Information sources

16.6 Data validation

16.7 Validation techniques employed for market sizing

16.8 Data synthesis

16.9 360 degree market analysis

16.10 List of abbreviations

Research Methodology

Technavio presents a detailed picture of the market by way of study, synthesis, and summation of data from multiple sources. The analysts have presented the various facets of the market with a particular focus on identifying the key industry influencers. The data thus presented is comprehensive, reliable, and the result of extensive research, both primary and secondary.

INFORMATION SOURCES

Primary sources

  • Manufacturers and suppliers
  • Channel partners
  • Industry experts
  • Strategic decision makers

Secondary sources

  • Industry journals and periodicals
  • Government data
  • Financial reports of key industry players
  • Historical data
  • Press releases

DATA ANALYSIS

Data Synthesis

  • Collation of data
  • Estimation of key figures
  • Analysis of derived insights

Data Validation

  • Triangulation with data models
  • Reference against proprietary databases
  • Corroboration with industry experts

REPORT WRITING

Qualitative

  • Market drivers
  • Market challenges
  • Market trends
  • Five forces analysis

Quantitative

  • Market size and forecast
  • Market segmentation
  • Geographical insights
  • Competitive landscape

Interested in this report?

Get your sample now to see our research methodology and insights!

Download Now

Frequently Asked Questions

Energy Gum market growth will increase by USD 41334.1 thousand thousand during 2026-2030.

The Energy Gum market is expected to grow at a CAGR of 6.7% during 2026-2030.

Energy Gum market is segmented by Distribution channel (Offline, Online) Flavor (Mint, Fruit flavor, Others) End-user (Fitness enthusiasts, Athletes, Consumers, Professionals, Others)

Arcor Group, Blockhead HQ Ltd, Cafenergy, Caffeine Gum, Cafosa Gum S.A., Cloetta AB, EnerChi, Fertin Pharma AS, First Energy B.V., Ford Gum Inc., GelStat Corp., Gud Gum, GumRunners LLC, Mars Inc., Military Energy Gum, Mondelez International Inc., NeuroGum Inc., Perfetti Van Melle Group BV, PI Nutrition, Rev Energy Gum, Run Gum, SUNII Energy are a few of the key vendors in the Energy Gum market.

North America will register the highest growth rate of 39.2% among the other regions. Therefore, the Energy Gum market in North America is expected to garner significant business opportunities for the vendors during the forecast period.

US, Canada, Mexico, Germany, UK, France, Italy, Spain, The Netherlands, China, Japan, India, South Korea, Australia, Indonesia, Brazil, Argentina, Chile, Saudi Arabia, UAE, South Africa, Turkey, Israel

  • Surge in demand for portable delivery formats is the driving factor this market.

The Energy Gum market vendors should focus on grabbing business opportunities from the Distribution channel segment as it accounted for the largest market share in the base year.
RIA - Research AI Assistant
Ask RIA
