
Confectionery Market Size 2025-2029
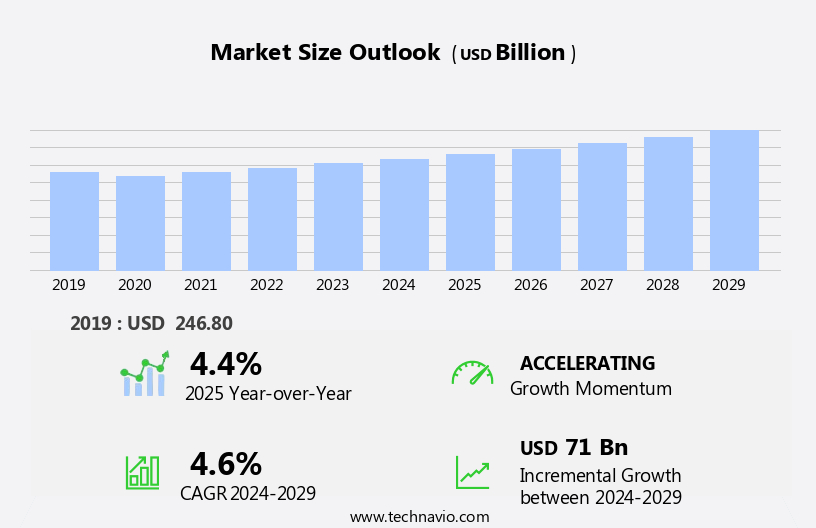
The confectionery market size is forecast to increase by USD 71 billion, at a CAGR of 4.6% between 2024 and 2029.
- The market is characterized by a diverse range of products in novel flavors, driving consumer preference and repeat purchases. This trend is fueled by the increasing demand for innovative and unique confectionery items, as consumers seek to differentiate their sweet treats. However, the rise of online retailing poses a significant challenge for market players, as they grapple with the complexities of managing logistics and ensuring the timely delivery of perishable confectionery products. Furthermore, supply chain disruptions, including raw material availability and price fluctuations, pose a persistent challenge in the confectionery sector.
- Companies must navigate these challenges by implementing robust supply chain strategies, leveraging technology for efficient order fulfillment, and collaborating with logistics partners to ensure timely and cost-effective delivery. To capitalize on the market's growth opportunities, players must focus on innovation, quality, and customer experience, while addressing the challenges of online retailing and supply chain complexities.
What will be the Size of the Confectionery Market during the forecast period?
Explore in-depth regional segment analysis with market size data - historical 2019-2023 and forecasts 2025-2029 - in the full report.
Request Free Sample
The market continues to evolve, with dynamic market dynamics shaping its various sectors. Quality control is a top priority for entities, ensuring the highest standards in their offerings. E-commerce platforms have become essential, catering to consumer preferences for convenience and bulk packaging. New product launches, driven by emerging consumer trends, are a constant in the market. Organic ingredients and ethical sourcing are increasingly important, as are gluten-free options and sugar-free confectionery. Hard candy and chocolate bars remain popular, with innovation in production processes leading to new textures and flavors. Pricing strategies vary, with cost optimization and profit margins a key consideration.
Global market share is influenced by brand positioning and consumer demographics. Allergen management and food safety regulations are critical for retailers, from specialty stores to convenience stores. Seasonal demand and brand loyalty are essential factors in inventory management. Automated packaging and digital marketing are transforming the industry, with social media platforms playing a significant role in advertising strategies. Sustainability practices and fair trade are increasingly important to consumers, driving import/export regulations and distribution channels. Consumer insights and supply chain management are crucial for entities to stay competitive. Ingredient sourcing and inventory management are ongoing challenges, with pricing strategies and profit margins a constant consideration.
Product innovation and customer preferences continue to shape the market, with fruit snacks, gummy candy, jelly beans, and chewing gum among the many options available. The market is a complex and ever-changing landscape, with entities adapting to consumer trends and evolving market patterns. From cocoa powder to chocolate truffles, the industry continues to offer a wide range of delicious and innovative products.
How is this Confectionery Industry segmented?
The confectionery industry research report provides comprehensive data (region-wise segment analysis), with forecasts and estimates in "USD billion" for the period 2025-2029, as well as historical data from 2019-2023 for the following segments.
- Distribution Channel
- Offline
- Online
- Product
- Chocolate
- Sugar confectionery
- Gums
- Age Group
- Adults
- Children
- Geriatric
- Price
- Economy
- Mid-range
- Luxury
- Geography
- North America
- US
- Canada
- Europe
- France
- Germany
- Italy
- The Netherlands
- UK
- APAC
- China
- India
- Japan
- Rest of World (ROW)
- North America
.
By Distribution Channel Insights
The offline segment is estimated to witness significant growth during the forecast period.
The market is experiencing significant trends and dynamics, with various entities shaping its growth. New product launches catering to dietary restrictions, such as vegan options and gluten-free choices, continue to emerge. Bulk packaging and online retailers are gaining popularity, offering convenience to consumers. Sustainability practices, including automated packaging and ethical sourcing, are increasingly important. Chocolate syrup and retail packaging innovations are enhancing the consumer experience. Cost optimization through import/export regulations and inventory management is a key focus for manufacturers. Marketing campaigns and social media marketing are essential tools for reaching diverse customer demographics. Food safety regulations and allergen management are critical considerations for retailers and producers.
Seasonal demand and brand loyalty are significant factors influencing sales. Chocolate bars, sugar-free confectionery, fruit snacks, gummy candy, jelly beans, and chewing gum continue to dominate the market. Production processes and pricing strategies are under constant scrutiny for profitability. Fair trade and quality control are essential components of brand positioning. Digital marketing and international trade are expanding distribution channels. Cocoa powder, confectionery coatings, and hard candy are among the various product innovations. The market's global share is influenced by brand loyalty, consumer trends, and consumer preferences. Supply chain management and product innovation are crucial for maintaining profit margins.
The market's future growth is expected to be driven by emerging markets and the increasing popularity of organic ingredients.
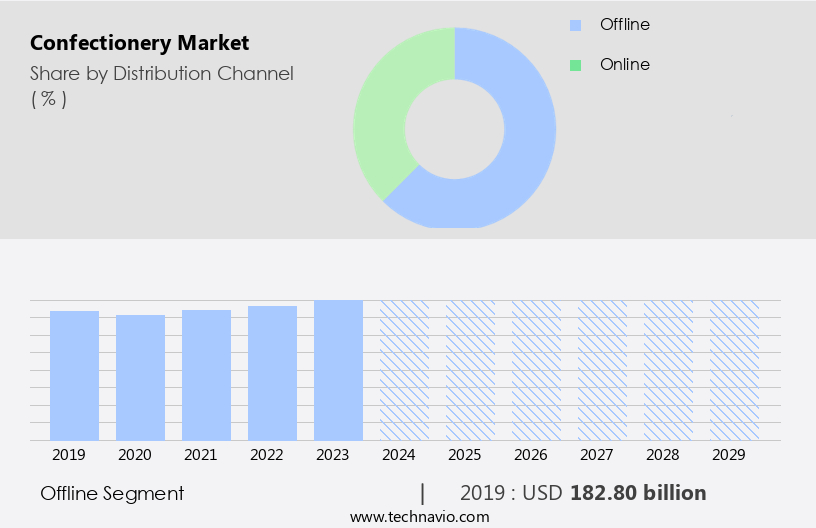
The Offline segment was valued at USD 182.80 billion in 2019 and showed a gradual increase during the forecast period.
Regional Analysis
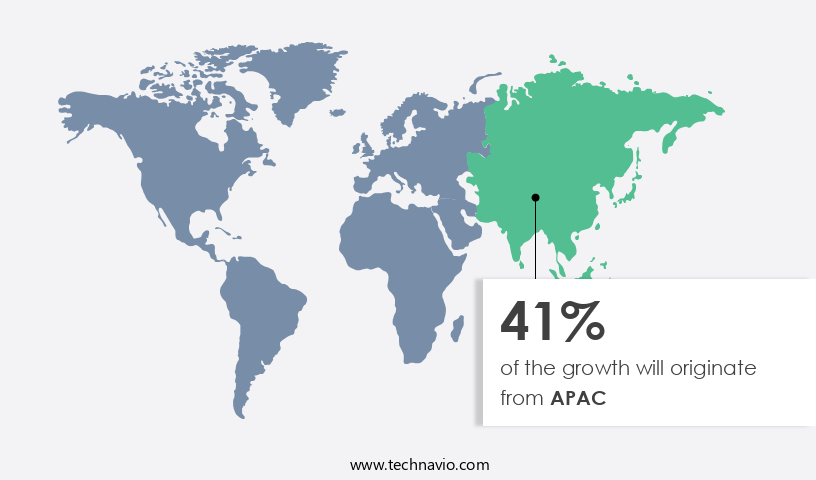
APAC is estimated to contribute 41% to the growth of the global market during the forecast period. Technavio's analysts have elaborately explained the regional trends and drivers that shape the market during the forecast period.
The market is experiencing significant growth, with Europe leading as the largest market in 2024. Major countries contributing to this region include the UK, Germany, France, Italy, Switzerland, the Netherlands, and Spain. Key manufacturers, such as Ferrero International S.A., are based in Europe and are driving market growth through strategic collaborations and product innovation. For example, Ferrero launched new dark chocolate variants of Ferrero Rocher and Crunchy Salted Caramel bars in September 2024. New product launches catering to various dietary preferences, including vegan and sugar-free options, are gaining popularity. Online retailers have emerged as significant distribution channels, enabling consumers to access a wide range of confectionery products from the comfort of their homes.
Emerging markets, particularly in Asia, are also showing strong growth due to increasing consumer disposable income and changing lifestyle trends. Consumer insights and sustainability practices are increasingly influencing the confectionery industry. Automated packaging and retail packaging solutions are being adopted to optimize costs and improve product quality. Import/export regulations and food safety regulations are crucial factors in the market, ensuring the safe and ethical sourcing of ingredients. Marketing campaigns and advertising strategies are essential for brands to build customer loyalty and reach a broader audience. Social media marketing and e-commerce platforms have become essential tools for brands to engage with consumers and expand their reach.
Fair trade and ethical sourcing are becoming increasingly important to consumers, with many preferring brands that prioritize these practices. Innovation in production processes, such as the use of organic ingredients and confectionery coatings, is a key trend in the market. Consumer trends and preferences, including the demand for convenience, seasonal demand, and a focus on healthier options, are shaping the market dynamics. Supply chain management and inventory management are crucial aspects of the industry, ensuring that products reach retailers and consumers in a timely and cost-effective manner. Price sensitivity and profit margins are essential considerations for manufacturers and retailers in the market.
Global market share and brand positioning are crucial factors for companies looking to expand their presence in the market. Allergen management and quality control are essential to ensure consumer safety and maintain brand reputation. In conclusion, the market is experiencing significant growth, driven by consumer preferences, innovation, and strategic collaborations. Europe remains the largest market, with key players based in the region. New product launches, sustainability practices, and digital marketing are essential trends shaping the industry. The market is expected to continue growing, with a focus on catering to various dietary preferences and consumer trends.
Market Dynamics
Our researchers analyzed the data with 2024 as the base year, along with the key drivers, trends, and challenges. A holistic analysis of drivers will help companies refine their marketing strategies to gain a competitive advantage.
What are the key market drivers leading to the rise in the adoption of Confectionery Industry?
- The market's growth is primarily driven by the extensive offering of novel product flavors, catering to a diverse consumer base.
- The market experiences significant growth due to the diverse preferences of consumers. The availability of a vast assortment of sugar confectionery products, including fruit snacks, gummy candy, jelly beans, chewing gum, chocolate truffles, and more, caters to various consumer tastes. This variety allows consumers the freedom to switch their choices based on their evolving preferences. Additionally, the convenience offered by these packaged items, especially in outlets like convenience stores, further boosts their popularity. Consumer trends and preferences play a crucial role in market dynamics. For instance, there is an increasing demand for dietary restriction-friendly confectionery products, such as sugar-free, gluten-free, and vegan options.
- Product innovation is another key factor driving the market, with manufacturers continually introducing new flavors, textures, and packaging to capture consumer attention. Effective supply chain management is essential in this industry to ensure the timely delivery of products and maintain their shelf life. Digital marketing strategies also play a significant role in reaching a broader audience and increasing brand awareness. International trade further expands the market by introducing a wider range of options and fostering competition.
What are the market trends shaping the Confectionery Industry?
- The increasing prevalence of online retailing represents a significant market trend. This shift towards e-commerce is mandated by the rising consumer preference for convenience and the ability to shop from anywhere at any time.
- The market has experienced significant growth due to the increasing popularity of e-commerce platforms. According to the U.S. Census Bureau, e-commerce sales reached an estimated USD300.1 billion in the third quarter of 2024, marking a 7.4% increase from the previous year. This growth is driven by the convenience and accessibility offered by online channels, which support both business-to-consumer (B2C) and business-to-business (B2B) transactions. Quality control is a crucial aspect of the confectionery industry, and companies are investing in advanced technologies to ensure the highest standards. Ingredient sourcing, inventory management, and allergen management are essential areas of focus to maintain product consistency and customer trust.
- Pricing strategies and brand positioning are also vital for success in the competitive market. Gluten-free options, hard candy, and confectionery coatings cater to diverse consumer preferences, while seasonal demand and brand loyalty contribute to recurring sales. Global market share is influenced by various factors, including product innovation, marketing efforts, and customer experience. In conclusion, the market is thriving due to the rise of e-commerce platforms, evolving consumer preferences, and the need for efficient operations. Companies that prioritize quality control, ingredient sourcing, inventory management, and allergen management, while implementing effective pricing strategies and brand positioning, are well-positioned for success.
What challenges does the Confectionery Industry face during its growth?
- The confectionery industry faces significant growth challenges due to intricate supply chain complexities within the sector.
- The market is experiencing significant growth, driven by consumer preferences for vegan options, bulk packaging, and organic ingredients. New product launches, such as sugar-free and chocolate syrup variants, cater to these trends. Online retailers are also gaining popularity, offering convenience and competitive pricing. However, manufacturers face challenges in this market, including pressure to maintain prices and margins due to retail stores' lower profit margins. Retailers are demanding more frequent and smaller product deliveries to minimize warehousing costs. To address these challenges, companies are exploring automated packaging solutions for cost optimization and sustainability practices.
- Consumer insights continue to shape the market, with an emphasis on innovative merchandising units and eco-friendly packaging. Overall, the market is dynamic and evolving, requiring manufacturers to stay agile and responsive to consumer demands.
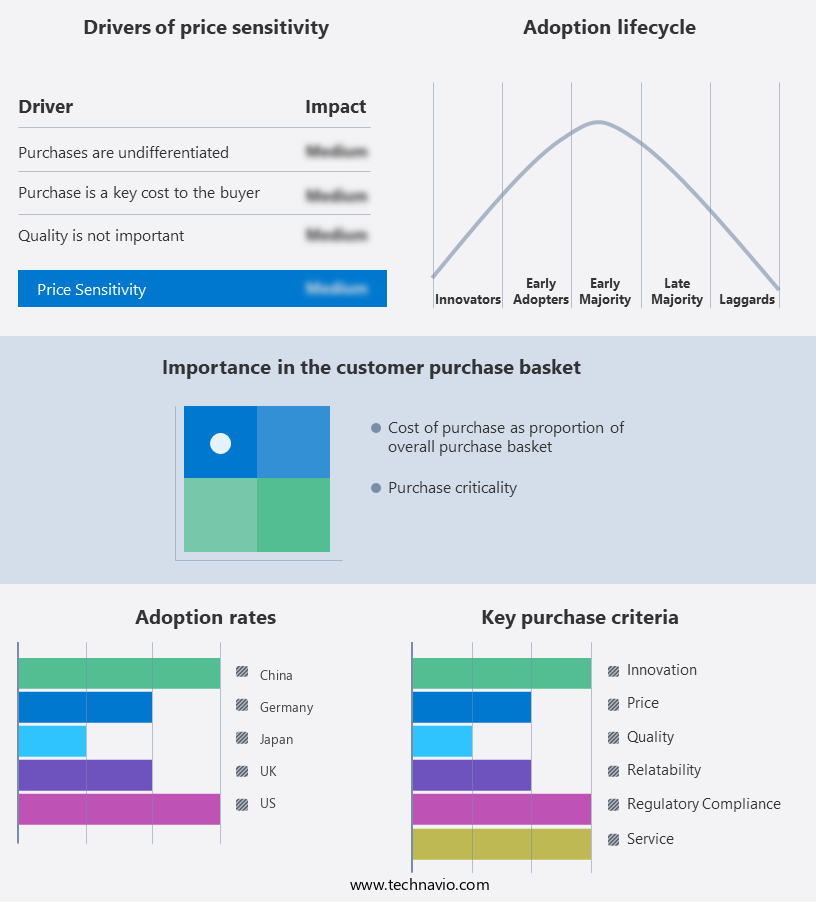
Exclusive Customer Landscape
The confectionery market forecasting report includes the adoption lifecycle of the market, covering from the innovator's stage to the laggard's stage. It focuses on adoption rates in different regions based on penetration. Furthermore, the confectionery market report also includes key purchase criteria and drivers of price sensitivity to help companies evaluate and develop their market growth analysis strategies.
Customer Landscape
Key Companies & Market Insights
Companies are implementing various strategies, such as strategic alliances, confectionery market forecast, partnerships, mergers and acquisitions, geographical expansion, and product/service launches, to enhance their presence in the industry.
Arcor Group - This company specializes in the production and distribution of high-quality confectionery items, including ruby chocolates and caramel dore.
The industry research and growth report includes detailed analyses of the competitive landscape of the market and information about key companies, including:
- Arcor Group
- Barry Callebaut AG
- Chocoladefabriken Lindt and Sprungli AG
- Crown Confectionery Co. Ltd
- Delfi Ltd.
- Ezaki Glico Co. Ltd.
- Ferrero International S.A.
- Foleys Candies LP
- Fuji Oil Co. Ltd.
- HARIBO GmbH and Co. KG
- Mars Inc.
- Meiji Holdings Co. Ltd.
- Mondelez International Inc.
- Nestle SA
- Parle Products Pvt. Ltd.
- Perfetti Van Melle Group BV
- The Hershey Co.
- Unilever PLC
- United Confectionery Sdn Bhd
- Yildiz Holding AS
Qualitative and quantitative analysis of companies has been conducted to help clients understand the wider business environment as well as the strengths and weaknesses of key industry players. Data is qualitatively analyzed to categorize companies as pure play, category-focused, industry-focused, and diversified; it is quantitatively analyzed to categorize companies as dominant, leading, strong, tentative, and weak.
Recent Development and News in Confectionery Market
- In February 2024, Mondelez International, a leading confectionery company, introduced a new line of Reese's Peanut Butter Cups made with sustainably sourced cocoa (Mondelez International Press Release, 2024). This initiative aligns with the growing consumer demand for ethical and sustainable food products.
- In March 2025, Ferrero Group, another major confectionery player, announced a strategic partnership with Nestlé to expand its presence in the plant-based the market (Ferrero Group Press Release, 2025). This collaboration will allow Ferrero to leverage Nestlé's expertise in plant-based products and expand its offerings to cater to the increasing demand for vegan and vegetarian confectionery items.
- In May 2024, Mars Wrigley, a global leader in the confectionery industry, completed the acquisition of a majority stake in Indian confectionery company, ITC's gum and candy business (Mars Wrigley Press Release, 2024). This strategic move strengthens Mars Wrigley's presence in the rapidly growing Indian market and provides access to ITC's extensive distribution network.
- In June 2025, Hershey Company, the largest chocolate manufacturer in North America, announced the launch of its new "Sweetened with Stevia" product line, which includes milk and dark chocolate bars sweetened with stevia instead of sugar (Hershey Company Press Release, 2025). This innovation caters to the growing consumer trend towards reduced-sugar and healthier confectionery options.
Research Analyst Overview
- The market is experiencing dynamic shifts, with a focus on innovation and sustainability. Confectionery ingredients, such as sugar alternatives and natural flavorings, are driving product formulation changes. Sustainability initiatives, including supply chain sustainability and ethical sourcing practices, are increasingly important to both consumers and industry regulations. Packaging design and brand development are key areas of investment, with an emphasis on e-commerce growth and digital transformation. Marketing strategies are leveraging consumer research and AI-driven consumer behavior analysis to optimize product offerings and sales channels. Chocolate manufacturing and candy production are adopting machine learning and data analytics to improve efficiency and product differentiation.
- Industry regulations are shaping the use of food additives and food safety standards. Brand extensions and product line extensions are expanding companies' offerings to meet evolving consumer preferences. Confectionery machinery and distribution networks are being optimized through technology and automation to enhance productivity and reduce waste. Overall, the confectionery industry is undergoing a period of significant change, with a focus on meeting consumer demands for healthier, more sustainable, and ethically-sourced products.
Dive into Technavio's robust research methodology, blending expert interviews, extensive data synthesis, and validated models for unparalleled Confectionery Market insights. See full methodology.
|
Market Scope |
|
|
Report Coverage |
Details |
|
Page number |
243 |
|
Base year |
2024 |
|
Historic period |
2019-2023 |
|
Forecast period |
2025-2029 |
|
Growth momentum & CAGR |
Accelerate at a CAGR of 4.6% |
|
Market growth 2025-2029 |
USD 71 billion |
|
Market structure |
Fragmented |
|
YoY growth 2024-2025(%) |
4.4 |
|
Key countries |
US, UK, China, Canada, Germany, France, Japan, Italy, The Netherlands, and India |
|
Competitive landscape |
Leading Companies, Market Positioning of Companies, Competitive Strategies, and Industry Risks |
What are the Key Data Covered in this Confectionery Market Research and Growth Report?
- CAGR of the Confectionery industry during the forecast period
- Detailed information on factors that will drive the growth and forecasting between 2025 and 2029
- Precise estimation of the size of the market and its contribution of the industry in focus to the parent market
- Accurate predictions about upcoming growth and trends and changes in consumer behaviour
- Growth of the market across Europe, North America, APAC, South America, and Middle East and Africa
- Thorough analysis of the market's competitive landscape and detailed information about companies
- Comprehensive analysis of factors that will challenge the confectionery market growth of industry companies
We can help! Our analysts can customize this confectionery market research report to meet your requirements.
 RIA -
RIA - 
