Energy Drinks Market Analysis, Size, and Forecast 2026-2030: APAC (Japan, China, and India), North America (US, Canada, and Mexico), Europe (UK, Germany, and France), South America (Brazil and Argentina), Middle East and Africa (UAE, Saudi Arabia, and South Africa), and Rest of World (ROW)

Energy Drinks Market Analysis, Size, and Forecast 2026-2030:
APAC (Japan, China, and India), North America (US, Canada, and Mexico), Europe (UK, Germany, and France), South America (Brazil and Argentina), Middle East and Africa (UAE, Saudi Arabia, and South Africa), and Rest of World (ROW)

Published: Mar 2026 286 Pages SKU: IRTNTR43781

Market Overview at a Glance

$57.26 B
Market Opportunity
8.9%
CAGR 2025 - 2030
38.8%
APAC Growth
$84.08 B
Sparkling energy drinks segment 2024

Energy Drinks Market Size 2026-2030

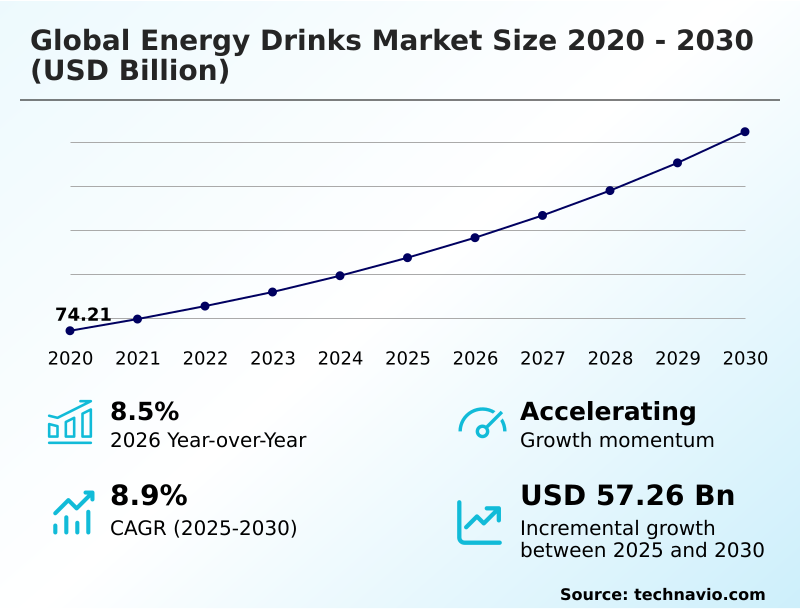
The energy drinks market size is valued to increase by USD 57.26 billion, at a CAGR of 8.9% from 2025 to 2030. Rising demand for functional and health-oriented formulations will drive the energy drinks market.

Major Market Trends & Insights

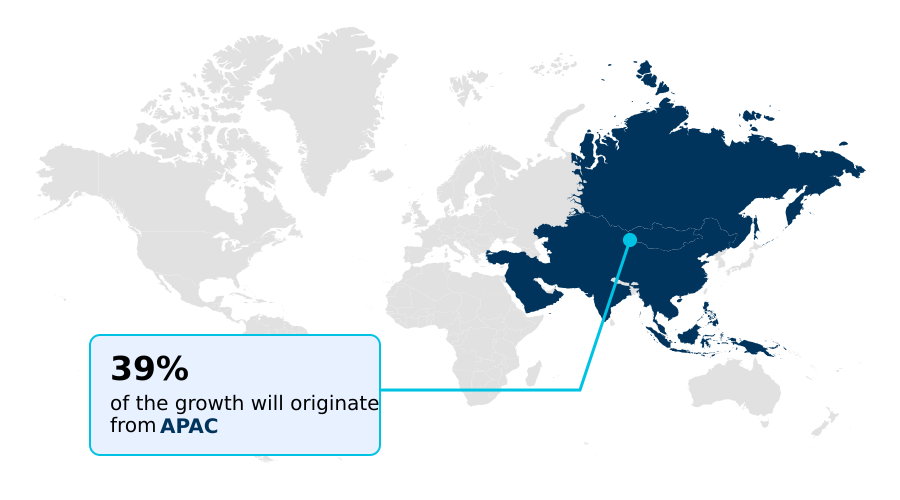
  • APAC dominated the market and accounted for a 38.8% growth during the forecast period.
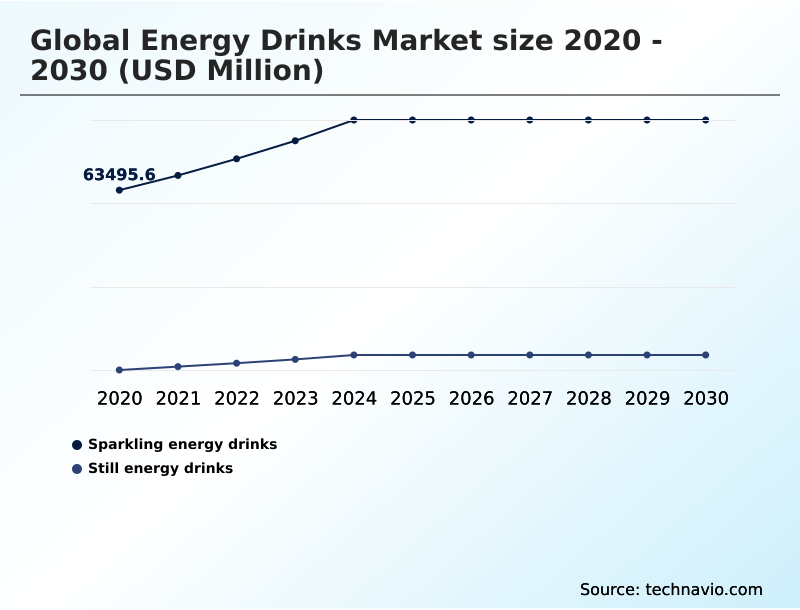
  • By Product - Sparkling energy drinks segment was valued at USD 84.08 billion in 2024
  • By Distribution Channel - Offline segment accounted for the largest market revenue share in 2024

Market Size & Forecast

  • Market Opportunities: USD 90.46 billion
  • Market Future Opportunities: USD 57.26 billion
  • CAGR from 2025 to 2030 : 8.9%

Market Summary

  • The energy drinks market is undergoing a significant metamorphosis, moving beyond its traditional athletic and nightlife associations to embrace a broader wellness-oriented identity. This evolution is driven by a profound shift in consumer preferences toward clean-label products featuring natural caffeine sources, nootropics for cognitive enhancement, and adaptogens for stress management.
  • Manufacturers are responding by reformulating portfolios to eliminate synthetic stimulants and artificial sweeteners, aligning with the demand for metabolic health and ingredient transparency. For instance, a beverage company facing new tiered sugar tax regulations might reformulate its flagship product with stevia and monk fruit.
  • This not only ensures compliance, reducing excise tax liability by up to 20%, but also creates a new marketing angle, positioning the drink as a healthier choice for productivity-focused professionals and fitness enthusiasts.
  • This strategic pivot from high-impact stimulation to sustained, functional energy is essential for navigating an increasingly competitive and health-conscious landscape, where success depends on catering to diversified consumption occasions, from e-sports to corporate wellness programs. The rise of direct-to-consumer models and quick-commerce platforms further disrupts traditional retail, enabling niche brands to reach global audiences and intensify market innovation.

What will be the Size of the Energy Drinks Market during the forecast period?

Get Key Insights on Market Forecast (PDF) Request Free Sample

How is the Energy Drinks Market Segmented?

The energy drinks industry research report provides comprehensive data (region-wise segment analysis), with forecasts and estimates in "USD million" for the period 2026-2030, as well as historical data from 2020-2024 for the following segments.

  • Product
    • Sparkling energy drinks
    • Still energy drinks
  • Distribution channel
    • Offline
    • Online
  • Product type
    • Natural
    • Conventional
  • Geography
    • APAC
      • Japan
      • China
      • India
    • North America
      • US
      • Canada
      • Mexico
    • Europe
      • UK
      • Germany
      • France
    • South America
      • Brazil
      • Argentina
    • Middle East and Africa
      • UAE
      • Saudi Arabia
      • South Africa
    • Rest of World (ROW)

By Product Insights

The sparkling energy drinks segment is estimated to witness significant growth during the forecast period.

The sparkling energy drinks segment remains the market cornerstone, driven by consumer perception linking carbonation with refreshment. This category is pivoting toward clean-label products, using carbonated spring water and natural essences.

Innovations in flavor diversification are moving beyond standard profiles to include botanical stimulants and adaptogenic herbs for a holistic energy lift. These functional ingredients appeal to modern consumer demographics seeking wellness-oriented drinks.

The format's success is also tied to advancements in aluminum can technology, which ensures superior carbonation retention and supports sustainable packaging goals.

Brands leveraging seasonal flavor releases within this segment have noted a 15% increase in repeat purchases, underscoring the value of experiential marketing. This is complemented by the growth of functional beverages as a whole.

Request Free Sample

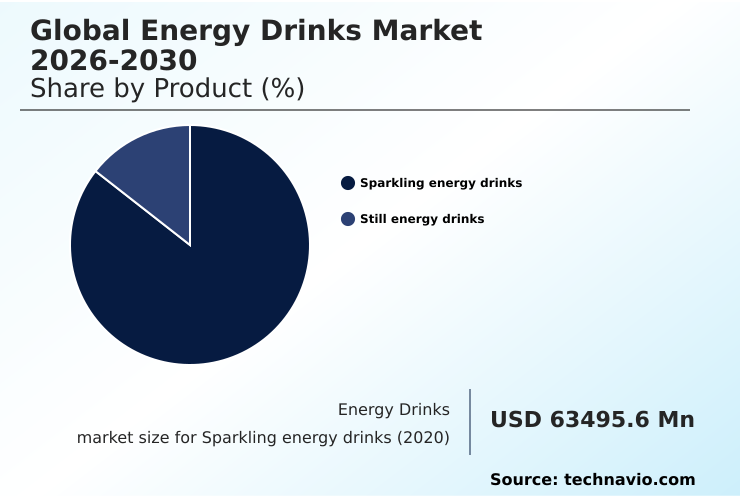
The Sparkling energy drinks segment was valued at USD 84.08 billion in 2024 and showed a gradual increase during the forecast period.

Request Free Sample

Regional Analysis

APAC is estimated to contribute 38.8% to the growth of the global market during the forecast period.Technavio’s analysts have elaborately explained the regional trends and drivers that shape the market during the forecast period.

See How Energy Drinks Market Demand is Rising in APAC Request Free Sample

The geographic landscape is defined by robust expansion in APAC, which is set to contribute nearly 39% of the market's incremental growth.

This region is driven by rising disposable incomes and the adoption of Westernized consumption patterns, creating a fertile ground for both conventional product type and natural product type beverages.

In contrast, North America represents a mature but highly innovative theater, where the focus is on premiumization and functional diversification. Europe remains a complex market shaped by stringent regulations, pushing a rapid transition toward sugar-free variants.

The strategic use of offline distribution and online distribution channels varies significantly, with e-commerce platforms enabling niche brands to bypass traditional retail beverage placement barriers, a strategy that has increased market penetration for new entrants by over 25%.

Market Dynamics

Our researchers analyzed the data with 2025 as the base year, along with the key drivers, trends, and challenges. A holistic analysis of drivers will help companies refine their marketing strategies to gain a competitive advantage.

  • A comprehensive analysis of the global energy drinks market 2026-2030 reveals nuanced consumer inquiries shaping product development. Questions around the best energy drink for gamers and energy drinks for corporate professionals are driving the creation of specialized nootropic drinks that prioritize focus over intense physical stimulation.
  • The demand for healthy alternatives to energy drinks has led to the growth of plant based energy drinks and products without artificial sweeteners. Consequently, brands are transparent about the caffeine content in energy drinks and are exploring the role of adaptogens in beverages to offer stress-mitigating benefits.
  • The impact of sugar tax on beverages has accelerated the push for low sugar pre workout drink options, directly addressing both regulatory challenges in the beverage industry and consumer health concerns. Marketing energy drinks to women has become a key strategy, correcting a historical imbalance.
  • On the operational side, companies are optimizing e-commerce strategies for beverage brands, particularly for energy drink consumption in APAC. For example, firms implementing advanced inventory management for their online channels have seen a 10% reduction in stock-outs compared to those relying solely on traditional retail.
  • The discussion continues to evolve around new energy drink product launches, comparing sparkling vs still energy drinks, the use of functional ingredients in sports nutrition, and a commitment to sustainable packaging for beverage cans, reflecting a sophisticated and demanding marketplace.

What are the key market drivers leading to the rise in the adoption of Energy Drinks Industry?

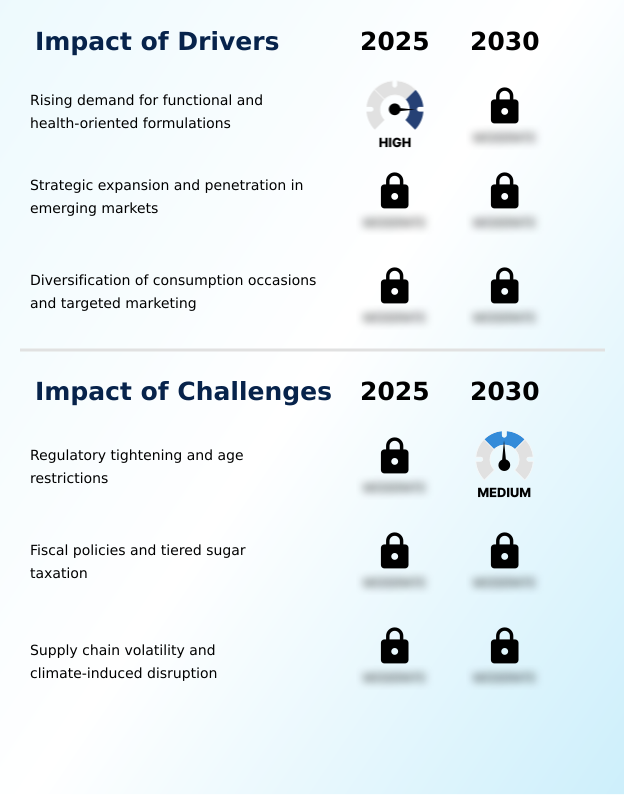
  • The primary market driver is the rising consumer demand for functional and health-oriented beverage formulations.

  • Market growth is significantly driven by strategic expansion into new consumer segments and consumption occasions. The development of adult-centric productivity drinks and on-the-go energy solutions has broadened the market beyond its traditional youth demographic.
  • This has been supported by innovative energy drink distribution strategies, including partnerships that place products in corporate wellness programs, leading to a 15% increase in bulk sales.
  • The pre-workout supplements category continues to merge with energy drinks, with hybrid products showing a 30% faster adoption rate than standalone items.
  • The increasing popularity of ready-to-drink energy formats, particularly canned energy drinks, available through convenience store beverage sales and quick-commerce platforms, ensures immediate accessibility. Key components driving this demand include vitamin fortification and electrolyte replenishment.

What are the market trends shaping the Energy Drinks Industry?

  • The market is experiencing a significant shift toward cognitive enhancement. Nootropic formulations are becoming a key differentiator for brands targeting mental acuity and focus.

  • Key market trends are centered on the evolution toward wellness-oriented drinks, where consumer preference is shifting from simple stimulation to holistic benefits. The integration of nootropic formulations for cognitive enhancement is a primary driver, with brands that incorporate such ingredients reporting a 20% higher customer retention rate. This is complemented by a rise in clean-label products that emphasize ingredient transparency.
  • The e-sports beverage market continues to expand, with specialized gaming energy drinks designed for sustained focus, a segment that has seen a 25% year-over-year growth in online sales. Furthermore, the diversification of the lifestyle beverage category to include female-focused energy drinks is unlocking new consumer segments, correcting a long-standing market imbalance and expanding the overall addressable audience.
  • B-vitamins and taurine remain staple functional ingredients.

What challenges does the Energy Drinks Industry face during its growth?

  • Regulatory tightening and the implementation of age restrictions present a key challenge to industry growth.

  • The primary market challenge stems from navigating an increasingly complex regulatory environment and shifting consumer perceptions around health. The proliferation of synthetic stimulants in conventional formulations has attracted intense scrutiny, forcing many companies to pivot to natural alternatives. This reformulation process can increase production costs by up to 18%, impacting profit margins.
  • Furthermore, the demand for sustainable packaging is pressuring brands to transition away from plastics, a move that requires significant capital investment in new bottling and canning lines. The competitive pressure from the broader sports nutrition drinks market and powdered energy mixers, which offer greater customization, forces constant innovation.
  • Finally, managing brand partnerships effectively to maintain an authentic connection with consumers remains a persistent challenge in a crowded marketplace that includes sports drinks.

Exclusive Technavio Analysis on Customer Landscape

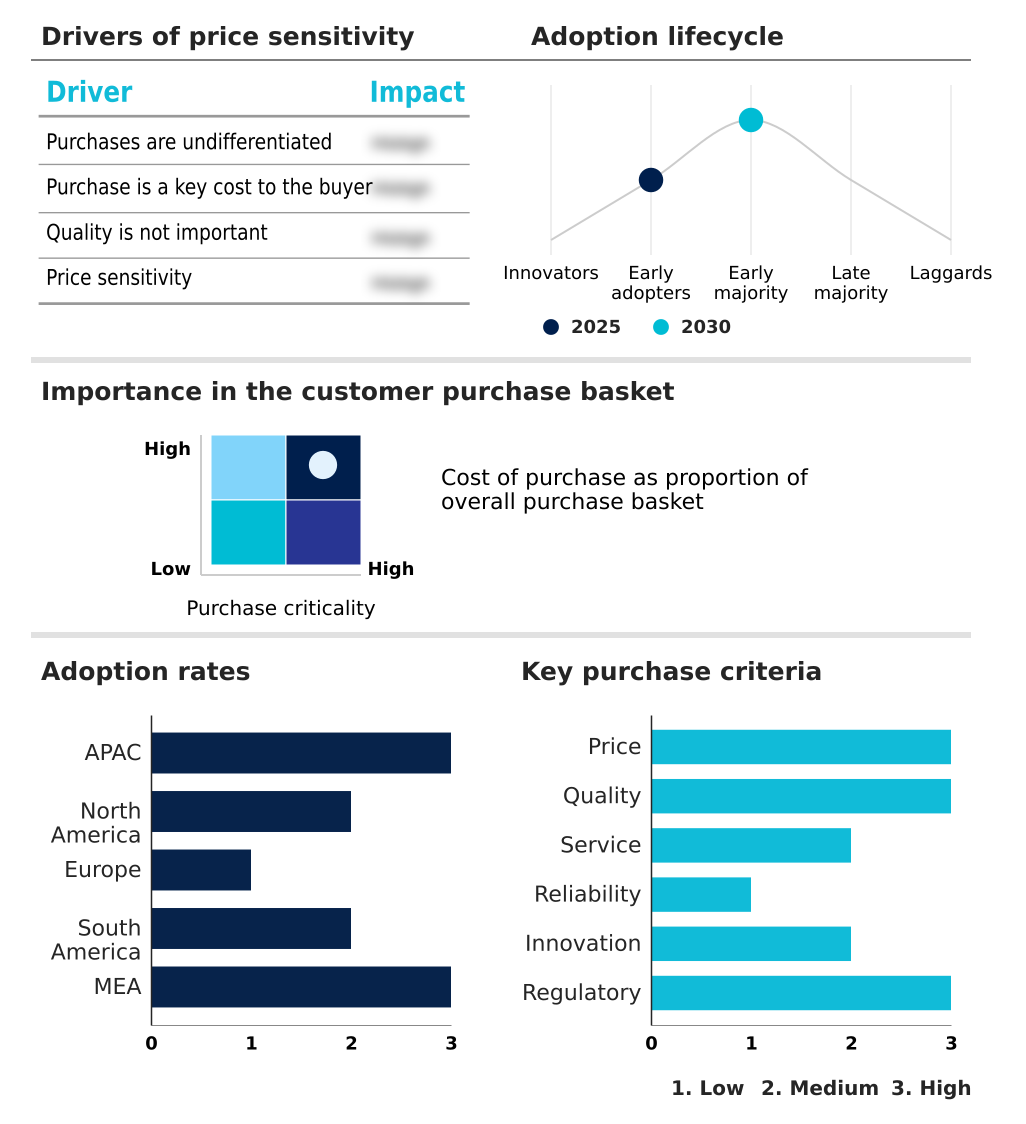
The energy drinks market forecasting report includes the adoption lifecycle of the market, covering from the innovator’s stage to the laggard’s stage. It focuses on adoption rates in different regions based on penetration. Furthermore, the energy drinks market report also includes key purchase criteria and drivers of price sensitivity to help companies evaluate and develop their market growth analysis strategies.

Customer Landscape of Energy Drinks Industry

Competitive Landscape

Companies are implementing various strategies, such as strategic alliances, energy drinks market forecast, partnerships, mergers and acquisitions, geographical expansion, and product/service launches, to enhance their presence in the industry.

Alani Nutrition LLC - Analysis indicates a focus on formulating low-calorie energy drinks and wellness supplements, targeting a health-conscious consumer base with lifestyle beverage category products.

The industry research and growth report includes detailed analyses of the competitive landscape of the market and information about key companies, including:

  • Alani Nutrition LLC
  • Amway Corp.
  • Celsius Holdings Inc.
  • G Fuel
  • Ghost LLC
  • GOAT Fuel Inc.
  • HELL ENERGY Magyarorszag Kft.
  • Hype Energy Drinks
  • Keurig Dr Pepper Inc.
  • Living Essentials Marketing LLC
  • Monster Beverage Corp.
  • Nutrabolt
  • Otsuka Holdings Co. Ltd.
  • PepsiCo Inc.
  • Red Bull GmbH
  • Suntory Beverage and Food Ltd.
  • TCP Group
  • Uptime Energy Inc.
  • Yerbae Brands Co.
  • ZOA Energy

Qualitative and quantitative analysis of companies has been conducted to help clients understand the wider business environment as well as the strengths and weaknesses of key industry players. Data is qualitatively analyzed to categorize companies as pure play, category-focused, industry-focused, and diversified; it is quantitatively analyzed to categorize companies as dominant, leading, strong, tentative, and weak.

Recent Development and News in Energy drinks market

  • In January 2025, Celsius Holdings Inc. expanded its portfolio with the launch of Sparkling Strawberry Passionfruit, a new flavor released nationwide across major retail and online channels to capture seasonal demand.
  • In January 2025, Anheuser-Busch, in collaboration with sports nutrition company 1st Phorm, launched Phorm Energy, a new beverage line distributed through an extensive network of US convenience stores and retailers.
  • In April 2025, Celsius Holdings Inc. finalized its acquisition of Alani Nutrition LLC, integrating the Alani Nu brand's ready-to-drink products and supplements into its broader distribution system.
  • In July 2025, O'Neill Vintners and Distillers introduced Catalyst, a plant-based energy drink engineered for health-conscious consumers, featuring nootropics and containing zero sugar or artificial additives.

Dive into Technavio’s robust research methodology, blending expert interviews, extensive data synthesis, and validated models for unparalleled Energy Drinks Market insights. See full methodology.

Market Scope
Page number 286
Base year 2025
Historic period 2020-2024
Forecast period 2026-2030
Growth momentum & CAGR Accelerate at a CAGR of 8.9%
Market growth 2026-2030 USD 57264.6 million
Market structure Fragmented
YoY growth 2025-2026(%) 8.5%
Key countries Japan, China, India, South Korea, Indonesia, Thailand, US, Canada, Mexico, UK, Germany, France, Italy, Spain, Poland, Brazil, Argentina, Chile, UAE, Saudi Arabia, South Africa, Egypt and Nigeria
Competitive landscape Leading Companies, Market Positioning of Companies, Competitive Strategies, and Industry Risks

Request Free Sample

Research Analyst Overview

  • The market's innovation is centered on sophisticated beverage formulation, moving away from high-caffeine synthetic stimulants toward a more nuanced use of functional ingredients. We are observing a significant pivot to natural caffeine sources like yerba mate and guarana, often combined with adaptogenic herbs, ginseng, and other herbal extracts to offer holistic benefits.
  • The inclusion of nootropic formulations with l-theanine and citicoline for cognitive enhancement is becoming standard. Formulations now frequently include amino acid blends, taurine, and b-vitamins for metabolic support. The market is segmented by product, including sparkling energy drinks and still energy drinks, and by product type, such as natural and conventional.
  • Clean-label products, sugar-free variants, and low-calorie options are driving growth, with some brands exploring ketone-based energy and fermented botanicals. This shift has necessitated a 25% increase in R&D spending for firms aiming to validate the efficacy of these new ingredient combinations.
  • This complex landscape of functional beverages, which includes sports drinks, ready-to-drink coffee, and carbonated beverages, is increasingly defined by a focus on thermogenesis, electrolyte replenishment, and vitamin fortification, managed through both offline distribution and expanding online distribution channels.

What are the Key Data Covered in this Energy Drinks Market Research and Growth Report?

  • What is the expected growth of the Energy Drinks Market between 2026 and 2030?

    • USD 57.26 billion, at a CAGR of 8.9%

  • What segmentation does the market report cover?

    • The report is segmented by Product (Sparkling energy drinks, and Still energy drinks), Distribution Channel (Offline, and Online), Product Type (Natural, and Conventional) and Geography (APAC, North America, Europe, South America, Middle East and Africa)

  • Which regions are analyzed in the report?

    • APAC, North America, Europe, South America and Middle East and Africa

  • What are the key growth drivers and market challenges?

    • Rising demand for functional and health-oriented formulations, Regulatory tightening and age restrictions

  • Who are the major players in the Energy Drinks Market?

    • Alani Nutrition LLC, Amway Corp., Celsius Holdings Inc., G Fuel, Ghost LLC, GOAT Fuel Inc., HELL ENERGY Magyarorszag Kft., Hype Energy Drinks, Keurig Dr Pepper Inc., Living Essentials Marketing LLC, Monster Beverage Corp., Nutrabolt, Otsuka Holdings Co. Ltd., PepsiCo Inc., Red Bull GmbH, Suntory Beverage and Food Ltd., TCP Group, Uptime Energy Inc., Yerbae Brands Co. and ZOA Energy

Market Research Insights

  • Market dynamics are increasingly shaped by sophisticated energy drink marketing and strategic brand partnerships, which have proven to enhance brand visibility by over 30% in competitive regions. The growth of the direct-to-consumer beverage brands channel has been pivotal, with some companies reporting a 15% reduction in customer acquisition costs compared to traditional retail-focused campaigns.
  • This shift is amplified by the rise of quick-commerce beverage delivery, which improves order fulfillment times by an average of 40% in dense urban areas, fundamentally altering on-the-go energy solutions. As consumer demographics evolve, the industry is adapting its beverage formulation to meet new demands for ingredient transparency, creating a more dynamic and responsive market.

We can help! Our analysts can customize this energy drinks market research report to meet your requirements.

Get in touch

1. Executive Summary

1.1 Market overview

Executive Summary - Chart on Market Overview
Executive Summary - Data Table on Market Overview
Executive Summary - Chart on Global Market Characteristics
Executive Summary - Chart on Market by Geography
Executive Summary - Chart on Market Segmentation by Product
Executive Summary - Chart on Market Segmentation by Distribution Channel
Executive Summary - Chart on Market Segmentation by Product Type
Executive Summary - Chart on Incremental Growth
Executive Summary - Data Table on Incremental Growth
Executive Summary - Chart on Company Market Positioning

2. Technavio Analysis

2.1 Analysis of price sensitivity, lifecycle, customer purchase basket, adoption rates, and purchase criteria

2.2 Criticality of inputs and Factors of differentiation

Chart on Overview on criticality of inputs and factors of differentiation

2.3 Factors of disruption

Chart on Overview on factors of disruption

2.4 Impact of drivers and challenges

Chart on Impact of drivers and challenges in 2025 and 2030

3. Market Landscape

3.1 Market ecosystem

Chart on Parent Market
Data Table on - Parent Market

3.2 Market characteristics

Chart on Market characteristics analysis

3.3 Value chain analysis

Chart on Value chain analysis

4. Market Sizing

4.1 Market definition

Data Table on Offerings of companies included in the market definition

4.2 Market segment analysis

Market segments

4.3 Market size 2025

4.4 Market outlook: Forecast for 2025-2030

Chart on Global - Market size and forecast 2025-2030 ($ million)
Data Table on Global - Market size and forecast 2025-2030 ($ million)
Chart on Global Market: Year-over-year growth 2025-2030 (%)
Data Table on Global Market: Year-over-year growth 2025-2030 (%)

5. Historic Market Size

5.1 Global Energy Drinks Market 2020 - 2024

Historic Market Size - Data Table on Global Energy Drinks Market 2020 - 2024 ($ million)

5.2 Product segment analysis 2020 - 2024

Historic Market Size - Product Segment 2020 - 2024 ($ million)

5.3 Distribution Channel segment analysis 2020 - 2024

Historic Market Size - Distribution Channel Segment 2020 - 2024 ($ million)

5.4 Product Type segment analysis 2020 - 2024

Historic Market Size - Product Type Segment 2020 - 2024 ($ million)

5.5 Geography segment analysis 2020 - 2024

Historic Market Size - Geography Segment 2020 - 2024 ($ million)

5.6 Country segment analysis 2020 - 2024

Historic Market Size - Country Segment 2020 - 2024 ($ million)

6. Qualitative Analysis

6.1 Impact of AI in Global Energy Drinks Market

6.2 Impact of Geopolitical Conflict for Global Energy Drinks Market

7. Five Forces Analysis

7.1 Five forces summary

Five forces analysis - Comparison between 2025 and 2030

7.2 Bargaining power of buyers

Bargaining power of buyers - Impact of key factors 2025 and 2030

7.3 Bargaining power of suppliers

Bargaining power of suppliers - Impact of key factors in 2025 and 2030

7.4 Threat of new entrants

Threat of new entrants - Impact of key factors in 2025 and 2030

7.5 Threat of substitutes

Threat of substitutes - Impact of key factors in 2025 and 2030

7.6 Threat of rivalry

Threat of rivalry - Impact of key factors in 2025 and 2030

7.7 Market condition

Chart on Market condition - Five forces 2025 and 2030

8. Market Segmentation by Product

8.1 Market segments

Chart on Product - Market share 2025-2030 (%)
Data Table on Product - Market share 2025-2030 (%)

8.2 Comparison by Product

Chart on Comparison by Product
Data Table on Comparison by Product

8.3 Sparkling energy drinks - Market size and forecast 2025-2030

Chart on Sparkling energy drinks - Market size and forecast 2025-2030 ($ million)
Data Table on Sparkling energy drinks - Market size and forecast 2025-2030 ($ million)
Chart on Sparkling energy drinks - Year-over-year growth 2025-2030 (%)
Data Table on Sparkling energy drinks - Year-over-year growth 2025-2030 (%)

8.4 Still energy drinks - Market size and forecast 2025-2030

Chart on Still energy drinks - Market size and forecast 2025-2030 ($ million)
Data Table on Still energy drinks - Market size and forecast 2025-2030 ($ million)
Chart on Still energy drinks - Year-over-year growth 2025-2030 (%)
Data Table on Still energy drinks - Year-over-year growth 2025-2030 (%)

8.5 Market opportunity by Product

Market opportunity by Product ($ million)
Data Table on Market opportunity by Product ($ million)

9. Market Segmentation by Distribution Channel

9.1 Market segments

Chart on Distribution Channel - Market share 2025-2030 (%)
Data Table on Distribution Channel - Market share 2025-2030 (%)

9.2 Comparison by Distribution Channel

Chart on Comparison by Distribution Channel
Data Table on Comparison by Distribution Channel

9.3 Offline - Market size and forecast 2025-2030

Chart on Offline - Market size and forecast 2025-2030 ($ million)
Data Table on Offline - Market size and forecast 2025-2030 ($ million)
Chart on Offline - Year-over-year growth 2025-2030 (%)
Data Table on Offline - Year-over-year growth 2025-2030 (%)

9.4 Online - Market size and forecast 2025-2030

Chart on Online - Market size and forecast 2025-2030 ($ million)
Data Table on Online - Market size and forecast 2025-2030 ($ million)
Chart on Online - Year-over-year growth 2025-2030 (%)
Data Table on Online - Year-over-year growth 2025-2030 (%)

9.5 Market opportunity by Distribution Channel

Market opportunity by Distribution Channel ($ million)
Data Table on Market opportunity by Distribution Channel ($ million)

10. Market Segmentation by Product Type

10.1 Market segments

Chart on Product Type - Market share 2025-2030 (%)
Data Table on Product Type - Market share 2025-2030 (%)

10.2 Comparison by Product Type

Chart on Comparison by Product Type
Data Table on Comparison by Product Type

10.3 Natural - Market size and forecast 2025-2030

Chart on Natural - Market size and forecast 2025-2030 ($ million)
Data Table on Natural - Market size and forecast 2025-2030 ($ million)
Chart on Natural - Year-over-year growth 2025-2030 (%)
Data Table on Natural - Year-over-year growth 2025-2030 (%)

10.4 Conventional - Market size and forecast 2025-2030

Chart on Conventional - Market size and forecast 2025-2030 ($ million)
Data Table on Conventional - Market size and forecast 2025-2030 ($ million)
Chart on Conventional - Year-over-year growth 2025-2030 (%)
Data Table on Conventional - Year-over-year growth 2025-2030 (%)

10.5 Market opportunity by Product Type

Market opportunity by Product Type ($ million)
Data Table on Market opportunity by Product Type ($ million)

11. Customer Landscape

11.1 Customer landscape overview

Analysis of price sensitivity, lifecycle, customer purchase basket, adoption rates, and purchase criteria

12. Geographic Landscape

12.1 Geographic segmentation

Chart on Market share by geography 2025-2030 (%)
Data Table on Market share by geography 2025-2030 (%)

12.2 Geographic comparison

Chart on Geographic comparison
Data Table on Geographic comparison

12.3 APAC - Market size and forecast 2025-2030

Chart on APAC - Market size and forecast 2025-2030 ($ million)
Data Table on APAC - Market size and forecast 2025-2030 ($ million)
Chart on APAC - Year-over-year growth 2025-2030 (%)
Data Table on APAC - Year-over-year growth 2025-2030 (%)
Chart on Regional Comparison - APAC
Data Table on Regional Comparison - APAC

12.3.1 Japan - Market size and forecast 2025-2030

Chart on Japan - Market size and forecast 2025-2030 ($ million)
Data Table on Japan - Market size and forecast 2025-2030 ($ million)
Chart on Japan - Year-over-year growth 2025-2030 (%)
Data Table on Japan - Year-over-year growth 2025-2030 (%)

12.3.2 China - Market size and forecast 2025-2030

Chart on China - Market size and forecast 2025-2030 ($ million)
Data Table on China - Market size and forecast 2025-2030 ($ million)
Chart on China - Year-over-year growth 2025-2030 (%)
Data Table on China - Year-over-year growth 2025-2030 (%)

12.3.3 India - Market size and forecast 2025-2030

Chart on India - Market size and forecast 2025-2030 ($ million)
Data Table on India - Market size and forecast 2025-2030 ($ million)
Chart on India - Year-over-year growth 2025-2030 (%)
Data Table on India - Year-over-year growth 2025-2030 (%)

12.3.4 South Korea - Market size and forecast 2025-2030

Chart on South Korea - Market size and forecast 2025-2030 ($ million)
Data Table on South Korea - Market size and forecast 2025-2030 ($ million)
Chart on South Korea - Year-over-year growth 2025-2030 (%)
Data Table on South Korea - Year-over-year growth 2025-2030 (%)

12.3.5 Indonesia - Market size and forecast 2025-2030

Chart on Indonesia - Market size and forecast 2025-2030 ($ million)
Data Table on Indonesia - Market size and forecast 2025-2030 ($ million)
Chart on Indonesia - Year-over-year growth 2025-2030 (%)
Data Table on Indonesia - Year-over-year growth 2025-2030 (%)

12.3.6 Thailand - Market size and forecast 2025-2030

Chart on Thailand - Market size and forecast 2025-2030 ($ million)
Data Table on Thailand - Market size and forecast 2025-2030 ($ million)
Chart on Thailand - Year-over-year growth 2025-2030 (%)
Data Table on Thailand - Year-over-year growth 2025-2030 (%)

12.4 North America - Market size and forecast 2025-2030

Chart on North America - Market size and forecast 2025-2030 ($ million)
Data Table on North America - Market size and forecast 2025-2030 ($ million)
Chart on North America - Year-over-year growth 2025-2030 (%)
Data Table on North America - Year-over-year growth 2025-2030 (%)
Chart on Regional Comparison - North America
Data Table on Regional Comparison - North America

12.4.1 US - Market size and forecast 2025-2030

Chart on US - Market size and forecast 2025-2030 ($ million)
Data Table on US - Market size and forecast 2025-2030 ($ million)
Chart on US - Year-over-year growth 2025-2030 (%)
Data Table on US - Year-over-year growth 2025-2030 (%)

12.4.2 Canada - Market size and forecast 2025-2030

Chart on Canada - Market size and forecast 2025-2030 ($ million)
Data Table on Canada - Market size and forecast 2025-2030 ($ million)
Chart on Canada - Year-over-year growth 2025-2030 (%)
Data Table on Canada - Year-over-year growth 2025-2030 (%)

12.4.3 Mexico - Market size and forecast 2025-2030

Chart on Mexico - Market size and forecast 2025-2030 ($ million)
Data Table on Mexico - Market size and forecast 2025-2030 ($ million)
Chart on Mexico - Year-over-year growth 2025-2030 (%)
Data Table on Mexico - Year-over-year growth 2025-2030 (%)

12.5 Europe - Market size and forecast 2025-2030

Chart on Europe - Market size and forecast 2025-2030 ($ million)
Data Table on Europe - Market size and forecast 2025-2030 ($ million)
Chart on Europe - Year-over-year growth 2025-2030 (%)
Data Table on Europe - Year-over-year growth 2025-2030 (%)
Chart on Regional Comparison - Europe
Data Table on Regional Comparison - Europe

12.5.1 UK - Market size and forecast 2025-2030

Chart on UK - Market size and forecast 2025-2030 ($ million)
Data Table on UK - Market size and forecast 2025-2030 ($ million)
Chart on UK - Year-over-year growth 2025-2030 (%)
Data Table on UK - Year-over-year growth 2025-2030 (%)

12.5.2 Germany - Market size and forecast 2025-2030

Chart on Germany - Market size and forecast 2025-2030 ($ million)
Data Table on Germany - Market size and forecast 2025-2030 ($ million)
Chart on Germany - Year-over-year growth 2025-2030 (%)
Data Table on Germany - Year-over-year growth 2025-2030 (%)

12.5.3 France - Market size and forecast 2025-2030

Chart on France - Market size and forecast 2025-2030 ($ million)
Data Table on France - Market size and forecast 2025-2030 ($ million)
Chart on France - Year-over-year growth 2025-2030 (%)
Data Table on France - Year-over-year growth 2025-2030 (%)

12.5.4 Italy - Market size and forecast 2025-2030

Chart on Italy - Market size and forecast 2025-2030 ($ million)
Data Table on Italy - Market size and forecast 2025-2030 ($ million)
Chart on Italy - Year-over-year growth 2025-2030 (%)
Data Table on Italy - Year-over-year growth 2025-2030 (%)

12.5.5 Spain - Market size and forecast 2025-2030

Chart on Spain - Market size and forecast 2025-2030 ($ million)
Data Table on Spain - Market size and forecast 2025-2030 ($ million)
Chart on Spain - Year-over-year growth 2025-2030 (%)
Data Table on Spain - Year-over-year growth 2025-2030 (%)

12.5.6 Poland - Market size and forecast 2025-2030

Chart on Poland - Market size and forecast 2025-2030 ($ million)
Data Table on Poland - Market size and forecast 2025-2030 ($ million)
Chart on Poland - Year-over-year growth 2025-2030 (%)
Data Table on Poland - Year-over-year growth 2025-2030 (%)

12.6 South America - Market size and forecast 2025-2030

Chart on South America - Market size and forecast 2025-2030 ($ million)
Data Table on South America - Market size and forecast 2025-2030 ($ million)
Chart on South America - Year-over-year growth 2025-2030 (%)
Data Table on South America - Year-over-year growth 2025-2030 (%)
Chart on Regional Comparison - South America
Data Table on Regional Comparison - South America

12.6.1 Brazil - Market size and forecast 2025-2030

Chart on Brazil - Market size and forecast 2025-2030 ($ million)
Data Table on Brazil - Market size and forecast 2025-2030 ($ million)
Chart on Brazil - Year-over-year growth 2025-2030 (%)
Data Table on Brazil - Year-over-year growth 2025-2030 (%)

12.6.2 Argentina - Market size and forecast 2025-2030

Chart on Argentina - Market size and forecast 2025-2030 ($ million)
Data Table on Argentina - Market size and forecast 2025-2030 ($ million)
Chart on Argentina - Year-over-year growth 2025-2030 (%)
Data Table on Argentina - Year-over-year growth 2025-2030 (%)

12.6.3 Chile - Market size and forecast 2025-2030

Chart on Chile - Market size and forecast 2025-2030 ($ million)
Data Table on Chile - Market size and forecast 2025-2030 ($ million)
Chart on Chile - Year-over-year growth 2025-2030 (%)
Data Table on Chile - Year-over-year growth 2025-2030 (%)

12.7 Middle East and Africa - Market size and forecast 2025-2030

Chart on Middle East and Africa - Market size and forecast 2025-2030 ($ million)
Data Table on Middle East and Africa - Market size and forecast 2025-2030 ($ million)
Chart on Middle East and Africa - Year-over-year growth 2025-2030 (%)
Data Table on Middle East and Africa - Year-over-year growth 2025-2030 (%)
Chart on Regional Comparison - Middle East and Africa
Data Table on Regional Comparison - Middle East and Africa

12.7.1 UAE - Market size and forecast 2025-2030

Chart on UAE - Market size and forecast 2025-2030 ($ million)
Data Table on UAE - Market size and forecast 2025-2030 ($ million)
Chart on UAE - Year-over-year growth 2025-2030 (%)
Data Table on UAE - Year-over-year growth 2025-2030 (%)

12.7.2 Saudi Arabia - Market size and forecast 2025-2030

Chart on Saudi Arabia - Market size and forecast 2025-2030 ($ million)
Data Table on Saudi Arabia - Market size and forecast 2025-2030 ($ million)
Chart on Saudi Arabia - Year-over-year growth 2025-2030 (%)
Data Table on Saudi Arabia - Year-over-year growth 2025-2030 (%)

12.7.3 South Africa - Market size and forecast 2025-2030

Chart on South Africa - Market size and forecast 2025-2030 ($ million)
Data Table on South Africa - Market size and forecast 2025-2030 ($ million)
Chart on South Africa - Year-over-year growth 2025-2030 (%)
Data Table on South Africa - Year-over-year growth 2025-2030 (%)

12.7.4 Egypt - Market size and forecast 2025-2030

Chart on Egypt - Market size and forecast 2025-2030 ($ million)
Data Table on Egypt - Market size and forecast 2025-2030 ($ million)
Chart on Egypt - Year-over-year growth 2025-2030 (%)
Data Table on Egypt - Year-over-year growth 2025-2030 (%)

12.7.5 Nigeria - Market size and forecast 2025-2030

Chart on Nigeria - Market size and forecast 2025-2030 ($ million)
Data Table on Nigeria - Market size and forecast 2025-2030 ($ million)
Chart on Nigeria - Year-over-year growth 2025-2030 (%)
Data Table on Nigeria - Year-over-year growth 2025-2030 (%)

12.8 Market opportunity by geography

Market opportunity by geography ($ million)
Data Tables on Market opportunity by geography ($ million)

13. Drivers, Challenges, and Opportunity

13.1 Market drivers

Rising demand for functional and health-oriented formulations
Strategic expansion and penetration in emerging markets
Diversification of consumption occasions and targeted marketing

13.2 Market challenges

Regulatory tightening and age restrictions
Fiscal policies and tiered sugar taxation
Supply chain volatility and climate-induced disruption

13.3 Impact of drivers and challenges

Impact of drivers and challenges in 2025 and 2030

13.4 Market opportunities

Rise of cognitive enhancement and nootropic formulations
Aggressive regional expansion and localization in emerging markets
Tightening regulatory scrutiny and proactive reformulation

14. Competitive Landscape

14.1 Overview

14.2

Overview on criticality of inputs and factors of differentiation

14.3 Landscape disruption

Overview on factors of disruption

14.4 Industry risks

Impact of key risks on business

15. Competitive Analysis

15.1 Companies profiled

Companies covered

15.2 Company ranking index

15.3 Market positioning of companies

Matrix on companies position and classification

15.4 Amway Corp.

Amway Corp. - Overview
Amway Corp. - Product / Service
Amway Corp. - Key offerings
SWOT

15.5 Celsius Holdings Inc.

Celsius Holdings Inc. - Overview
Celsius Holdings Inc. - Product / Service
Celsius Holdings Inc. - Key offerings
SWOT

15.6 GOAT Fuel Inc.

GOAT Fuel Inc. - Overview
GOAT Fuel Inc. - Product / Service
GOAT Fuel Inc. - Key offerings
SWOT

15.7 Hype Energy Drinks

Hype Energy Drinks - Overview
Hype Energy Drinks - Product / Service
Hype Energy Drinks - Key offerings
SWOT

15.8 Keurig Dr Pepper Inc.

Keurig Dr Pepper Inc. - Overview
Keurig Dr Pepper Inc. - Business segments
Keurig Dr Pepper Inc. - Key offerings
Keurig Dr Pepper Inc. - Segment focus
SWOT

15.9 Living Essentials Marketing LLC

Living Essentials Marketing LLC - Overview
Living Essentials Marketing LLC - Product / Service
Living Essentials Marketing LLC - Key offerings
SWOT

15.10 Monster Beverage Corp.

Monster Beverage Corp. - Overview
Monster Beverage Corp. - Business segments
Monster Beverage Corp. - Key offerings
Monster Beverage Corp. - Segment focus
SWOT

15.11 Nutrabolt

Nutrabolt - Overview
Nutrabolt - Product / Service
Nutrabolt - Key offerings
SWOT

15.12 Otsuka Holdings Co. Ltd.

Otsuka Holdings Co. Ltd. - Overview
Otsuka Holdings Co. Ltd. - Business segments
Otsuka Holdings Co. Ltd. - Key offerings
Otsuka Holdings Co. Ltd. - Segment focus
SWOT

15.13 PepsiCo Inc.

PepsiCo Inc. - Overview
PepsiCo Inc. - Business segments
PepsiCo Inc. - Key news
PepsiCo Inc. - Key offerings
PepsiCo Inc. - Segment focus
SWOT

15.14 Red Bull GmbH

Red Bull GmbH - Overview
Red Bull GmbH - Product / Service
Red Bull GmbH - Key offerings
SWOT

15.15 Suntory Beverage and Food Ltd.

Suntory Beverage and Food Ltd. - Overview
Suntory Beverage and Food Ltd. - Business segments
Suntory Beverage and Food Ltd. - Key news
Suntory Beverage and Food Ltd. - Key offerings
Suntory Beverage and Food Ltd. - Segment focus
SWOT

15.16 TCP Group

TCP Group - Overview
TCP Group - Product / Service
TCP Group - Key offerings
SWOT

15.17 Uptime Energy Inc.

Uptime Energy Inc. - Overview
Uptime Energy Inc. - Product / Service
Uptime Energy Inc. - Key offerings
SWOT

15.18 Yerbae Brands Co.

Yerbae Brands Co. - Overview
Yerbae Brands Co. - Product / Service
Yerbae Brands Co. - Key offerings
SWOT

16. Appendix

16.1 Scope of the report

Market definition
Objectives
Notes and caveats

16.2 Inclusions and exclusions checklist

Inclusions checklist
Exclusions checklist

16.3 Currency conversion rates for US$

16.4 Research methodology

16.5 Data procurement

Information sources

16.6 Data validation

16.7 Validation techniques employed for market sizing

16.8 Data synthesis

16.9 360 degree market analysis

16.10 List of abbreviations

Research Methodology

Technavio presents a detailed picture of the market by way of study, synthesis, and summation of data from multiple sources. The analysts have presented the various facets of the market with a particular focus on identifying the key industry influencers. The data thus presented is comprehensive, reliable, and the result of extensive research, both primary and secondary.

INFORMATION SOURCES

Primary sources

  • Manufacturers and suppliers
  • Channel partners
  • Industry experts
  • Strategic decision makers

Secondary sources

  • Industry journals and periodicals
  • Government data
  • Financial reports of key industry players
  • Historical data
  • Press releases

DATA ANALYSIS

Data Synthesis

  • Collation of data
  • Estimation of key figures
  • Analysis of derived insights

Data Validation

  • Triangulation with data models
  • Reference against proprietary databases
  • Corroboration with industry experts

REPORT WRITING

Qualitative

  • Market drivers
  • Market challenges
  • Market trends
  • Five forces analysis

Quantitative

  • Market size and forecast
  • Market segmentation
  • Geographical insights
  • Competitive landscape

Interested in this report?

Get your sample now to see our research methodology and insights!

Download Now

Frequently Asked Questions

Energy Drinks market growth will increase by USD 57264.6 million during 2026-2030.

The Energy Drinks market is expected to grow at a CAGR of 8.9% during 2026-2030.

Energy Drinks market is segmented by Product (Sparkling energy drinks, Still energy drinks) Distribution channel (Offline, Online) Product type (Natural, Conventional)

Alani Nutrition LLC, Amway Corp., Celsius Holdings Inc., G Fuel, Ghost LLC, GOAT Fuel Inc., HELL ENERGY Magyarorszag Kft., Hype Energy Drinks, Keurig Dr Pepper Inc., Living Essentials Marketing LLC, Monster Beverage Corp., Nutrabolt, Otsuka Holdings Co. Ltd., PepsiCo Inc., Red Bull GmbH, Suntory Beverage and Food Ltd., TCP Group, Uptime Energy Inc., Yerbae Brands Co., ZOA Energy are a few of the key vendors in the Energy Drinks market.

APAC will register the highest growth rate of 38.8% among the other regions. Therefore, the Energy Drinks market in APAC is expected to garner significant business opportunities for the vendors during the forecast period.

Japan, China, India, South Korea, Indonesia, Thailand, US, Canada, Mexico, UK, Germany, France, Italy, Spain, Poland, Brazil, Argentina, Chile, UAE, Saudi Arabia, South Africa, Egypt, Nigeria

  • Rising demand for functional and health-oriented formulations is the driving factor this market.

The Energy Drinks market vendors should focus on grabbing business opportunities from the Product segment as it accounted for the largest market share in the base year.
RIA - Research AI Assistant
Ask RIA