Failure Analysis Test Equipment Market Analysis North America, APAC, Europe, Middle East and Africa, South America - US, China, Japan, Germany, France - Size and Forecast 2024-2028

Failure Analysis Test Equipment Market Analysis North America, APAC, Europe, Middle East and Africa, South America - US, China, Japan, Germany, France - Size and Forecast 2024-2028

Published: Dec 2023 176 Pages SKU: IRTNTR73582

Market Overview at a Glance

$2.31 B
Market Opportunity
7.59%
CAGR
7.43
YoY growth 2023-2024(%)

Failure Analysis Test Equipment Market Size 2024-2028 

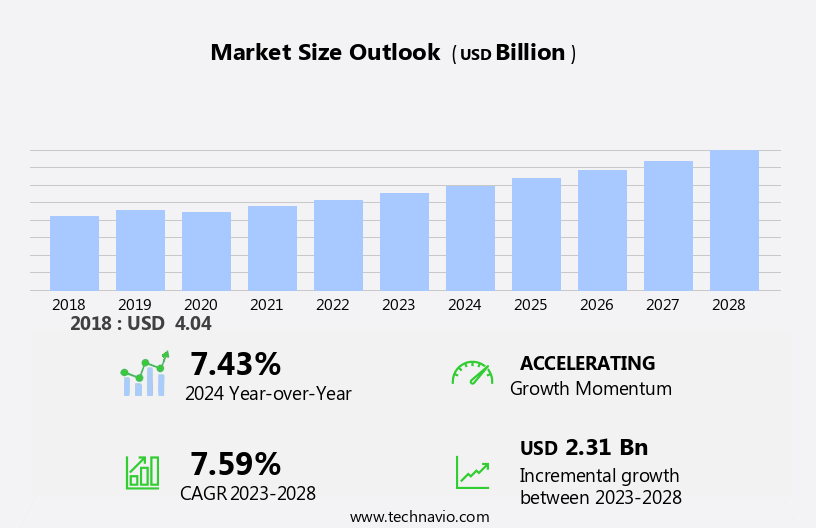
The failure analysis test equipment market size is forecast to increase by USD 2.31 billion at a CAGR of 7.59% between 2023 and 2028.

  • In the realm of industrial science, the significance of failure analysis has grown exponentially in various industries and research institutions. This trend is driven by the need for reliable information to minimize equipment downtime and prevent future occurrences of failures. One of the key tools utilized in failure analysis is the electron microscope, which plays a crucial role in investigating the root cause of structures, components, and assemblies. The market for failure analysis test equipment is witnessing an increasing demand, particularly from research institutions.
  • Moreover, the availability of numerous resellers and a limited number of companies offering refurbished equipment has made it an attractive option for cost-conscious buyers. This efficiency-driven approach is essential in today's business landscape, especially in emerging economies where industrial growth is on the rise. The maintenance costs associated with failure analysis equipment can be substantial, making it a worthwhile investment to ensure optimal efficiency and productivity. Failure analysis tools play a crucial role in the production process of various electronic products, including smartphones, tablets computers, sensors, wearables, white goods, and industrial robots.

What will be the Size of the Market During the Forecast Period?

Failure Analysis Test Equipment Market Size

 Request Free Sample

  • The market encompasses a range of sophisticated instruments designed to investigate and determine the root causes of component failures in various industries. This market caters to critical applications where machine failures can result in significant downtime, financial losses, and safety concerns. Failure analysis is a crucial aspect of quality inspection in manufacturing processes, ensuring the production of reliable and high-performing products. The primary focus of failure analysis test equipment is to facilitate physical investigation, enabling manufacturers to identify and address manufacturing defects and other issues that may impact product quality and reliability.
  • Similarly, several types of equipment are utilized in failure analysis, including optical microscopes, scanning probe microscopes, transmission electron microscopes, scanning electron microscopes, focused ion beams, and dual beam systems. These tools offer varying levels of resolution and analysis capabilities, catering to different target segments and applications. The miniaturization trend in various industries, driven by advancements in nanotechnology, has led to an increased demand for high-resolution and precise failure analysis equipment. This trend is particularly evident in emerging economies, where the manufacturing sector is rapidly expanding and competition is fierce. Machine failures can result in significant maintenance costs and production downtime.
  • By employing advanced failure analysis test equipment, manufacturers can efficiently identify and address issues, reducing downtime and minimizing maintenance expenses. Moreover, these tools enable manufacturers to improve their production processes, ensuring the consistent delivery of high-quality products. Critical applications, such as aerospace, automotive, and electronics, rely heavily on failure analysis test equipment to maintain product reliability and safety. In these industries, even minor component failures can result in catastrophic consequences, making the role of failure analysis test equipment indispensable. The market is expected to grow significantly in the coming years, driven by the increasing demand for high-quality products, the miniaturization trend, and the growing importance of nanotechnology in various industries.
  • As the market evolves, manufacturers will continue to seek advanced and efficient solutions to meet their failure analysis needs, further fueling market growth. In conclusion, the market plays a vital role in ensuring product reliability and quality in various industries. By facilitating physical investigation and failure determination, these tools enable manufacturers to address manufacturing defects and other issues, reducing downtime, minimizing maintenance costs, and improving overall efficiency. The market is expected to continue growing, driven by the increasing demand for high-resolution analysis capabilities, the miniaturization trend, and the growing importance of nanotechnology in manufacturing processes.

How is this market segmented and which is the largest segment?

The market research report provides comprehensive data (region-wise segment analysis), with forecasts and estimates in "USD billion" for the period 2024-2028, as well as historical data from 2018-2022 for the following segments.

  • Application
    • Electronics and semiconductors
    • Industrial science
    • Material science
    • Bioscience
  • Product
    • Focused ion beam
    • Dual beam system
    • Electron microscope
  • Geography
    • North America
      • US
    • APAC
      • China
      • Japan
    • Europe
      • Germany
      • France
    • Middle East and Africa
    • South America

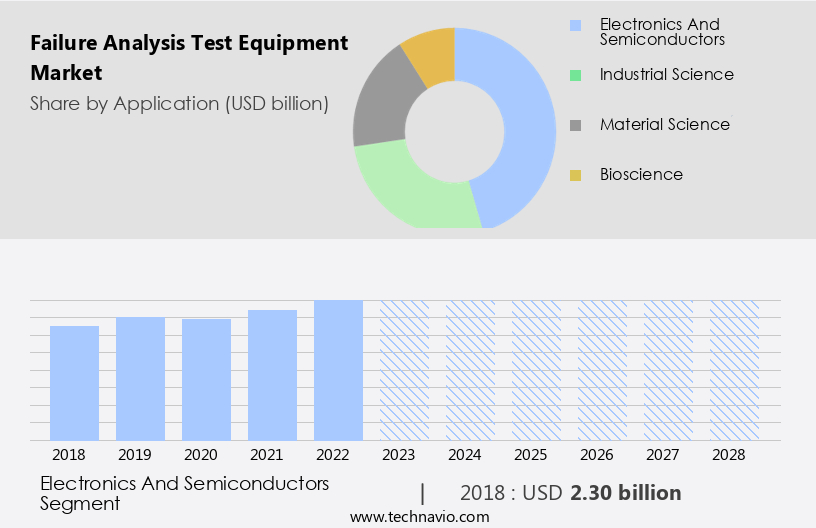
By Application Insights

  • The electronics and semiconductors segment is estimated to witness significant growth during the forecast period.

The market in the electronics and semiconductor industry is experiencing notable growth due to increasing digitization and the shift towards advanced electronic equipment in the global market. This sector encompasses electrical and mechanical engineering, nano-precision and submicron technology, and photonics production. Precise and dependable testing and measurement are essential in all stages of semiconductor manufacturing to guarantee the end product's accuracy and stability. With numerous design and fabrication firms engaged in semiconductor manufacturing, per-part-related recurring costs have emerged as a significant concern. Failure analysis techniques, including Ion Mass Spectroscopy (IMS), Chemical Mechanical Planarization (CMP), Broad Ion Milling, Reactive Ion Etching, and others, are crucial for identifying defects and flaws in semiconductor products.

International bodies and quality control requirements mandate the use of these techniques to prevent infrastructure failures, leakages, and other issues in nuclear refineries and other critical applications. In the US market, these techniques are gaining popularity due to the increasing demand for high-performance, reliable electronics and semiconductors. Failure analysis test equipment is a vital investment for companies seeking to maintain product usage specifications and meet quality control requirements. By utilizing advanced failure analysis techniques, firms can minimize downtime, reduce costs, and improve overall product quality. In summary, the market in the US electronics and semiconductor industry is experiencing growth due to the need for precise testing and measurement to ensure product accuracy and stability. The use of advanced techniques, such as IMS, CMP, Broad Ion Milling, and Reactive Ion Etching, is essential for identifying defects and maintaining quality control requirements in the manufacturing process.

Failure Analysis Test Equipment Market Size

Get a glance at the market report of share of various segments Request Free Sample

The electronics and semiconductors segment was valued at USD 2.30 billion in 2018 and showed a gradual increase during the forecast period.

Regional Analysis

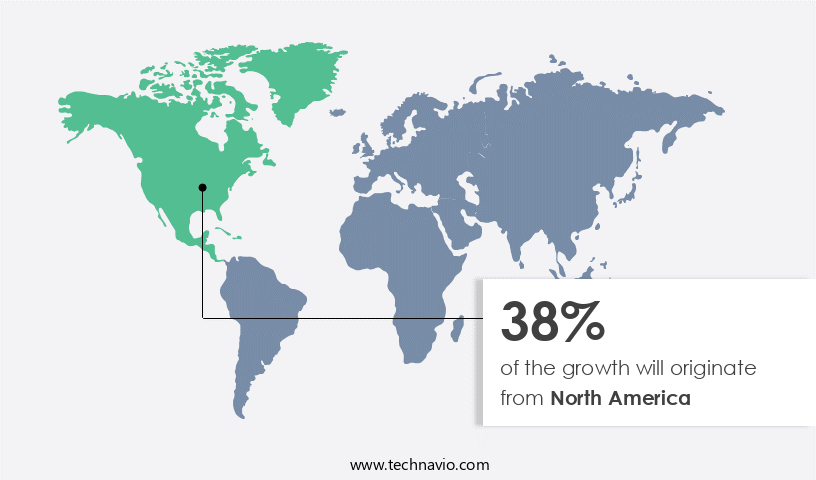
  • North America is estimated to contribute 38% to the growth of the global market during the forecast period.

Technavio's analysts have elaborately explained the regional trends and drivers that shape the market during the forecast period.

Failure Analysis Test Equipment Market Share by Geography

For more insights on the market share of various regions Request Free Sample

In North America, the investment in research and development (R&D) by businesses, governments, and research institutions is significant. Given the importance of failure analysis in scientific research projects, there is a substantial demand for failure analysis test equipment in this region. North America is a global hub for manufacturing industries such as aerospace and defense, medical devices, and industrial equipment. Consequently, there is a constant need for new materials like alloys, ceramics, composites, and polymers to support these sectors. The high usage of microprocessors in these industries further amplifies the demand for these electronic components.

Furthermore, the automation of manufacturing processes, particularly in the production of 3D integrated circuits, has led to an increased reliance on advanced inspection technologies. Failure analysis test equipment enables manufacturers to identify and rectify defects at the earliest stages of production, reducing the overall cost of manufacturing and improving product quality. In summary, the demand for failure analysis test equipment in North America is driven by the region's leading role in R&D investments, advanced manufacturing industries, and the increasing automation of production processes. The need for high-performance materials and microprocessors in industries such as aerospace and defense, medical devices, and industrial equipment further fuels the demand for this equipment.

Market Dynamics

Our researchers analyzed the data with 2023 as the base year, along with the key drivers, trends, and challenges. A holistic analysis of drivers will help companies refine their marketing strategies to gain a competitive advantage.

What are the key market drivers leading to the rise in adoption of Failure Analysis Test Equipment Market?

The increasing importance of failure analysis in industries and research institutions is the key driver of the market.

  • Failure analysis testing plays a crucial role in various industries, including aerospace and defense, automotive, and electronics, by identifying the root cause of product failures. This process involves examining failed components or devices using advanced microscopic techniques, such as Optical microscopes, Scanning probe microscopes, Transmission Electron Microscopes, and Scanning Electron Microscopes. These tools enable the investigation of structures, components, and assemblies at the nanometer level. Failure analysis testing is essential for quality control and reliability in manufacturing processes, including Semiconductor devices, Chemical Mechanical Planarization, Broad Ion Milling, Reactive Ion Etching, and others. The analysis of defects and flaws can lead to improvements in product usage specifications and quality control requirements.
  • Furthermore, failure analysis techniques are also critical in infrastructure industries, such as nuclear refineries and pipelines, where catastrophic events like leakages, nuclear refinery blasts, and pipeline explosions can occur. These events can result in significant consequential damages to humans and the environment. In the semiconductor industry, failure analysis tools are used for circuit editing, elemental analysis, and mass production of electronic products like smartphones, tablets, sensors, industrial equipment, wearables, white goods, and industrial robots. The miniaturization trend in electronics necessitates the use of advanced microscopes like electron microscopes, scanning probe microscopes, digital microscopes, and compound microscopes to ensure efficient failure analysis.
  • Additionally, failure analysis testing is a complex process that requires the expertise of physicists and laboratory technicians. It involves the use of techniques like Ion Mass Spectroscopy and Raman spectroscopy to determine the chemical composition of materials. The data collected during the analysis is used to understand the failure mechanism and prevent future occurrences. International bodies and regulatory approval agencies require reliable information on failure analysis to ensure the safety and efficiency of products and systems. Failure analysis testing is a proactive approach to prevent equipment downtime and reduce maintenance costs. In emerging economies, the adoption of failure analysis testing is increasing to meet the growing demand for high-quality products and services.

What are the market trends shaping the Failure Analysis Test Equipment Market?

Growing demand for tabletop electron microscopes from research institutions is the upcoming trend in the market.

  • The market encompasses various microscopes and analytical tools used to determine the causes of defects and failures in components, devices, and systems, particularly in the semiconductor industry and manufacturing processes. Optical microscopes, Scanning Probe Microscopes (SPMs), Transmission Electron Microscopes (TEMs), and Scanning Electron Microscopes (SEMs) are essential instruments for failure analysis. Advanced microscopes like Focused Ion Beam (FIB) and Dual beam systems enable data collection through techniques such as Ion Mass Spectroscopy, Chemical Mechanical Planarization, Broad Ion Milling, and Reactive Ion Etching. Failure analysis techniques are crucial for various industries, including electronics, automotive, medical, and industrial, to ensure quality, reliability, and regulatory approval.
  • Moreover, failures, such as leakages, infrastructure, and equipment, can result in significant consequential damages to humans and the environment. Therefore, understanding the failure mechanism through physical investigation is essential for maintenance costs, efficiency, and preventing future occurrences. Tabletop electron microscopes, such as electron and SPMs, are increasingly popular due to their affordability and ease of use compared to conventional electron microscopes. These microscopes cater to the needs of small-scale industries, pathological laboratories, and academic institutions. Raman spectroscopy, Atomic Force Microscopy, and Optical microscopy are other essential techniques for elemental analysis and material sciences.
  • In conclusion, failure analysis tools play a vital role in industries such as robotics, automation, 3D Integrated Circuits, prototyping, and inspection. As the trend towards miniaturization continues, failure analysis becomes increasingly important for mass production and electronic products like smartphones, tablets, sensors, and industrial equipment. The market is expected to grow significantly due to the increasing demand for reliable information and the need to minimize equipment downtime.

What challenges does Failure Analysis Test Equipment Market face during its growth?

A large number of resellers and few market players offering refurbished equipment is a key challenge affecting the market growth.

  • The market experiences continuous growth due to the increasing demand for advanced testing solutions in various industries. Optical microscopes, Scanning Probe Microscopes (SPMs), Transmission Electron Microscopes (TEMs), Scanning Electron Microscopes (SEMs), Focused Ion Beams (FIBs), and Dual beam systems are integral components of this market. These tools enable data collection for failure determination in semiconductor devices, manufacturing processes, and systems. Failure analysis techniques are essential for identifying defects, flaws, and product usage specifications that do not meet quality control requirements. Consequently, industries such as semiconductors and electronics, automotive components, medical devices, and industrial equipment rely heavily on these tools for reliability and quality assurance.
  • In addition, international bodies and regulatory approvals mandate the use of these tools for infrastructure failures, including leakages in nuclear refineries, pipeline explosions, and refinery blasts. Failure mechanism analysis is crucial for preventing future occurrences and minimizing consequential damages to humans and the environment. Failure analysis tools are indispensable for various industries, including pathological laboratories, small-scale industries, and research institutions. Technologies such as Raman spectroscopy, Atomic Force Microscopy (AFM), and Optical microscopy are essential for compound microscopes, advanced microscopes, and material sciences. Physicists and laboratory technicians use these tools for circuit editing, elemental analysis, and nanometer-level measurements. The semiconductor industry, robotics, automation, 3D Integrated Circuits (3D ICs), prototyping, and inspection are some of the significant applications of failure analysis tools.
  • In conclusion, the market for failure analysis test equipment is driven by the miniaturization trend in electronic products, including smartphones, tablets, sensors, industrial equipment, wearables, white goods, and industrial robots. Mass production and electronic devices' increasing complexity necessitate reliable information, efficient maintenance, and effective quality inspection. Manufacturing defects and nanotechnology are significant challenges for the market. However, emerging economies' growing industrialization and infrastructure development provide ample opportunities for market growth. In conclusion, failure analysis test equipment plays a vital role in various industries, from electronics and material sciences to bioscience and industrial science. These tools enable physical investigation, maintenance cost reduction, and efficiency improvements, making them indispensable for ensuring product reliability and preventing equipment downtime.

Exclusive Customer Landscape

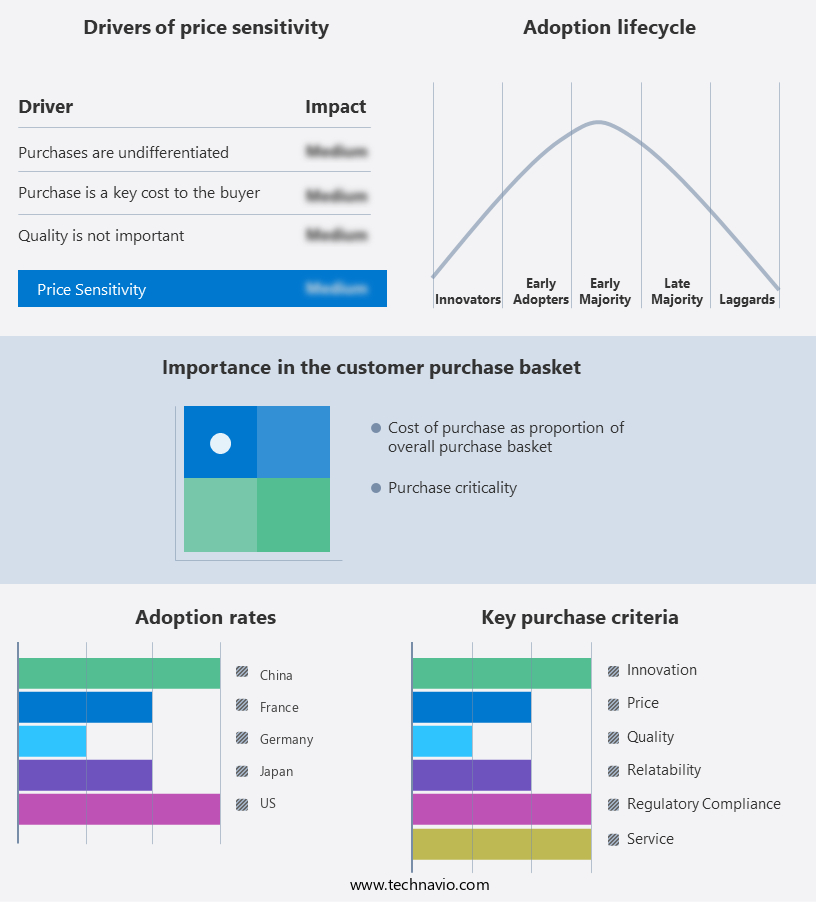
The market forecasting report includes the adoption lifecycle of the market, covering from the innovator's stage to the laggard's stage. It focuses on adoption rates in different regions based on penetration. Furthermore, the market report also includes key purchase criteria and drivers of price sensitivity to help companies evaluate and develop their market growth analysis strategies.

Failure Analysis Test Equipment Market Share by Geography

 Customer Landscape

Key Companies & Market Insights

Companies are implementing various strategies, such as strategic alliances, market forecast, partnerships, mergers and acquisitions, geographical expansion, and product/service launches, to enhance their presence in the market. The market research and growth report includes detailed analyses of the competitive landscape of the market and information about key companies, including:

  • Asahi Kasei Microdevices Corp.
  • Bruker Corp.
  • Carl Zeiss Stiftung
  • Danaher Corp.
  • Eurofins Scientific SE
  • Exponent Inc.
  • Hitachi Ltd.
  • HORIBA Ltd.
  • Intertek Group Plc
  • IXRF Inc.
  • JFE Techno Research Corp.
  • Oxford Instruments plc
  • Richter Precision Inc.
  • TESTiLABS Oy
  • Thermo Fisher Scientific Inc.
  • Motion X Corp.
  • TESCAN GROUP
  • VIDEOTON HOLDING ZRt

Qualitative and quantitative analysis of companies has been conducted to help clients understand the wider business environment as well as the strengths and weaknesses of key market players. Data is qualitatively analyzed to categorize companies as pure play, category-focused, industry-focused, and diversified; it is quantitatively analyzed to categorize companies as dominant, leading, strong, tentative, and weak.

Research Analyst Overview

Failure analysis is a crucial aspect of ensuring the quality and reliability of various components, devices, and systems, particularly in industries such as semiconductors and electronics. Advanced microscopes, including optical, scanning probe, transmission electron, and scanning electron microscopes, play a significant role in failure determination. These instruments enable the examination of structures at the nanometer level, revealing defects and flaws that may impact product usage specifications and quality control requirements. Failure analysis techniques employ various tools like focused ion beam, dual beam systems, ion mass spectroscopy, and chemical mechanical planarization. These methods help identify failure mechanisms in semiconductor devices and manufacturing processes, enabling preventive measures and reducing equipment downtime.

International bodies oversee regulatory approval processes, ensuring that failure analysis tools meet stringent standards. Failure analysis is not limited to large industries; small-scale industries and pathological laboratories also rely on these techniques for quality inspection and recurrent expenses. Failure analysis is essential for various sectors, including automotive components, medical devices, and industrial equipment. It helps determine the root cause of infrastructure failures, such as leakages in nuclear refineries or pipeline explosions, and prevents future occurrences. Failure analysis tools are indispensable for industries undergoing miniaturization trends, such as nanoelectronics, optoelectronics, and quantum dots. Physicists and laboratory technicians employ these tools for elemental analysis, circuit editing, and material sciences, contributing to the semiconductor industry's growth and innovation.

In conclusion, failure analysis is a vital aspect of maintaining efficient and reliable equipment, ensuring the safety of humans and the environment, and preventing consequential damages. Advanced microscopes and analysis tools play a pivotal role in this process, enabling the identification and resolution of even the smallest defects.

Market Scope

Report Coverage

Details

Page number

176

Base year

2023

Historic period

2018-2022

Forecast period

2024-2028

Growth momentum & CAGR

Accelerate at a CAGR of 7.59%

Market growth 2024-2028

USD 2.31 billion

Market structure

Fragmented

YoY growth 2023-2024(%)

7.43

Key countries

US, China, Japan, Germany, and France

Competitive landscape

Leading Companies, Market Positioning of Companies, Competitive Strategies, and Industry Risks

Request Free Sample

What are the Key Data Covered in this Market Research and Growth Report?

  • CAGR of the market during the forecast period
  • Detailed information on factors that will drive the market growth and forecasting between 2024 and 2028
  • Precise estimation of the size of the market  and its contribution of the market in focus to the parent market
  • Accurate predictions about upcoming market growth and trends and changes in consumer behaviour
  • Growth of the market across North America, APAC, Europe, Middle East and Africa, and South America
  • Thorough analysis of the market's competitive landscape and detailed information about companies
  • Comprehensive analysis of factors that will challenge the growth of market companies

We can help! Our analysts can customize this market research report to meet your requirements. Get in touch

1 Executive Summary

  • 1.1 Market overview
    • Exhibit 01: Executive Summary – Chart on Market Overview
    • Exhibit 02: Executive Summary – Data Table on Market Overview
    • Exhibit 03: Executive Summary – Chart on Global Market Characteristics
    • Exhibit 04: Executive Summary – Chart on Market by Geography
    • Exhibit 05: Executive Summary – Chart on Market Segmentation by Application
    • Exhibit 06: Executive Summary – Chart on Market Segmentation by Product
    • Exhibit 07: Executive Summary – Chart on Incremental Growth
    • Exhibit 08: Executive Summary – Data Table on Incremental Growth
    • Exhibit 09: Executive Summary – Chart on Vendor Market Positioning

2 Market Landscape

  • 2.1 Market ecosystem
    • Exhibit 10: Parent market
    • Exhibit 11: Market Characteristics

3 Market Sizing

  • 3.1 Market definition
    • Exhibit 12: Offerings of vendors included in the market definition
  • 3.2 Market segment analysis
    • Exhibit 13: Market segments
  • 3.3 Market size 2023
    • 3.4 Market outlook: Forecast for 2023-2028
      • Exhibit 14: Chart on Global - Market size and forecast 2023-2028 ($ billion)
      • Exhibit 15: Data Table on Global - Market size and forecast 2023-2028 ($ billion)
      • Exhibit 16: Chart on Global Market: Year-over-year growth 2023-2028 (%)
      • Exhibit 17: Data Table on Global Market: Year-over-year growth 2023-2028 (%)

    4 Historic Market Size

    • 4.1 Global failure analysis test equipment market 2018 - 2022
      • Exhibit 18: Historic Market Size – Data Table on global failure analysis test equipment market 2018 - 2022 ($ billion)
    • 4.2 Application Segment Analysis 2018 - 2022
      • Exhibit 19: Historic Market Size – Application Segment 2018 - 2022 ($ billion)
    • 4.3 Product Segment Analysis 2018 - 2022
      • Exhibit 20: Historic Market Size – Product Segment 2018 - 2022 ($ billion)
    • 4.4 Geography Segment Analysis 2018 - 2022
      • Exhibit 21: Historic Market Size – Geography Segment 2018 - 2022 ($ billion)
    • 4.5 Country Segment Analysis 2018 - 2022
      • Exhibit 22: Historic Market Size – Country Segment 2018 - 2022 ($ billion)

    5 Five Forces Analysis

    • 5.1 Five forces summary
      • Exhibit 23: Five forces analysis - Comparison between 2023 and 2028
    • 5.2 Bargaining power of buyers
      • Exhibit 24: Chart on Bargaining power of buyers – Impact of key factors 2023 and 2028
    • 5.3 Bargaining power of suppliers
      • Exhibit 25: Bargaining power of suppliers – Impact of key factors in 2023 and 2028
    • 5.4 Threat of new entrants
      • Exhibit 26: Threat of new entrants – Impact of key factors in 2023 and 2028
    • 5.5 Threat of substitutes
      • Exhibit 27: Threat of substitutes – Impact of key factors in 2023 and 2028
    • 5.6 Threat of rivalry
      • Exhibit 28: Threat of rivalry – Impact of key factors in 2023 and 2028
    • 5.7 Market condition
      • Exhibit 29: Chart on Market condition - Five forces 2023 and 2028

    6 Market Segmentation by Application

    • 6.1 Market segments
      • Exhibit 30: Chart on Application - Market share 2023-2028 (%)
      • Exhibit 31: Data Table on Application - Market share 2023-2028 (%)
    • 6.2 Comparison by Application
      • Exhibit 32: Chart on Comparison by Application
      • Exhibit 33: Data Table on Comparison by Application
    • 6.3 Electronics and semiconductors - Market size and forecast 2023-2028
      • Exhibit 34: Chart on Electronics and semiconductors - Market size and forecast 2023-2028 ($ billion)
      • Exhibit 35: Data Table on Electronics and semiconductors - Market size and forecast 2023-2028 ($ billion)
      • Exhibit 36: Chart on Electronics and semiconductors - Year-over-year growth 2023-2028 (%)
      • Exhibit 37: Data Table on Electronics and semiconductors - Year-over-year growth 2023-2028 (%)
    • 6.4 Industrial science - Market size and forecast 2023-2028
      • Exhibit 38: Chart on Industrial science - Market size and forecast 2023-2028 ($ billion)
      • Exhibit 39: Data Table on Industrial science - Market size and forecast 2023-2028 ($ billion)
      • Exhibit 40: Chart on Industrial science - Year-over-year growth 2023-2028 (%)
      • Exhibit 41: Data Table on Industrial science - Year-over-year growth 2023-2028 (%)
    • 6.5 Material science - Market size and forecast 2023-2028
      • Exhibit 42: Chart on Material science - Market size and forecast 2023-2028 ($ billion)
      • Exhibit 43: Data Table on Material science - Market size and forecast 2023-2028 ($ billion)
      • Exhibit 44: Chart on Material science - Year-over-year growth 2023-2028 (%)
      • Exhibit 45: Data Table on Material science - Year-over-year growth 2023-2028 (%)
    • 6.6 Bioscience - Market size and forecast 2023-2028
      • Exhibit 46: Chart on Bioscience - Market size and forecast 2023-2028 ($ billion)
      • Exhibit 47: Data Table on Bioscience - Market size and forecast 2023-2028 ($ billion)
      • Exhibit 48: Chart on Bioscience - Year-over-year growth 2023-2028 (%)
      • Exhibit 49: Data Table on Bioscience - Year-over-year growth 2023-2028 (%)
    • 6.7 Market opportunity by Application
      • Exhibit 50: Market opportunity by Application ($ billion)
      • Exhibit 51: Data Table on Market opportunity by Application ($ billion)

    7 Market Segmentation by Product

    • 7.1 Market segments
      • Exhibit 52: Chart on Product - Market share 2023-2028 (%)
      • Exhibit 53: Data Table on Product - Market share 2023-2028 (%)
    • 7.2 Comparison by Product
      • Exhibit 54: Chart on Comparison by Product
      • Exhibit 55: Data Table on Comparison by Product
    • 7.3 Focused ion beam - Market size and forecast 2023-2028
      • Exhibit 56: Chart on Focused ion beam - Market size and forecast 2023-2028 ($ billion)
      • Exhibit 57: Data Table on Focused ion beam - Market size and forecast 2023-2028 ($ billion)
      • Exhibit 58: Chart on Focused ion beam - Year-over-year growth 2023-2028 (%)
      • Exhibit 59: Data Table on Focused ion beam - Year-over-year growth 2023-2028 (%)
    • 7.4 Dual beam system - Market size and forecast 2023-2028
      • Exhibit 60: Chart on Dual beam system - Market size and forecast 2023-2028 ($ billion)
      • Exhibit 61: Data Table on Dual beam system - Market size and forecast 2023-2028 ($ billion)
      • Exhibit 62: Chart on Dual beam system - Year-over-year growth 2023-2028 (%)
      • Exhibit 63: Data Table on Dual beam system - Year-over-year growth 2023-2028 (%)
    • 7.5 Electron microscope - Market size and forecast 2023-2028
      • Exhibit 64: Chart on Electron microscope - Market size and forecast 2023-2028 ($ billion)
      • Exhibit 65: Data Table on Electron microscope - Market size and forecast 2023-2028 ($ billion)
      • Exhibit 66: Chart on Electron microscope - Year-over-year growth 2023-2028 (%)
      • Exhibit 67: Data Table on Electron microscope - Year-over-year growth 2023-2028 (%)
    • 7.6 Market opportunity by Product
      • Exhibit 68: Market opportunity by Product ($ billion)
      • Exhibit 69: Data Table on Market opportunity by Product ($ billion)

    8 Customer Landscape

    • 8.1 Customer landscape overview
      • Exhibit 70: Analysis of price sensitivity, lifecycle, customer purchase basket, adoption rates, and purchase criteria

    9 Geographic Landscape

    • 9.1 Geographic segmentation
      • Exhibit 71: Chart on Market share by geography 2023-2028 (%)
      • Exhibit 72: Data Table on Market share by geography 2023-2028 (%)
    • 9.2 Geographic comparison
      • Exhibit 73: Chart on Geographic comparison
      • Exhibit 74: Data Table on Geographic comparison
    • 9.3 North America - Market size and forecast 2023-2028
      • Exhibit 75: Chart on North America - Market size and forecast 2023-2028 ($ billion)
      • Exhibit 76: Data Table on North America - Market size and forecast 2023-2028 ($ billion)
      • Exhibit 77: Chart on North America - Year-over-year growth 2023-2028 (%)
      • Exhibit 78: Data Table on North America - Year-over-year growth 2023-2028 (%)
    • 9.4 APAC - Market size and forecast 2023-2028
      • Exhibit 79: Chart on APAC - Market size and forecast 2023-2028 ($ billion)
      • Exhibit 80: Data Table on APAC - Market size and forecast 2023-2028 ($ billion)
      • Exhibit 81: Chart on APAC - Year-over-year growth 2023-2028 (%)
      • Exhibit 82: Data Table on APAC - Year-over-year growth 2023-2028 (%)
    • 9.5 Europe - Market size and forecast 2023-2028
      • Exhibit 83: Chart on Europe - Market size and forecast 2023-2028 ($ billion)
      • Exhibit 84: Data Table on Europe - Market size and forecast 2023-2028 ($ billion)
      • Exhibit 85: Chart on Europe - Year-over-year growth 2023-2028 (%)
      • Exhibit 86: Data Table on Europe - Year-over-year growth 2023-2028 (%)
    • 9.6 Middle East and Africa - Market size and forecast 2023-2028
      • Exhibit 87: Chart on Middle East and Africa - Market size and forecast 2023-2028 ($ billion)
      • Exhibit 88: Data Table on Middle East and Africa - Market size and forecast 2023-2028 ($ billion)
      • Exhibit 89: Chart on Middle East and Africa - Year-over-year growth 2023-2028 (%)
      • Exhibit 90: Data Table on Middle East and Africa - Year-over-year growth 2023-2028 (%)
    • 9.7 South America - Market size and forecast 2023-2028
      • Exhibit 91: Chart on South America - Market size and forecast 2023-2028 ($ billion)
      • Exhibit 92: Data Table on South America - Market size and forecast 2023-2028 ($ billion)
      • Exhibit 93: Chart on South America - Year-over-year growth 2023-2028 (%)
      • Exhibit 94: Data Table on South America - Year-over-year growth 2023-2028 (%)
    • 9.8 US - Market size and forecast 2023-2028
      • Exhibit 95: Chart on US - Market size and forecast 2023-2028 ($ billion)
      • Exhibit 96: Data Table on US - Market size and forecast 2023-2028 ($ billion)
      • Exhibit 97: Chart on US - Year-over-year growth 2023-2028 (%)
      • Exhibit 98: Data Table on US - Year-over-year growth 2023-2028 (%)
    • 9.9 China - Market size and forecast 2023-2028
      • Exhibit 99: Chart on China - Market size and forecast 2023-2028 ($ billion)
      • Exhibit 100: Data Table on China - Market size and forecast 2023-2028 ($ billion)
      • Exhibit 101: Chart on China - Year-over-year growth 2023-2028 (%)
      • Exhibit 102: Data Table on China - Year-over-year growth 2023-2028 (%)
    • 9.10 Japan - Market size and forecast 2023-2028
      • Exhibit 103: Chart on Japan - Market size and forecast 2023-2028 ($ billion)
      • Exhibit 104: Data Table on Japan - Market size and forecast 2023-2028 ($ billion)
      • Exhibit 105: Chart on Japan - Year-over-year growth 2023-2028 (%)
      • Exhibit 106: Data Table on Japan - Year-over-year growth 2023-2028 (%)
    • 9.11 Germany - Market size and forecast 2023-2028
      • Exhibit 107: Chart on Germany - Market size and forecast 2023-2028 ($ billion)
      • Exhibit 108: Data Table on Germany - Market size and forecast 2023-2028 ($ billion)
      • Exhibit 109: Chart on Germany - Year-over-year growth 2023-2028 (%)
      • Exhibit 110: Data Table on Germany - Year-over-year growth 2023-2028 (%)
    • 9.12 France - Market size and forecast 2023-2028
      • Exhibit 111: Chart on France - Market size and forecast 2023-2028 ($ billion)
      • Exhibit 112: Data Table on France - Market size and forecast 2023-2028 ($ billion)
      • Exhibit 113: Chart on France - Year-over-year growth 2023-2028 (%)
      • Exhibit 114: Data Table on France - Year-over-year growth 2023-2028 (%)
    • 9.13 Market opportunity by geography
      • Exhibit 115: Market opportunity by geography ($ billion)
      • Exhibit 116: Data Tables on Market opportunity by geography ($ billion)

    10 Drivers, Challenges, and Trends

    • 10.1 Market drivers
      • 10.2 Market challenges
        • 10.3 Impact of drivers and challenges
          • Exhibit 117: Impact of drivers and challenges in 2023 and 2028
        • 10.4 Market trends

          11 Vendor Landscape

          • 11.1 Overview
            • 11.2 Vendor landscape
              • Exhibit 118: Overview on Criticality of inputs and Factors of differentiation
            • 11.3 Landscape disruption
              • Exhibit 119: Overview on factors of disruption
            • 11.4 Industry risks
              • Exhibit 120: Impact of key risks on business

            12 Vendor Analysis

            • 12.1 Vendors covered
              • Exhibit 121: Vendors covered
            • 12.2 Market positioning of vendors
              • Exhibit 122: Matrix on vendor position and classification
            • 12.3 Bruker Corp.
              • Exhibit 123: Bruker Corp. - Overview
              • Exhibit 124: Bruker Corp. - Business segments
              • Exhibit 125: Bruker Corp. - Key news
              • Exhibit 126: Bruker Corp. - Key offerings
              • Exhibit 127: Bruker Corp. - Segment focus
            • 12.4 Carl Zeiss Stiftung
              • Exhibit 128: Carl Zeiss Stiftung - Overview
              • Exhibit 129: Carl Zeiss Stiftung - Business segments
              • Exhibit 130: Carl Zeiss Stiftung - Key offerings
              • Exhibit 131: Carl Zeiss Stiftung - Segment focus
            • 12.5 Danaher Corp.
              • Exhibit 132: Danaher Corp. - Overview
              • Exhibit 133: Danaher Corp. - Business segments
              • Exhibit 134: Danaher Corp. - Key news
              • Exhibit 135: Danaher Corp. - Key offerings
              • Exhibit 136: Danaher Corp. - Segment focus
            • 12.6 Eurofins Scientific SE
              • Exhibit 137: Eurofins Scientific SE - Overview
              • Exhibit 138: Eurofins Scientific SE - Business segments
              • Exhibit 139: Eurofins Scientific SE - Key news
              • Exhibit 140: Eurofins Scientific SE - Key offerings
              • Exhibit 141: Eurofins Scientific SE - Segment focus
            • 12.7 Hitachi Ltd.
              • Exhibit 142: Hitachi Ltd. - Overview
              • Exhibit 143: Hitachi Ltd. - Business segments
              • Exhibit 144: Hitachi Ltd. - Key news
              • Exhibit 145: Hitachi Ltd. - Key offerings
              • Exhibit 146: Hitachi Ltd. - Segment focus
            • 12.8 HORIBA Ltd.
              • Exhibit 147: HORIBA Ltd. - Overview
              • Exhibit 148: HORIBA Ltd. - Business segments
              • Exhibit 149: HORIBA Ltd. - Key offerings
              • Exhibit 150: HORIBA Ltd. - Segment focus
            • 12.9 Intertek Group Plc
              • Exhibit 151: Intertek Group Plc - Overview
              • Exhibit 152: Intertek Group Plc - Business segments
              • Exhibit 153: Intertek Group Plc - Key news
              • Exhibit 154: Intertek Group Plc - Key offerings
              • Exhibit 155: Intertek Group Plc - Segment focus
            • 12.10 IXRF Inc.
              • Exhibit 156: IXRF Inc. - Overview
              • Exhibit 157: IXRF Inc. - Product / Service
              • Exhibit 158: IXRF Inc. - Key offerings
            • 12.11 JFE Techno Research Corp.
              • Exhibit 159: JFE Techno Research Corp. - Overview
              • Exhibit 160: JFE Techno Research Corp. - Product / Service
              • Exhibit 161: JFE Techno Research Corp. - Key offerings
            • 12.12 Motion X Corp.
              • Exhibit 162: Motion X Corp. - Overview
              • Exhibit 163: Motion X Corp. - Product / Service
              • Exhibit 164: Motion X Corp. - Key offerings
            • 12.13 Oxford Instruments plc
              • Exhibit 165: Oxford Instruments plc - Overview
              • Exhibit 166: Oxford Instruments plc - Business segments
              • Exhibit 167: Oxford Instruments plc - Key offerings
              • Exhibit 168: Oxford Instruments plc - Segment focus
            • 12.14 Richter Precision Inc.
              • Exhibit 169: Richter Precision Inc. - Overview
              • Exhibit 170: Richter Precision Inc. - Product / Service
              • Exhibit 171: Richter Precision Inc. - Key offerings
            • 12.15 TESCAN GROUP
              • Exhibit 172: TESCAN GROUP - Overview
              • Exhibit 173: TESCAN GROUP - Product / Service
              • Exhibit 174: TESCAN GROUP - Key offerings
            • 12.16 Thermo Fisher Scientific Inc.
              • Exhibit 175: Thermo Fisher Scientific Inc. - Overview
              • Exhibit 176: Thermo Fisher Scientific Inc. - Business segments
              • Exhibit 177: Thermo Fisher Scientific Inc. - Key news
              • Exhibit 178: Thermo Fisher Scientific Inc. - Key offerings
              • Exhibit 179: Thermo Fisher Scientific Inc. - Segment focus
            • 12.17 VIDEOTON HOLDING ZRt
              • Exhibit 180: VIDEOTON HOLDING ZRt - Overview
              • Exhibit 181: VIDEOTON HOLDING ZRt - Product / Service
              • Exhibit 182: VIDEOTON HOLDING ZRt - Key offerings

            13 Appendix

            • 13.1 Scope of the report
              • 13.2 Inclusions and exclusions checklist
                • Exhibit 183: Inclusions checklist
                • Exhibit 184: Exclusions checklist
              • 13.3 Currency conversion rates for US$
                • Exhibit 185: Currency conversion rates for US$
              • 13.4 Research methodology
                • Exhibit 186: Research methodology
                • Exhibit 187: Validation techniques employed for market sizing
                • Exhibit 188: Information sources
              • 13.5 List of abbreviations
                • Exhibit 189: List of abbreviations

              Research Methodology

              Technavio presents a detailed picture of the market by way of study, synthesis, and summation of data from multiple sources. The analysts have presented the various facets of the market with a particular focus on identifying the key industry influencers. The data thus presented is comprehensive, reliable, and the result of extensive research, both primary and secondary.

              INFORMATION SOURCES

              Primary sources

              • Manufacturers and suppliers
              • Channel partners
              • Industry experts
              • Strategic decision makers

              Secondary sources

              • Industry journals and periodicals
              • Government data
              • Financial reports of key industry players
              • Historical data
              • Press releases

              DATA ANALYSIS

              Data Synthesis

              • Collation of data
              • Estimation of key figures
              • Analysis of derived insights

              Data Validation

              • Triangulation with data models
              • Reference against proprietary databases
              • Corroboration with industry experts

              REPORT WRITING

              Qualitative

              • Market drivers
              • Market challenges
              • Market trends
              • Five forces analysis

              Quantitative

              • Market size and forecast
              • Market segmentation
              • Geographical insights
              • Competitive landscape

              Interested in this report?

              Get your sample now to see our research methodology and insights!

              Download Now

              Frequently Asked Questions

              Failure Analysis Test Equipment market growth will increase by $ 2.31 bn during 2024-2028.

              The Failure Analysis Test Equipment market is expected to grow at a CAGR of 7.59% during 2024-2028.

              Failure Analysis Test Equipment market is segmented by Application( Electronics and semiconductors, Industrial science, Material science, Bioscience) Product( Focused ion beam, Dual beam system, Electron microscope, Middle East and Africa, South America)

              Asahi Kasei Microdevices Corp., Bruker Corp., Carl Zeiss Stiftung, Danaher Corp., Eurofins Scientific SE, Exponent Inc., Hitachi Ltd., HORIBA Ltd., Intertek Group Plc, IXRF Inc., JFE Techno Research Corp., Oxford Instruments plc, Richter Precision Inc., TESTiLABS Oy, Thermo Fisher Scientific Inc., Motion X Corp., TESCAN GROUP, VIDEOTON HOLDING ZRt are a few of the key vendors in the Failure Analysis Test Equipment market.

              North America will register the highest growth rate of 38% among the other regions. Therefore, the Failure Analysis Test Equipment market in North America is expected to garner significant business opportunities for the vendors during the forecast period.

              US, China, Japan, Germany, France

              • Increasing importance of failure analysis in industries and research institutionsFailure analysis testing is increasingly becoming a very important tool for selecting any materials such as semiconductors is the driving factor this market.
              • rubbers is the driving factor this market.
              • and polymers in a range of industries is the driving factor this market.
              • including aerospace and defense is the driving factor this market.
              • automobile is the driving factor this market.
              • and electronics. In a failure analysis test is the driving factor this market.
              • a failed product is subjected to microscopic examination to ascertain the cause of failure to prevent a defect in the design is the driving factor this market.
              • manufacturing is the driving factor this market.
              • or raw material. Moreover is the driving factor this market.
              • the use of failure analysis techniques also allows the preparation of a standard operating procedure for operating any equipment to prevent its failure before it reaches the end of its lifecycle. Also is the driving factor this market.
              • if there is no possibility of preventing a device from failing is the driving factor this market.
              • failure analysis testing can be used to improve the subsequent version of the product by analyzing the causes of possible defects in earlier versions. All these reasons are leading to failure analysis test equipment becoming increasingly important in industrial and research applications. An electron microscope is the driving factor this market.
              • which is a type of failure analysis test equipment is the driving factor this market.
              • can be used to produce a very high-resolution image of a sample. For instance is the driving factor this market.
              • an SEM is used to capture an image of a sample by analyzing the movement of electrons that are reflected from the surface of the sample. Certain applications is the driving factor this market.
              • such as in the electronics industry is the driving factor this market.
              • require examination of the very thin surface of a sample. Such a sample is examined using a TEM. The image from TEM is captured by analyzing the movement of a beam of electrons that traverse the thin surface. However is the driving factor this market.
              • the thin surface is produced using an FIB is the driving factor this market.
              • which is used to mill the surface of a sample. Thus is the driving factor this market.
              • FIB and TEM are used to examine samples with very thin surfaces. A dual-beam system produces an image by the simultaneous bombardment of an electron beam and an ion beam on the sample under study. A conventional optical microscope produces a low-resolution image is the driving factor this market.
              • which limits the extent to which it can be used for performing failure analysis testing. This is leading to an increase in the demand for electron microscopes is the driving factor this market.
              • FIB is the driving factor this market.
              • and dual beam systems for failure analysis tests. Such factors will drive the market during the forecast period. is the driving factor this market.

              The Failure Analysis Test Equipment market vendors should focus on grabbing business opportunities from the Electronics and semiconductors segment as it accounted for the largest market share in the base year.
              RIA - Research AI Assistant
              Ask RIA