Smartphone Market Size 2026-2030
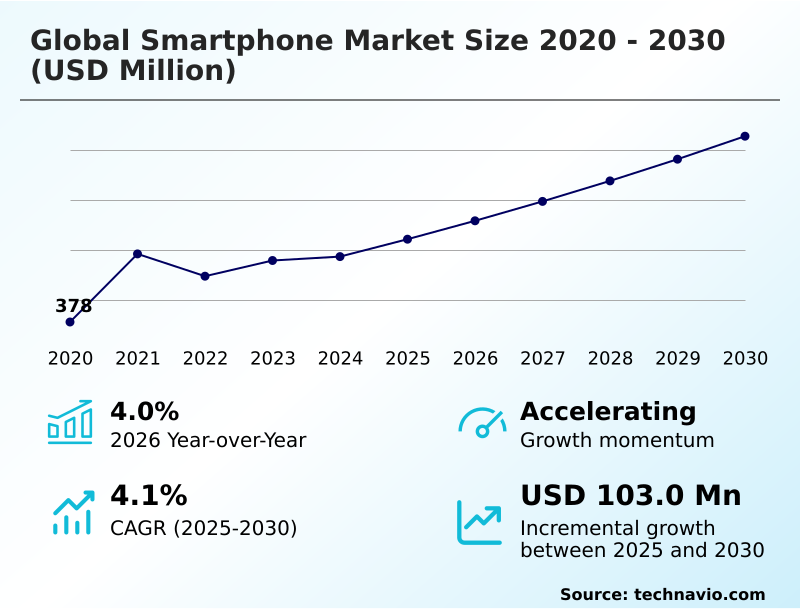
The smartphone market size is valued to increase by USD 103 million, at a CAGR of 4.1% from 2025 to 2030. High speed 5G network expansion will drive the smartphone market.
Major Market Trends & Insights
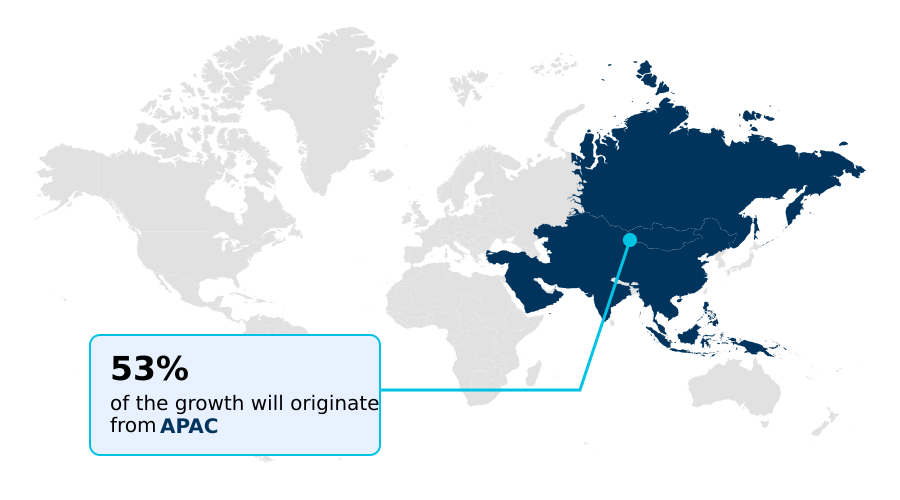
- APAC dominated the market and accounted for a 53.1% growth during the forecast period.
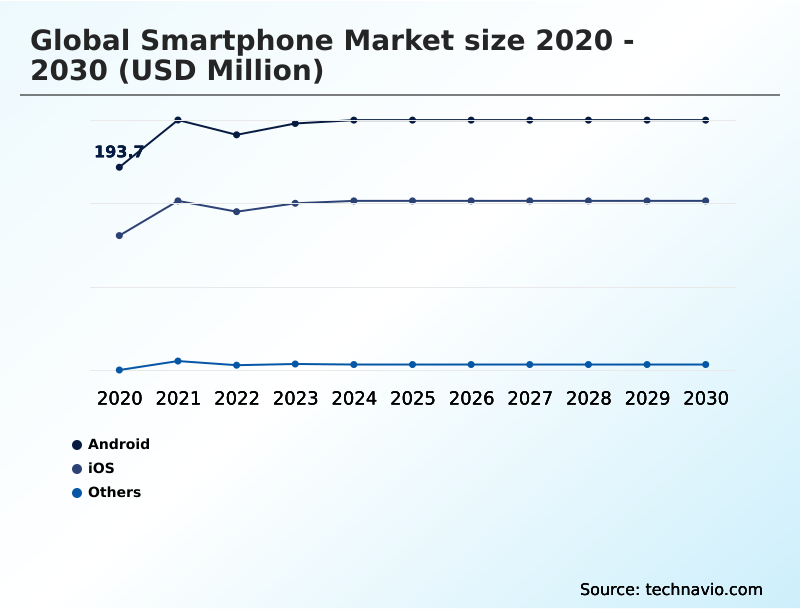
- By Technology - Android segment was valued at USD 229 million in 2024
- By Price Range - Premium segment accounted for the largest market revenue share in 2024
Market Size & Forecast
- Market Opportunities: USD 185.8 million
- Market Future Opportunities: USD 103 million
- CAGR from 2025 to 2030 : 4.1%
Market Summary
- The smartphone market is defined by the rapid convergence of advanced hardware and intelligent software, creating highly integrated personal computing devices. Core to this industry is the continuous innovation in component technology, from the system on a chip that powers operations to sophisticated camera systems and high-resolution, flexible organic light emitting diode displays.
- Applications have expanded far beyond communication to encompass mobile banking, professional productivity, and high-fidelity entertainment. Key industry drivers include the global rollout of 5G infrastructure and rising consumer demand in emerging economies. However, the sector faces considerable challenges related to supply chain volatility for essential components and increasing regulatory pressure for environmental sustainability.
- For instance, a logistics firm aiming to improve operational efficiency might deploy ruggedized smartphone devices with specialized sensors and extended battery life for its field agents, enabling real-time tracking and data entry in harsh environments. This use case highlights the market's shift toward specialized, high-performance solutions that address specific enterprise needs beyond the general consumer segment.
- The industry's trajectory is shaped by the delicate balance between pushing technological boundaries and addressing complex operational and environmental responsibilities.
What will be the Size of the Smartphone Market during the forecast period?
Get Key Insights on Market Forecast (PDF) Get Free Sample
How is the Smartphone Market Segmented?
The smartphone industry research report provides comprehensive data (region-wise segment analysis), with forecasts and estimates in "USD million" for the period 2026-2030, as well as historical data from 2020-2024 for the following segments.
- Technology
- Android
- iOS
- Others
- Price range
- Premium
- Medium
- Low
- Screen size
- Greater than 6 inches
- Between 5-6 inches
- Less than 5 inches
- Geography
- APAC
- China
- India
- Japan
- Europe
- Germany
- UK
- France
- North America
- US
- Canada
- Mexico
- Middle East and Africa
- South Africa
- Saudi Arabia
- UAE
- South America
- Brazil
- Argentina
- Rest of World (ROW)
- APAC
By Technology Insights
The android segment is estimated to witness significant growth during the forecast period.
The android segment represents the largest portion of the ecosystem, driven by its open-source platform that enables a diverse range of hardware implementations across all price points.
This flexibility allows manufacturers to integrate advanced components, such as high-gain antennas and powerful graphical processing units, into devices tailored for both emerging economies and premium markets.
The platform's adaptability is crucial for supporting a wide array of applications, from cloud gaming services to fintech business solutions. Its architecture facilitates extensive customization, enabling unique user experiences and fostering intense competition.
Developments focus on improving data protection through features like enhanced biometric authentication, with software updates improving security protocols by over 15% against certain threats, while also optimizing performance for next-generation hardware like the triple-folding smartphone and other devices leveraging non-terrestrial networks.
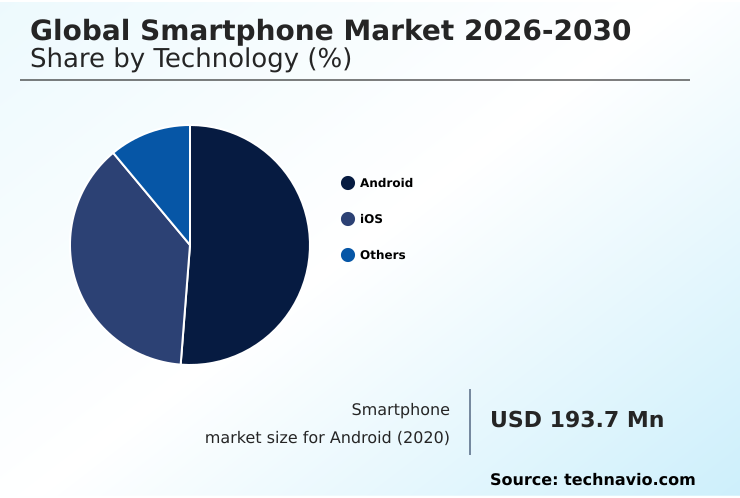
The Android segment was valued at USD 229 million in 2024 and showed a gradual increase during the forecast period.
Regional Analysis
APAC is estimated to contribute 53.1% to the growth of the global market during the forecast period.Technavio’s analysts have elaborately explained the regional trends and drivers that shape the market during the forecast period.
See How Smartphone Market Demand is Rising in APAC Get Free Sample
The global landscape is largely shaped by APAC, which is projected to contribute over 53% of the market's incremental growth, driven by massive consumer bases in China and India.
This region benefits from a highly integrated supply chain and intense competition among local manufacturers, fostering innovation in both premium and budget segments.
In contrast, North America remains one of the most profitable regions, characterized by high consumer spending on premium devices sold through carrier channels.
Europe's market is distinguished by stringent regulatory standards, such as the repairability index, which influences device design and promotes circular economy initiatives.
The Middle East and Africa represent a region of high-growth potential, with a youthful population and increasing adoption of mobile financial services.
Regional growth rates vary, with APAC's expansion outpacing that of North America, reflecting different stages of market maturity and consumer demand.
Market Dynamics
Our researchers analyzed the data with 2025 as the base year, along with the key drivers, trends, and challenges. A holistic analysis of drivers will help companies refine their marketing strategies to gain a competitive advantage.
- Strategic development in the smartphone market is increasingly focused on specialized functionalities and long-term device viability. Key areas of innovation include enhancing foldable display hinge mechanism durability and improving the power efficiency of 5G modems to extend battery life. The integration of advanced camera sensor technology, particularly computational photography algorithms, continues to be a primary differentiator for flagship models.
- Concurrently, on-device generative AI processing is becoming a standard feature, enabling capabilities like AI-powered real-time language translation without relying on the cloud. From a hardware perspective, manufacturers are addressing thermal management in compact smartphones while exploring the advantages of silicon-carbon battery technology for faster charging and longer lifecycles. However, significant challenges persist.
- The supply chain volatility for semiconductors remains a critical operational risk, impacting production timelines and costs. On the back end, regulatory compliance for standardized charging ports and mounting e-waste regulations for electronic devices are forcing a shift in design and manufacturing priorities.
- For instance, new assembly techniques have reduced material waste by a double-digit percentage compared to previous product generations, highlighting the industry's response to sustainability pressures. The market is also grappling with security, addressing biometric authentication security vulnerabilities and developing robust mobile operating system security frameworks to protect user data.
What are the key market drivers leading to the rise in the adoption of Smartphone Industry?
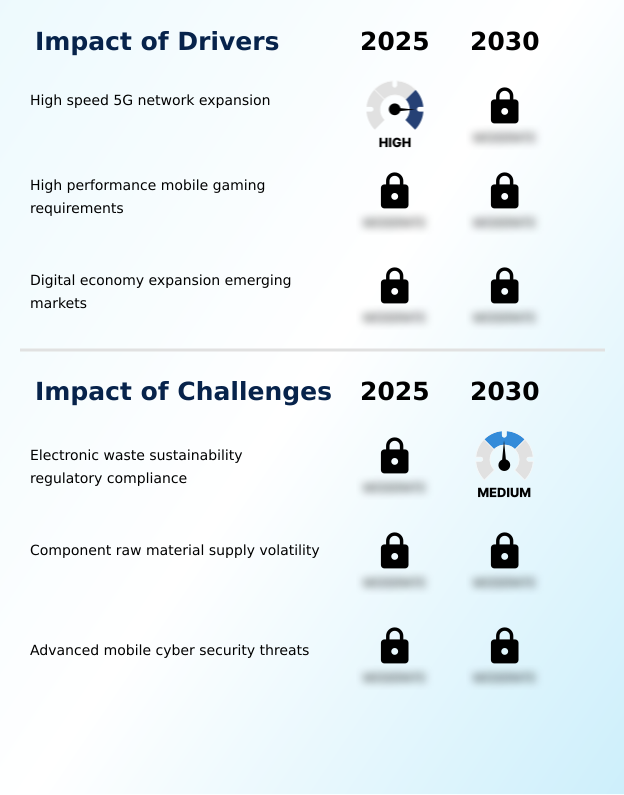
- The continuous expansion of high-speed 5G networks serves as a primary driver, enabling advanced mobile services and applications.
- Market growth is fundamentally propelled by the expansion of next-generation connectivity and the rising demand for high-performance mobile computing.
- The rollout of 5G standalone networks, with global coverage projected to exceed 60% of the population, is a primary catalyst, encouraging upgrades to 5G advanced devices.
- This infrastructure enables advanced capabilities like network slicing, which is critical for supporting real-time data analytics and remote collaboration tools in enterprise environments.
- The burgeoning mobile gaming industry further accelerates this trend, demanding hardware features like advanced cooling systems and programmable shoulder buttons to handle graphically intensive titles.
- This synergy between high-speed connectivity and demanding applications ensures a continuous cycle of innovation in processor and modem technology, pushing the boundaries of what is possible on a mobile platform.
- The adoption of these technologies has increased network efficiency by up to 20% in some urban deployments.
What are the market trends shaping the Smartphone Industry?
- The evolution of foldable display technology is a transformative trend, redefining mobile device form factors and user interaction paradigms.
- The market is undergoing a significant transformation driven by advancements in form factor and on-device intelligence. Innovations in flexible oled panels and ultra thin glass layers are enabling the mass-market adoption of the triple-folding smartphone, merging portability with expansive screen real estate for enhanced multi window multitasking.
- Concurrently, the integration of dedicated neural processing units is powering sophisticated on device agents, allowing for real-time translation and other generative artificial intelligence tasks without cloud dependency. This on-device ai processing improves responsiveness and addresses privacy concerns.
- These advancements support a more immersive user experience, with mobile gaming accounting for over 50% of the total gaming revenue and driving demand for hardware that delivers a desktop-like gaming experience. The development of rollable displays and under-display cameras further signals a future of seamless, bezel-less designs.
What challenges does the Smartphone Industry face during its growth?
- Compliance with stringent environmental regulations concerning electronic waste and sustainability presents a significant challenge to industry growth.
- The industry faces significant headwinds from complex supply chains and stringent regulatory pressures. The price volatility of critical components like 3 nanometer chips and 3D NAND flash memory creates substantial financial risk, eroding margins in a highly competitive landscape.
- This challenge is compounded by increasing environmental oversight, with governments mandating circular economy initiatives that require redesigning products for easier repair and recycling. The cost of complying with regulations like the repairability index is substantial, necessitating new approaches to design and manufacturing.
- Furthermore, cybersecurity remains a persistent threat, with sophisticated zero-day exploits and attacks targeting sensitive biometric templates stored on devices. With electronic waste recycling rates remaining below 25% in many regions, the pressure to adopt sustainable practices is intensifying, forcing a systemic shift in how devices are produced and managed throughout their lifecycle.
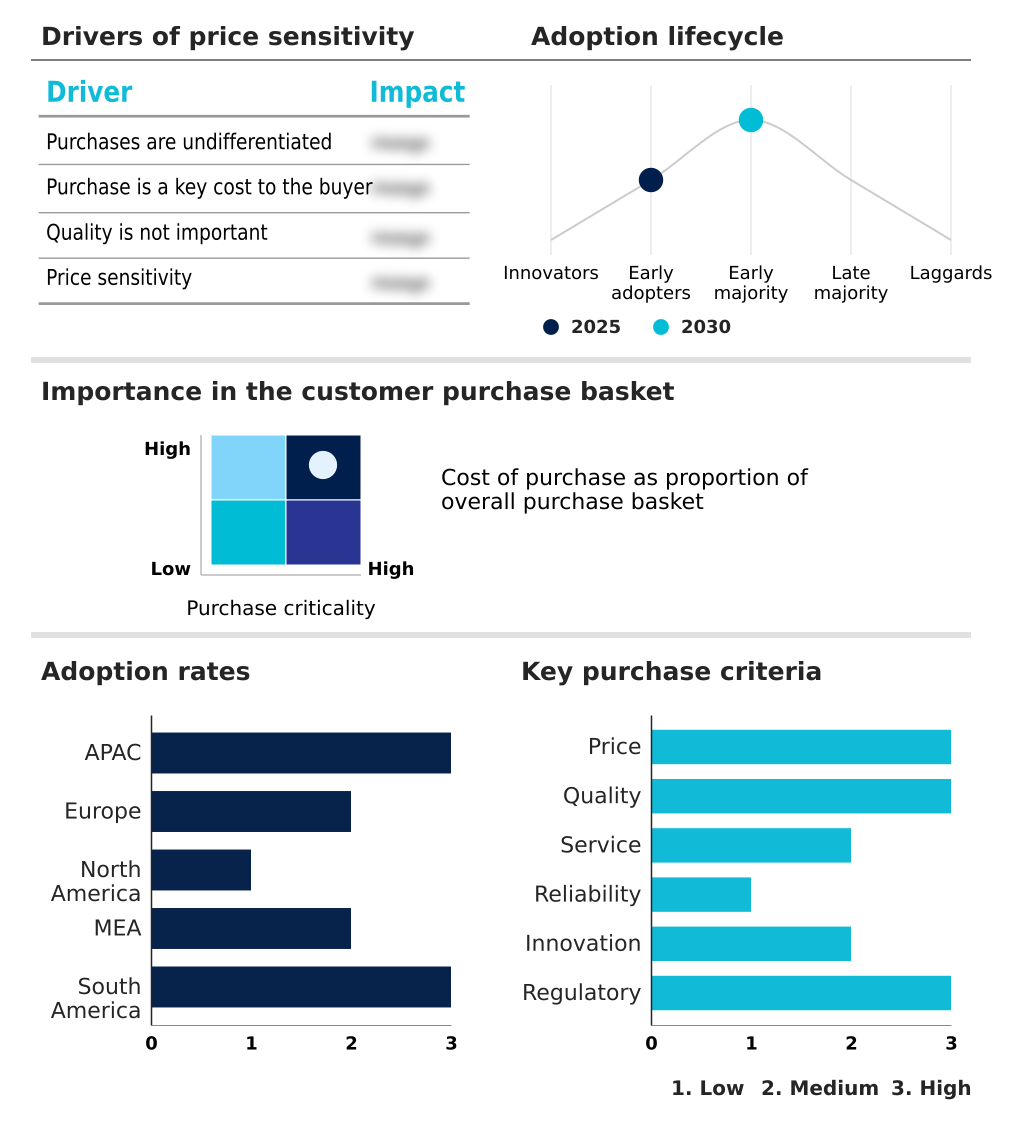
Exclusive Technavio Analysis on Customer Landscape
The smartphone market forecasting report includes the adoption lifecycle of the market, covering from the innovator’s stage to the laggard’s stage. It focuses on adoption rates in different regions based on penetration. Furthermore, the smartphone market report also includes key purchase criteria and drivers of price sensitivity to help companies evaluate and develop their market growth analysis strategies.
Customer Landscape of Smartphone Industry
Competitive Landscape
Companies are implementing various strategies, such as strategic alliances, smartphone market forecast, partnerships, mergers and acquisitions, geographical expansion, and product/service launches, to enhance their presence in the industry.
Acer Inc. - Offerings include a diverse portfolio of advanced mobile devices, from premium flagships and foldables to specialized gaming handsets and rugged industrial units.
The industry research and growth report includes detailed analyses of the competitive landscape of the market and information about key companies, including:
- Acer Inc.
- Apple Inc.
- ASUSTeK Computer Inc.
- Fairphone BV
- Google LLC
- Guangdong OPPO Mobile Telecom
- Honor Device Co. Ltd.
- Huawei Technologies Co. Ltd.
- Kyocera Corp.
- Lava International Ltd.
- Motorola Mobility LLC
- Nokia Corp.
- Samsung Electronics Co. Ltd.
- Sharp Corp.
- Sony Group Corp.
- TCL Industries Holdings Ltd.
- TECNO Mobiles
- Vertu
- Xiaomi Corp.
- ZTE Corp.
Qualitative and quantitative analysis of companies has been conducted to help clients understand the wider business environment as well as the strengths and weaknesses of key industry players. Data is qualitatively analyzed to categorize companies as pure play, category-focused, industry-focused, and diversified; it is quantitatively analyzed to categorize companies as dominant, leading, strong, tentative, and weak.
Recent Development and News in Smartphone market
- In September 2024, Huawei Technologies Co. Ltd. launched the Mate XT, the first commercial triple-folding smartphone, providing a tablet-like experience in a pocketable design.
- In September 2024, Samsung Electronics Co. Ltd. began mass production of high-resolution organic light emitting diode panels designed for the latest premium mobile devices, ensuring superior color accuracy and brightness.
- In August 2024, Google LLC released the final beta of its next major software update, which introduced enhanced private space features allowing users to hide sensitive apps behind an extra layer of authentication.
- In July 2024, Lenovo Group Ltd. published an updated sustainability report that outlines a comprehensive roadmap for using recycled plastics and metals in all of its mobile hardware, responding to pressure for lifecycle responsibility.
Dive into Technavio’s robust research methodology, blending expert interviews, extensive data synthesis, and validated models for unparalleled Smartphone Market insights. See full methodology.
| Market Scope | |
|---|---|
| Page number | 300 |
| Base year | 2025 |
| Historic period | 2020-2024 |
| Forecast period | 2026-2030 |
| Growth momentum & CAGR | Accelerate at a CAGR of 4.1% |
| Market growth 2026-2030 | USD 103.0 million |
| Market structure | Fragmented |
| YoY growth 2025-2026(%) | 4.0% |
| Key countries | China, India, Japan, South Korea, Australia, Indonesia, Germany, UK, France, Italy, Spain, The Netherlands, US, Canada, Mexico, South Africa, Saudi Arabia, UAE, Israel, Turkey, Brazil, Argentina and Chile |
| Competitive landscape | Leading Companies, Market Positioning of Companies, Competitive Strategies, and Industry Risks |
Research Analyst Overview
- The smartphone market's evolution is driven by intense competition in hardware innovation and a strategic shift toward on-device intelligence. The development of 3 nanometer chips and advanced graphical processing units is enabling unprecedented performance, while innovations like the telephoto optical zoom lens and flexible OLED panels redefine user experiences.
- Components such as titanium hinges and sapphire glass enhance durability, a key factor as the industry moves toward circular economy initiatives. Boardroom decisions are increasingly influenced by the need to balance cutting-edge features with sustainability mandates, such as adhering to a stringent repairability index.
- For example, integrating low earth orbit satellite connectivity for non-terrestrial networks opens up new enterprise markets for remote and critical operations. Inside these devices, technologies like vapor chamber cooling and high-refresh-rate displays are becoming standard for premium models, while advancements in 5G modems and silicon-carbon batteries address consumer demands for speed and longevity.
- Effective management of biometric templates and protection against biometric spoofing techniques are critical for maintaining consumer trust. This competitive pressure has led to engineering improvements that reduce component failure rates by over 10% in certain premium models.
What are the Key Data Covered in this Smartphone Market Research and Growth Report?
-
What is the expected growth of the Smartphone Market between 2026 and 2030?
-
USD 103 million, at a CAGR of 4.1%
-
-
What segmentation does the market report cover?
-
The report is segmented by Technology (Android, iOS, and Others), Price Range (Premium, Medium, and Low), Screen Size (Greater than 6 inches, Between 5-6 inches, and Less than 5 inches) and Geography (APAC, Europe, North America, Middle East and Africa, South America)
-
-
Which regions are analyzed in the report?
-
APAC, Europe, North America, Middle East and Africa and South America
-
-
What are the key growth drivers and market challenges?
-
High speed 5G network expansion, Electronic waste sustainability regulatory compliance
-
-
Who are the major players in the Smartphone Market?
-
Acer Inc., Apple Inc., ASUSTeK Computer Inc., Fairphone BV, Google LLC, Guangdong OPPO Mobile Telecom, Honor Device Co. Ltd., Huawei Technologies Co. Ltd., Kyocera Corp., Lava International Ltd., Motorola Mobility LLC, Nokia Corp., Samsung Electronics Co. Ltd., Sharp Corp., Sony Group Corp., TCL Industries Holdings Ltd., TECNO Mobiles, Vertu, Xiaomi Corp. and ZTE Corp.
-
Market Research Insights
- The market's momentum is sustained by a push toward ubiquitous connectivity and intelligent user experiences. The integration of generative artificial intelligence and on-device ai processing is enabling sophisticated on device agents that provide proactive suggestions and real time translation. This enhances user engagement and creates new opportunities for augmented reality applications and personalized services.
- The expansion of cloud gaming services, which now accounts for a significant share of mobile entertainment revenue, is driving demand for hardware capable of delivering a desktop-like gaming experience. For enterprise users, remote collaboration tools are becoming more powerful, with network advancements allowing for real-time data analytics on mobile platforms.
- Innovations in connectivity, such as carrier aggregation and edge computing integration, are delivering data transfer speeds more than 15% faster in certain deployments, while emergency sos messaging via satellite ensures connectivity in remote areas. This focus on software-driven features, supported by powerful hardware, is reshaping how users interact with their devices.
We can help! Our analysts can customize this smartphone market research report to meet your requirements.
 RIA -
RIA - 
