
Female Sexual Dysfunction Treatment Market Size 2025-2029
The female sexual dysfunction treatment market size is forecast to increase by USD 42.82 billion at a CAGR of 62.2% between 2024 and 2029.
- The Female Sexual Dysfunction (FSD) treatment market is experiencing significant growth due to the increasing prevalence of chronic diseases, and the resulting impact on women's sexual health. According to various studies, approximately 43% of women experience some form of sexual dysfunction, with conditions such as hypoactive sexual desire disorder, orgasmic disorder, and sexual arousal disorder being common. This trend is further fueled by the increasing awareness and acceptance of sexual health issues among women and the growing research and development in this area. However, the market is not without challenges. One major challenge is the adverse effects of drugs used in FSD treatment.
- Many medications used to treat sexual dysfunction in women can cause side effects such as headaches, dizziness, and nausea, which can limit their use and patient compliance. Additionally, the high cost of treatment and the lack of insurance coverage for FSD treatments are significant barriers to market growth. Despite these challenges, the market presents significant opportunities for companies developing effective, safe, and affordable treatments for FSD. Companies that can address these challenges and provide innovative solutions will be well-positioned to capitalize on the growing demand for FSD treatments and meet the unmet needs of women suffering from sexual dysfunction.
What will be the Size of the Female Sexual Dysfunction Treatment Market during the forecast period?

- The market encompasses a range of disorders that impact sexual desire, response, and satisfaction. Chronic disorders such as diabetes, cardiovascular disease, and depression are significant contributors to this market. Hormonal changes during menopause and gynecological disorders also play a role. Stress and anxiety, interpersonal difficulties, and psychotherapy are additional factors influencing the market's growth. Healthcare organizations are increasingly focusing on addressing female sexual health issues, leading to a swell in demand for treatments. Pharmacological interventions, including medications like phosphodiesterase inhibitors and hormonal therapy, are common treatments.
- Non-pharmacological approaches, such as pelvic floor exercises and psychotherapy, are also gaining popularity. Estrogen concentrations and estrogen receptor modulators are used to treat certain sexual dysfunctions. The market is expected to grow due to the increasing awareness of sexual health and the availability of effective treatments for chronic diseases and hormonal imbalances.
How is this Female Sexual Dysfunction Treatment Industry segmented?
The female sexual dysfunction treatment industry research report provides comprehensive data (region-wise segment analysis), with forecasts and estimates in "USD million" for the period 2025-2029, as well as historical data from 2019-2023 for the following segments.
- Age Group
- Above 40 years
- Below 40 years
- Product
- Non-hormonal therapy
- Hormonal therapy
- Route Of Administration
- Oral
- Parenteral
- Topical
- Distribution Channel
- Hospital pharmacies
- Drug stores and retail pharmacies
- Online pharmacies
- Geography
- North America
- US
- Canada
- Europe
- France
- Germany
- Italy
- UK
- Asia
- China
- India
- Japan
- South Korea
- Rest of World (ROW)
- North America
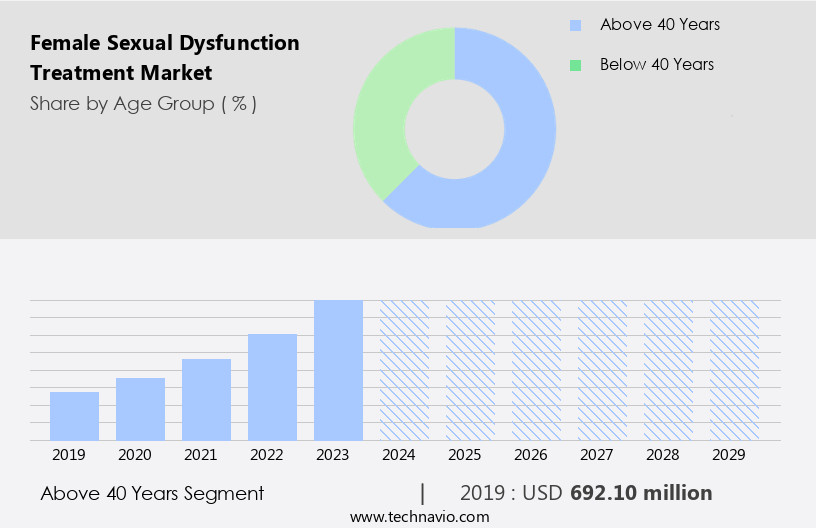
By Age Group Insights
The above 40 years segment is estimated to witness significant growth during the forecast period. The market is experiencing notable growth, particularly in the over-40 age demographic. This expansion is driven by the increasing prevalence of chronic conditions such as cardiovascular diseases, diabetes mellitus, and malignant diseases among older women. For instance, in India, cardiovascular diseases affected approximately 63 million women in 2024. Similarly, in the UK and the US, around 55,000 and 30%, respectively, of new female cancers diagnosed in 2024 were breast cancer cases. Several treatment options are available for female sexual dysfunction, including hormonal therapy (such as Ospemifene for dyspareunia), topical treatments (like estrogen creams and vaginal tablets), and pharmacological interventions (such as PDE5 inhibitors and bremelanotide).
Healthcare professionals in specialist clinics, telemedicine services, and research centers provide high-quality care for women dealing with these sexual health issues. Additionally, non-pharmacological therapies, such as acupuncture, pelvic floor exercises, and lifestyle modifications, are gaining popularity. Chronic disorders like chronic pain, stress, and anxiety can be addressed through psychotherapy, sex therapists, and couples therapy. Modern facilities like hospital pharmacies, drug pharmacies, online stores, and retail pharmacies offer a range of sexual health services, including hormonal therapy, herbal medicine, and dietary therapy. Advanced medical technology, such as vaginal lubrication products, is also contributing to improved sexual health and satisfaction.
Gynecological disorders, such as vaginal dryness and vulvovaginal atrophy infections, can significantly impact sexual functioning. Education and counseling, evidence-based practices, and academic centers play a crucial role in addressing societal taboos surrounding female sexual health and promoting open discussions about sexual functioning and satisfaction.
Get a glance at the market report of share of various segments Request Free Sample
The Above 40 years segment was valued at USD 692.10 billion in 2019 and showed a gradual increase during the forecast period.
Regional Analysis
North America is estimated to contribute 80% to the growth of the global market during the forecast period. Technavio's analysts have elaborately explained the regional trends and drivers that shape the market during the forecast period.

For more insights on the market size of various regions, Request Free Sample
The North American market is experiencing growth due to the rising prevalence of chronic conditions, such as breast cancer and its associated treatments, leading to hormonal imbalances and sexual health issues. These conditions can result in decreased sexual response, vaginal dryness, and dyspareunia. Modern facilities, including specialist clinics and healthcare organizations, offer evidence-based practices, such as hormonal therapy, including Ospemifene and Estrogen Therapy, and topical treatments like Conjugated estrogen creams and Testosterone creams. Telemedicine and online pharmacies provide access to sexual health services and medications, including oral drugs like Flibanserin and Parenteral therapies, for women dealing with sexual dysfunction.
Chronic disorders, such as diabetes mellitus and cardiovascular disease, also contribute to the market's growth. Therapeutic approaches, including acupuncture, pelvic floor exercises, herbal medicine, and lifestyle modifications, are also utilized to address sexual health issues. Healthcare professionals, including gynecologists, sex therapists, psychologists, and physiotherapists, provide education and counseling to help women improve their sexual satisfaction and orgasmic response. Medical technology, such as vaginal tablets and vaginal lubrication, further enhance the market's growth. Despite societal taboos, research centers and academic institutions continue to investigate new treatments and therapies to address the complex nature of female sexual dysfunction.
Market Dynamics
Our researchers analyzed the data with 2024 as the base year, along with the key drivers, trends, and challenges. A holistic analysis of drivers will help companies refine their marketing strategies to gain a competitive advantage.
What are the key market drivers leading to the rise in the adoption of Female Sexual Dysfunction Treatment Industry?
- The increasing prevalence of chronic diseases is the key driver of the market. Female sexual dysfunctions, characterized by loss of desire, orgasm problems, and pain during intercourse, affect numerous women worldwide. The underlying causes include hormonal imbalances, menstrual irregularities, and chronic diseases such as diabetes and kidney disease. Diabetes, a prevalent chronic condition globally, increases the risk of sexual dysfunction in women due to associated factors like overweight, hypertension, obesity, metabolic syndrome, cigarette smoking, and atherogenic dyslipidemia.
- Chronic kidney disease is another health issue linked to sexual problems in women. By addressing the root causes and implementing appropriate treatments, healthcare companies can help women regain sexual health and improve their overall well-being.
What are the market trends shaping the Female Sexual Dysfunction Treatment Industry?
- Increasing research and development for the treatment of sexual dysfunction in women is the upcoming market trend. The market for the treatment of female sexual dysfunction has seen heightened research and development efforts. Collaborations between industry players underscore the significance of merging drug development know-how with patient-centric research. This strategy ensures the creation of effective treatments that cater to the unique requirements and experiences of patients.
- Successful studies may lead to regulatory approvals and the launch of new therapies, significantly enhancing the quality of life for women grappling with sexual dysfunction. Furthermore, the escalating investment in women's health and the expanding focus on sexual wellness are poised to fuel further innovations in this domain.
What challenges does the Female Sexual Dysfunction Treatment Industry face during its growth?
- The adverse effects of drugs used in female sexual dysfunction treatment is a key challenge affecting the industry growth. Women's sexual dysfunctions can be addressed through various treatments, including hormonal therapy and medication. Hormonal therapy involves the use of estrogen and androgen, which can alleviate symptoms such as vaginal dryness and low libido. However, this treatment comes with potential risks, including the increased risk of breast and ovarian cancer, stroke, pulmonary thromboembolism, and vision loss due to a blood clot in the eye. One medication used for the treatment of painful intercourse is ospemifene (Osphena), an estrogen agonist. The recommended dosage is a 60 mg tablet, taken once daily with food. While effective, ospemifene can cause cardiovascular disorders and malignant neoplasms.
- Another medication, flibanserin (Addyi), is prescribed for low libido in women. This drug can cause dizziness, somnolence, and nausea as side effects. Despite the potential risks, these treatments offer relief for women experiencing sexual dysfunctions. Healthcare providers need to weigh the benefits against the risks when considering treatment options for their patients. Patients should also be informed of the potential side effects and risks associated with these treatments to make an informed decision.
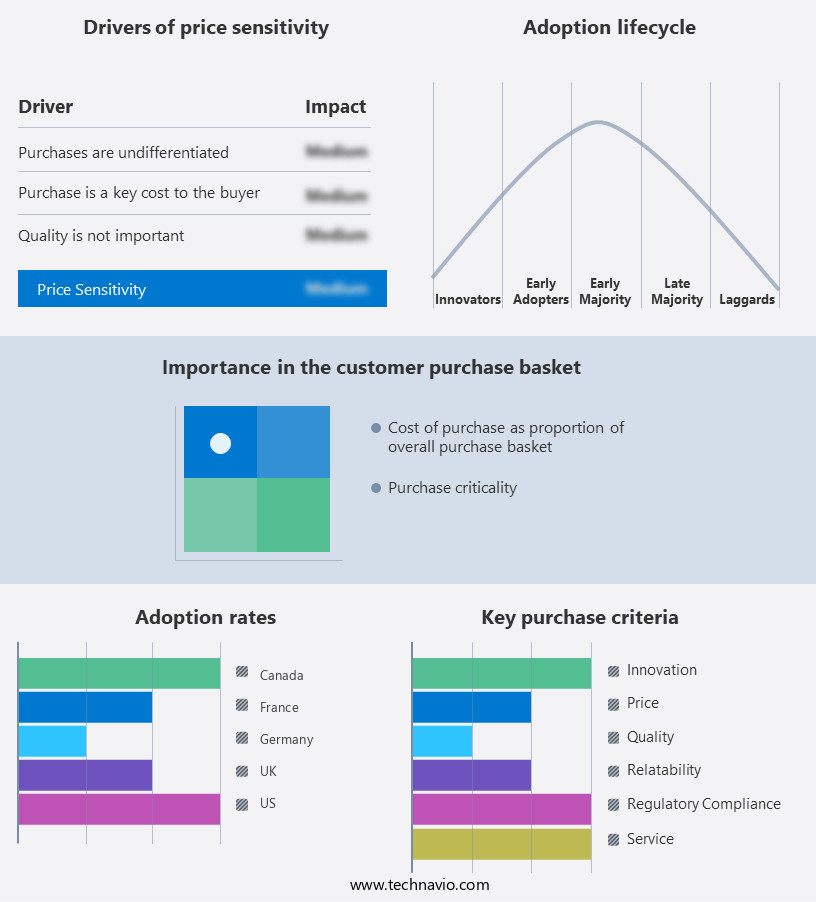
Exclusive Customer Landscape
The female sexual dysfunction treatment market forecasting report includes the adoption lifecycle of the market, covering from the innovator's stage to the laggard's stage. It focuses on adoption rates in different regions based on penetration. Furthermore, the female sexual dysfunction treatment market report also includes key purchase criteria and drivers of price sensitivity to help companies evaluate and develop their market growth analysis strategies.
Customer Landscape
Key Companies & Market Insights
Companies are implementing various strategies, such as strategic alliances, female sexual dysfunction treatment market forecast, partnerships, mergers and acquisitions, geographical expansion, and product/service launches, to enhance their presence in the industry.
AbbVie Inc. - The company offers female sexual dysfunction treatment such as Estrace (estradiol cream), which treats vaginal atrophy and is used off-label to address FSD-related symptoms like dryness or pain during intercourse.
The industry research and growth report includes detailed analyses of the competitive landscape of the market and information about key companies, including:
- AbbVie Inc.
- Covis Pharma GmbH
- Novo Nordisk AS
- Palatin Technologies Inc.
- Sprout Pharmaceuticals Inc.
- TherapeuticsMD
Qualitative and quantitative analysis of companies has been conducted to help clients understand the wider business environment as well as the strengths and weaknesses of key industry players. Data is qualitatively analyzed to categorize companies as pure play, category-focused, industry-focused, and diversified; it is quantitatively analyzed to categorize companies as dominant, leading, strong, tentative, and weak.
Research Analyst Overview
The market encompasses a range of solutions designed to address various issues related to sexual health and response in women. These issues can stem from chronic conditions, hormonal changes, cardiovascular disorders, and stress and anxiety, among other factors. Modern facilities specializing in women's health offer a variety of treatments, including sexual health testing, hormonal therapy, and topical applications. Hormonal imbalances, such as those experienced during menopause, can significantly impact sexual response and desire. Hormonal therapy, including estrogen therapy and non-estrogen therapies, can help alleviate symptoms and improve sexual functioning. Telemedicine and online pharmacies have emerged as convenient options for accessing sexual health services, particularly for those with chronic conditions or limited mobility.
Healthcare professionals, including sex therapists, gynecologists, and psychologists, provide high-quality care through these channels, ensuring evidence-based practices and confidentiality. Chronic diseases, such as diabetes mellitus and cardiovascular disease, can also impact sexual health. Pharmacological treatment drugs, including antidepressants, anti-hypertensive drugs, and phosphodiesterase inhibitors, can help manage these conditions and alleviate associated sexual dysfunction. Lifestyle modifications, such as dietary therapy and regular exercise, can also contribute to improved sexual health. Acupuncture, herbal medicine, and other complementary therapies offer additional options for those seeking alternative treatments. Research centers and academic institutions are at the forefront of advancing our knowledge of female sexual dysfunction and developing new therapeutic approaches.
Advanced medical devices, including vaginal tablets and testosterone creams, is also playing a role in addressing these issues. Vaginal health is a critical aspect of female sexual dysfunction, with conditions such as vaginal dryness and vulvovaginal atrophy infections common contributors to sexual health issues. High-quality care and education and counseling are essential for addressing these concerns and promoting overall sexual health and satisfaction. Societal taboos surrounding sexual health can hinder women from seeking appropriate care and treatment. It is crucial that healthcare organizations and institutions continue to prioritize sexual health education and services to ensure that women have access to the information and resources they need to maintain optimal sexual health and functioning.
|
Market Scope |
|
|
Report Coverage |
Details |
|
Page number |
204 |
|
Base year |
2024 |
|
Historic period |
2019-2023 |
|
Forecast period |
2025-2029 |
|
Growth momentum & CAGR |
Accelerate at a CAGR of 62.2% |
|
Market growth 2025-2029 |
USD 42.82 billion |
|
Market structure |
Concentrated |
|
YoY growth 2024-2025(%) |
42.4 |
|
Key countries |
US, Canada, Germany, UK, France, Italy, China, Japan, India, and South Korea |
|
Competitive landscape |
Leading Companies, Market Positioning of Companies, Competitive Strategies, and Industry Risks |
What are the Key Data Covered in this Female Sexual Dysfunction Treatment Market Research and Growth Report?
- CAGR of the Female Sexual Dysfunction Treatment industry during the forecast period
- Detailed information on factors that will drive the growth and forecasting between 2025 and 2029
- Precise estimation of the size of the market and its contribution of the industry in focus to the parent market
- Accurate predictions about upcoming growth and trends and changes in consumer behaviour
- Growth of the market across North America, Europe, Asia, and Rest of World (ROW)
- Thorough analysis of the market's competitive landscape and detailed information about companies
- Comprehensive analysis of factors that will challenge the female sexual dysfunction treatment market growth and forecasting
We can help! Our analysts can customize this female sexual dysfunction treatment market research report to meet your requirements.