Healthcare Services Market Analysis, Size, and Forecast 2026-2030: North America (US, Canada, and Mexico), Europe (Germany, UK, and France), APAC (China, Japan, and India), South America (Brazil, Argentina, and Colombia), Middle East and Africa (Saudi Arabia, UAE, and Turkey), Asia, Rest of World (ROW)

Healthcare Services Market Analysis, Size, and Forecast 2026-2030:
North America (US, Canada, and Mexico), Europe (Germany, UK, and France), APAC (China, Japan, and India), South America (Brazil, Argentina, and Colombia), Middle East and Africa (Saudi Arabia, UAE, and Turkey), Asia, Rest of World (ROW)

Published: Dec 2025 300 Pages SKU: IRTNTR80118

Market Overview at a Glance

$7589.9 B
Market Opportunity
9.1%
CAGR 2025 - 2030
40.6%
North America Growth
$7198.8 B
Adult care segment 2024

Healthcare Services Market Size 2026-2030

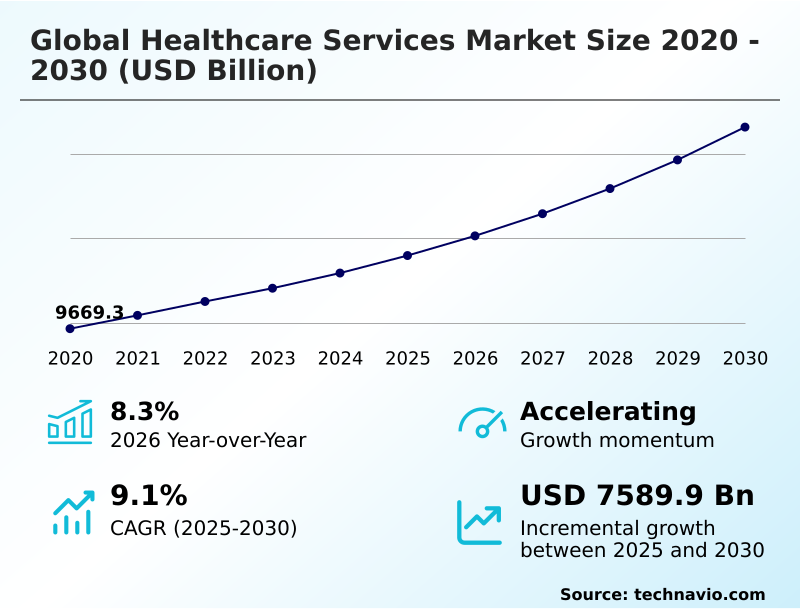
The healthcare services market size is valued to increase by USD 7589.9 billion, at a CAGR of 9.1% from 2025 to 2030. Increasing prevalence of chronic diseases will drive the healthcare services market.

Major Market Trends & Insights

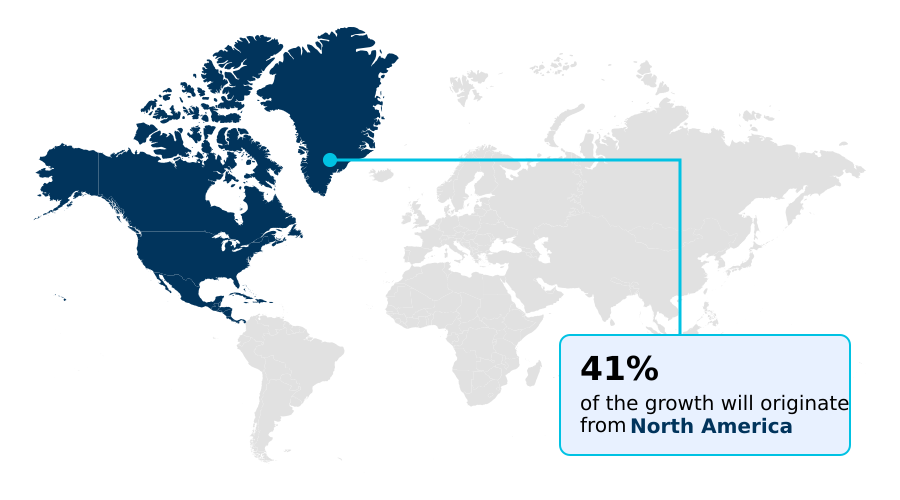
  • North America dominated the market and accounted for a 40.6% growth during the forecast period.
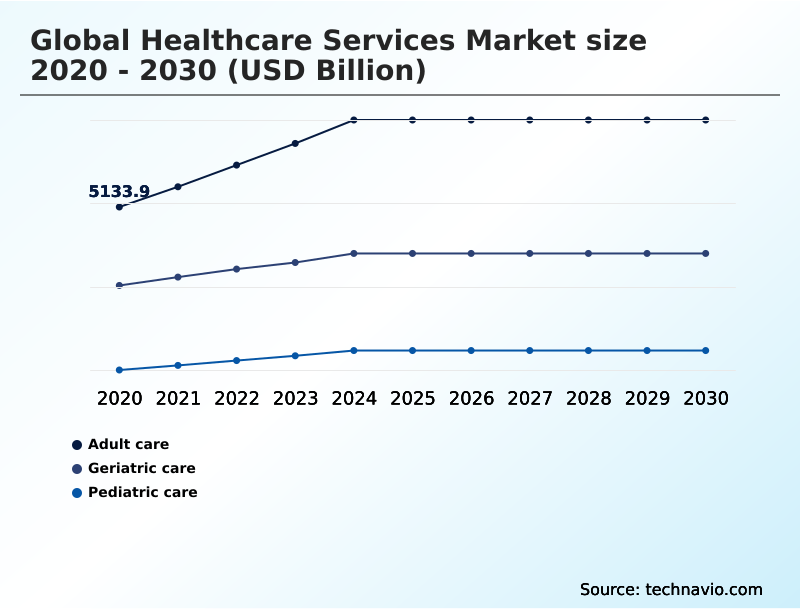
  • By End-user - Adult care segment was valued at USD 7198.8 billion in 2024
  • By Service - Hospitals and clinics segment accounted for the largest market revenue share in 2024

Market Size & Forecast

  • Market Opportunities: USD 11911.4 billion
  • Market Future Opportunities: USD 7589.9 billion
  • CAGR from 2025 to 2030 : 9.1%

Market Summary

What will be the Size of the Healthcare Services Market during the forecast period?

Get Key Insights on Market Forecast (PDF) Request Free Sample

How is the Healthcare Services Market Segmented?

The healthcare services industry research report provides comprehensive data (region-wise segment analysis), with forecasts and estimates in "USD billion" for the period 2026-2030, as well as historical data from 2020-2024 for the following segments.

  • End-user
    • Adult care
    • Geriatric care
    • Pediatric care
  • Service
    • Hospitals and clinics
    • Primary care services
    • Long-term care services
    • Home healthcare
    • Others
  • Service type
    • Public insurance
    • Private insurance
    • Out-of-pocket
  • Geography
    • North America
      • US
      • Canada
      • Mexico
    • Europe
      • Germany
      • UK
      • France
    • Asia
    • Rest of World (ROW)

By End-user Insights

The adult care segment is estimated to witness significant growth during the forecast period.

Request Free Sample

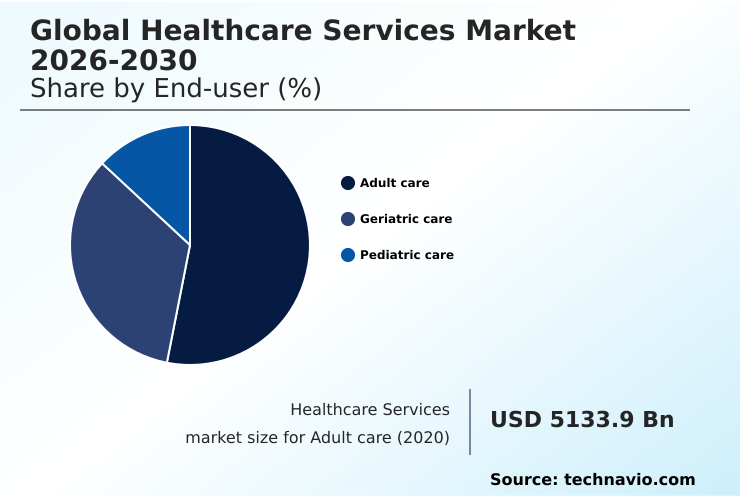
The Adult care segment was valued at USD 7198.8 billion in 2024 and showed a gradual increase during the forecast period.

Request Free Sample

Regional Analysis

North America is estimated to contribute 40.6% to the growth of the global market during the forecast period.Technavio’s analysts have elaborately explained the regional trends and drivers that shape the market during the forecast period.

See How Healthcare Services Market Demand is Rising in North America Request Free Sample

Market Dynamics

Our researchers analyzed the data with 2025 as the base year, along with the key drivers, trends, and challenges. A holistic analysis of drivers will help companies refine their marketing strategies to gain a competitive advantage.

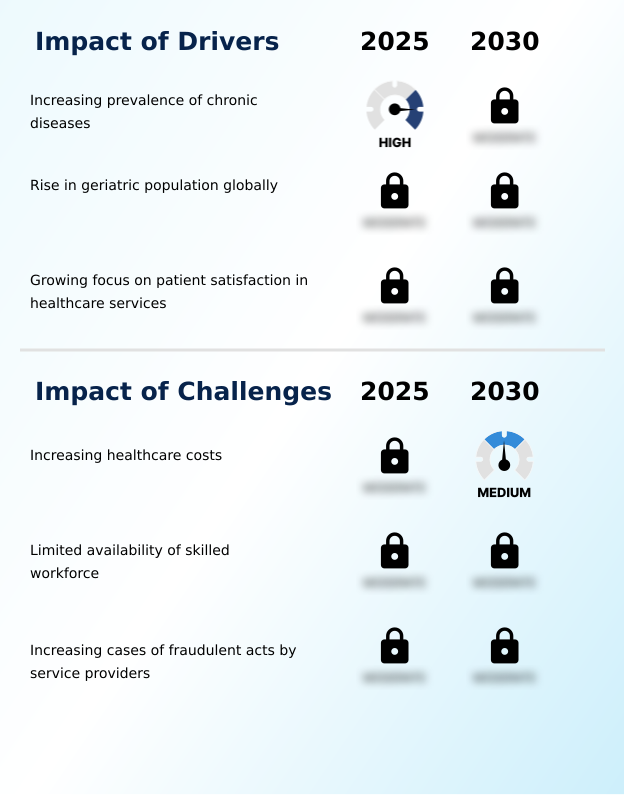
What are the key market drivers leading to the rise in the adoption of Healthcare Services Industry?

What are the market trends shaping the Healthcare Services Industry?

What challenges does the Healthcare Services Industry face during its growth?

Exclusive Technavio Analysis on Customer Landscape

The healthcare services market forecasting report includes the adoption lifecycle of the market, covering from the innovator’s stage to the laggard’s stage. It focuses on adoption rates in different regions based on penetration. Furthermore, the healthcare services market report also includes key purchase criteria and drivers of price sensitivity to help companies evaluate and develop their market growth analysis strategies.

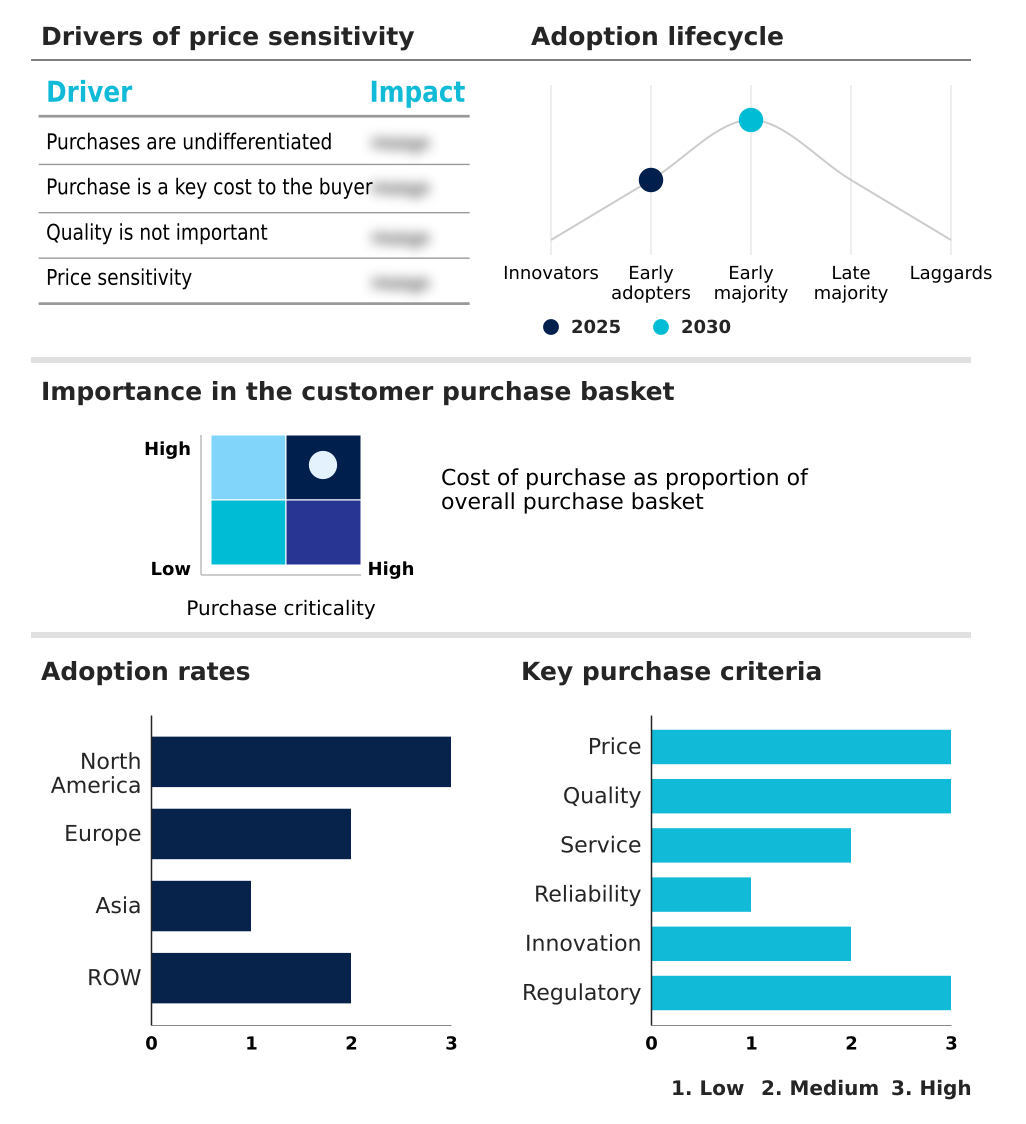
Customer Landscape of Healthcare Services Industry

Competitive Landscape

Companies are implementing various strategies, such as strategic alliances, healthcare services market forecast, partnerships, mergers and acquisitions, geographical expansion, and product/service launches, to enhance their presence in the industry.

Apollo Hospitals Enterprise Ltd. -

The industry research and growth report includes detailed analyses of the competitive landscape of the market and information about key companies, including:

  • Apollo Hospitals Enterprise Ltd.
  • Athenahealth Inc.
  • Community Health Systems Inc.
  • CVS Health Corp.
  • DaVita Inc.
  • Dr. Lal PathLabs Ltd.
  • Expedient Healthcare Pvt. Ltd.
  • Fresenius Medical Co. KGaA
  • iHealth Labs Inc.
  • Max Healthcare Institute Ltd
  • McKesson Corp.
  • OMH HealthEdge Holdings LLC
  • Optum Inc.
  • Quest Diagnostics Inc.
  • Sonic Healthcare Ltd.
  • Universal Health Services Inc
  • West Suffolk NHS Foundation Trust

Qualitative and quantitative analysis of companies has been conducted to help clients understand the wider business environment as well as the strengths and weaknesses of key industry players. Data is qualitatively analyzed to categorize companies as pure play, category-focused, industry-focused, and diversified; it is quantitatively analyzed to categorize companies as dominant, leading, strong, tentative, and weak.

Recent Development and News in Healthcare services market

Dive into Technavio’s robust research methodology, blending expert interviews, extensive data synthesis, and validated models for unparalleled Healthcare Services Market insights. See full methodology.

Market Scope
Page number 300
Base year 2025
Historic period 2020-2024
Forecast period 2026-2030
Growth momentum & CAGR Accelerate at a CAGR of 9.1%
Market growth 2026-2030 USD 7589.9 billion
Market structure Fragmented
YoY growth 2025-2026(%) 8.3%
Key countries US, Canada, Mexico, Germany, UK, France, Italy, Spain, The Netherlands, China, Japan, India, South Korea, Indonesia, Thailand, Brazil, Saudi Arabia, UAE, Turkey, Argentina, Colombia, South Africa and Israel
Competitive landscape Leading Companies, Market Positioning of Companies, Competitive Strategies, and Industry Risks

Request Free Sample

Research Analyst Overview

What are the Key Data Covered in this Healthcare Services Market Research and Growth Report?

  • What is the expected growth of the Healthcare Services Market between 2026 and 2030?

    • USD 7589.9 billion, at a CAGR of 9.1%

  • What segmentation does the market report cover?

    • The report is segmented by End-user (Adult care, Geriatric care, and Pediatric care), Service (Hospitals and clinics, Primary care services, Long-term care services, Home healthcare, and Others), Service Type (Public insurance, Private insurance, and Out-of-pocket) and Geography (North America, Europe, Asia, Rest of World (ROW))

  • Which regions are analyzed in the report?

    • North America, Europe, Asia and Rest of World (ROW)

  • What are the key growth drivers and market challenges?

    • Increasing prevalence of chronic diseases, Increasing healthcare costs

  • Who are the major players in the Healthcare Services Market?

    • Apollo Hospitals Enterprise Ltd., Athenahealth Inc., Community Health Systems Inc., CVS Health Corp., DaVita Inc., Dr. Lal PathLabs Ltd., Expedient Healthcare Pvt. Ltd., Fresenius Medical Co. KGaA, iHealth Labs Inc., Max Healthcare Institute Ltd, McKesson Corp., OMH HealthEdge Holdings LLC, Optum Inc., Quest Diagnostics Inc., Sonic Healthcare Ltd., Universal Health Services Inc and West Suffolk NHS Foundation Trust

Market Research Insights

We can help! Our analysts can customize this healthcare services market research report to meet your requirements.

Get in touch

1. Executive Summary

1.1 Market overview

Executive Summary - Chart on Market Overview
Executive Summary - Data Table on Market Overview
Executive Summary - Chart on Global Market Characteristics
Executive Summary - Chart on Market by Geography
Executive Summary - Chart on Market Segmentation by End-user
Executive Summary - Chart on Market Segmentation by Service
Executive Summary - Chart on Market Segmentation by Service Type
Executive Summary - Chart on Incremental Growth
Executive Summary - Data Table on Incremental Growth
Executive Summary - Chart on Company Market Positioning

2. Technavio Analysis

2.1 Analysis of price sensitivity, lifecycle, customer purchase basket, adoption rates, and purchase criteria

2.2 Criticality of inputs and Factors of differentiation

Chart on Overview on criticality of inputs and factors of differentiation

2.3 Factors of disruption

Chart on Overview on factors of disruption

2.4 Impact of drivers and challenges

Chart on Impact of drivers and challenges in 2025 and 2030

3. Market Landscape

3.1 Market ecosystem

Chart on Parent Market
Data Table on - Parent Market

3.2 Market characteristics

Chart on Market characteristics analysis

3.3 Value chain analysis

Chart on Value chain analysis

4. Market Sizing

4.1 Market definition

Data Table on Offerings of companies included in the market definition

4.2 Market segment analysis

Market segments

4.3 Market size 2025

4.4 Market outlook: Forecast for 2025-2030

Chart on Global - Market size and forecast 2025-2030 ($ billion)
Data Table on Global - Market size and forecast 2025-2030 ($ billion)
Chart on Global Market: Year-over-year growth 2025-2030 (%)
Data Table on Global Market: Year-over-year growth 2025-2030 (%)

5. Historic Market Size

5.1 Global Healthcare Services Market 2020 - 2024

Historic Market Size - Data Table on Global Healthcare Services Market 2020 - 2024 ($ billion)

5.2 End-user segment analysis 2020 - 2024

Historic Market Size - End-user Segment 2020 - 2024 ($ billion)

5.3 Service segment analysis 2020 - 2024

Historic Market Size - Service Segment 2020 - 2024 ($ billion)

5.4 Service Type segment analysis 2020 - 2024

Historic Market Size - Service Type Segment 2020 - 2024 ($ billion)

5.5 Geography segment analysis 2020 - 2024

Historic Market Size - Geography Segment 2020 - 2024 ($ billion)

5.6 Country segment analysis 2020 - 2024

Historic Market Size - Country Segment 2020 - 2024 ($ billion)

6. Qualitative Analysis

6.1 Impact of AI in global healthcare services market

7. Five Forces Analysis

7.1 Five forces summary

Five forces analysis - Comparison between 2025 and 2030

7.2 Bargaining power of buyers

Bargaining power of buyers - Impact of key factors 2025 and 2030

7.3 Bargaining power of suppliers

Bargaining power of suppliers - Impact of key factors in 2025 and 2030

7.4 Threat of new entrants

Threat of new entrants - Impact of key factors in 2025 and 2030

7.5 Threat of substitutes

Threat of substitutes - Impact of key factors in 2025 and 2030

7.6 Threat of rivalry

Threat of rivalry - Impact of key factors in 2025 and 2030

7.7 Market condition

Chart on Market condition - Five forces 2025 and 2030

8. Market Segmentation by End-user

8.1 Market segments

Chart on End-user - Market share 2025-2030 (%)
Data Table on End-user - Market share 2025-2030 (%)

8.2 Comparison by End-user

Chart on Comparison by End-user
Data Table on Comparison by End-user

8.3 Adult care - Market size and forecast 2025-2030

Chart on Adult care - Market size and forecast 2025-2030 ($ billion)
Data Table on Adult care - Market size and forecast 2025-2030 ($ billion)
Chart on Adult care - Year-over-year growth 2025-2030 (%)
Data Table on Adult care - Year-over-year growth 2025-2030 (%)

8.4 Geriatric care - Market size and forecast 2025-2030

Chart on Geriatric care - Market size and forecast 2025-2030 ($ billion)
Data Table on Geriatric care - Market size and forecast 2025-2030 ($ billion)
Chart on Geriatric care - Year-over-year growth 2025-2030 (%)
Data Table on Geriatric care - Year-over-year growth 2025-2030 (%)

8.5 Pediatric care - Market size and forecast 2025-2030

Chart on Pediatric care - Market size and forecast 2025-2030 ($ billion)
Data Table on Pediatric care - Market size and forecast 2025-2030 ($ billion)
Chart on Pediatric care - Year-over-year growth 2025-2030 (%)
Data Table on Pediatric care - Year-over-year growth 2025-2030 (%)

8.6 Market opportunity by End-user

Market opportunity by End-user ($ billion)
Data Table on Market opportunity by End-user ($ billion)

9. Market Segmentation by Service

9.1 Market segments

Chart on Service - Market share 2025-2030 (%)
Data Table on Service - Market share 2025-2030 (%)

9.2 Comparison by Service

Chart on Comparison by Service
Data Table on Comparison by Service

9.3 Hospitals and clinics - Market size and forecast 2025-2030

Chart on Hospitals and clinics - Market size and forecast 2025-2030 ($ billion)
Data Table on Hospitals and clinics - Market size and forecast 2025-2030 ($ billion)
Chart on Hospitals and clinics - Year-over-year growth 2025-2030 (%)
Data Table on Hospitals and clinics - Year-over-year growth 2025-2030 (%)

9.4 Primary care services - Market size and forecast 2025-2030

Chart on Primary care services - Market size and forecast 2025-2030 ($ billion)
Data Table on Primary care services - Market size and forecast 2025-2030 ($ billion)
Chart on Primary care services - Year-over-year growth 2025-2030 (%)
Data Table on Primary care services - Year-over-year growth 2025-2030 (%)

9.5 Long-term care services - Market size and forecast 2025-2030

Chart on Long-term care services - Market size and forecast 2025-2030 ($ billion)
Data Table on Long-term care services - Market size and forecast 2025-2030 ($ billion)
Chart on Long-term care services - Year-over-year growth 2025-2030 (%)
Data Table on Long-term care services - Year-over-year growth 2025-2030 (%)

9.6 Home healthcare - Market size and forecast 2025-2030

Chart on Home healthcare - Market size and forecast 2025-2030 ($ billion)
Data Table on Home healthcare - Market size and forecast 2025-2030 ($ billion)
Chart on Home healthcare - Year-over-year growth 2025-2030 (%)
Data Table on Home healthcare - Year-over-year growth 2025-2030 (%)

9.7 Others - Market size and forecast 2025-2030

Chart on Others - Market size and forecast 2025-2030 ($ billion)
Data Table on Others - Market size and forecast 2025-2030 ($ billion)
Chart on Others - Year-over-year growth 2025-2030 (%)
Data Table on Others - Year-over-year growth 2025-2030 (%)

9.8 Market opportunity by Service

Market opportunity by Service ($ billion)
Data Table on Market opportunity by Service ($ billion)

10. Market Segmentation by Service Type

10.1 Market segments

Chart on Service Type - Market share 2025-2030 (%)
Data Table on Service Type - Market share 2025-2030 (%)

10.2 Comparison by Service Type

Chart on Comparison by Service Type
Data Table on Comparison by Service Type

10.3 Public insurance - Market size and forecast 2025-2030

Chart on Public insurance - Market size and forecast 2025-2030 ($ billion)
Data Table on Public insurance - Market size and forecast 2025-2030 ($ billion)
Chart on Public insurance - Year-over-year growth 2025-2030 (%)
Data Table on Public insurance - Year-over-year growth 2025-2030 (%)

10.4 Private insurance - Market size and forecast 2025-2030

Chart on Private insurance - Market size and forecast 2025-2030 ($ billion)
Data Table on Private insurance - Market size and forecast 2025-2030 ($ billion)
Chart on Private insurance - Year-over-year growth 2025-2030 (%)
Data Table on Private insurance - Year-over-year growth 2025-2030 (%)

10.5 Out-of-pocket - Market size and forecast 2025-2030

Chart on Out-of-pocket - Market size and forecast 2025-2030 ($ billion)
Data Table on Out-of-pocket - Market size and forecast 2025-2030 ($ billion)
Chart on Out-of-pocket - Year-over-year growth 2025-2030 (%)
Data Table on Out-of-pocket - Year-over-year growth 2025-2030 (%)

10.6 Market opportunity by Service Type

Market opportunity by Service Type ($ billion)
Data Table on Market opportunity by Service Type ($ billion)

11. Customer Landscape

11.1 Customer landscape overview

Analysis of price sensitivity, lifecycle, customer purchase basket, adoption rates, and purchase criteria

12. Geographic Landscape

12.1 Geographic segmentation

Chart on Market share by geography 2025-2030 (%)
Data Table on Market share by geography 2025-2030 (%)

12.2 Geographic comparison

Chart on Geographic comparison
Data Table on Geographic comparison

12.3 North America - Market size and forecast 2025-2030

Chart on North America - Market size and forecast 2025-2030 ($ billion)
Data Table on North America - Market size and forecast 2025-2030 ($ billion)
Chart on North America - Year-over-year growth 2025-2030 (%)
Data Table on North America - Year-over-year growth 2025-2030 (%)
Chart on Regional Comparison - North America
Data Table on Regional Comparison - North America

12.3.1 US - Market size and forecast 2025-2030

Chart on US - Market size and forecast 2025-2030 ($ billion)
Data Table on US - Market size and forecast 2025-2030 ($ billion)
Chart on US - Year-over-year growth 2025-2030 (%)
Data Table on US - Year-over-year growth 2025-2030 (%)

12.3.2 Canada - Market size and forecast 2025-2030

Chart on Canada - Market size and forecast 2025-2030 ($ billion)
Data Table on Canada - Market size and forecast 2025-2030 ($ billion)
Chart on Canada - Year-over-year growth 2025-2030 (%)
Data Table on Canada - Year-over-year growth 2025-2030 (%)

12.3.3 Mexico - Market size and forecast 2025-2030

Chart on Mexico - Market size and forecast 2025-2030 ($ billion)
Data Table on Mexico - Market size and forecast 2025-2030 ($ billion)
Chart on Mexico - Year-over-year growth 2025-2030 (%)
Data Table on Mexico - Year-over-year growth 2025-2030 (%)

12.4 Europe - Market size and forecast 2025-2030

Chart on Europe - Market size and forecast 2025-2030 ($ billion)
Data Table on Europe - Market size and forecast 2025-2030 ($ billion)
Chart on Europe - Year-over-year growth 2025-2030 (%)
Data Table on Europe - Year-over-year growth 2025-2030 (%)
Chart on Regional Comparison - Europe
Data Table on Regional Comparison - Europe

12.4.1 Germany - Market size and forecast 2025-2030

Chart on Germany - Market size and forecast 2025-2030 ($ billion)
Data Table on Germany - Market size and forecast 2025-2030 ($ billion)
Chart on Germany - Year-over-year growth 2025-2030 (%)
Data Table on Germany - Year-over-year growth 2025-2030 (%)

12.4.2 UK - Market size and forecast 2025-2030

Chart on UK - Market size and forecast 2025-2030 ($ billion)
Data Table on UK - Market size and forecast 2025-2030 ($ billion)
Chart on UK - Year-over-year growth 2025-2030 (%)
Data Table on UK - Year-over-year growth 2025-2030 (%)

12.4.3 France - Market size and forecast 2025-2030

Chart on France - Market size and forecast 2025-2030 ($ billion)
Data Table on France - Market size and forecast 2025-2030 ($ billion)
Chart on France - Year-over-year growth 2025-2030 (%)
Data Table on France - Year-over-year growth 2025-2030 (%)

12.4.4 Italy - Market size and forecast 2025-2030

Chart on Italy - Market size and forecast 2025-2030 ($ billion)
Data Table on Italy - Market size and forecast 2025-2030 ($ billion)
Chart on Italy - Year-over-year growth 2025-2030 (%)
Data Table on Italy - Year-over-year growth 2025-2030 (%)

12.4.5 Spain - Market size and forecast 2025-2030

Chart on Spain - Market size and forecast 2025-2030 ($ billion)
Data Table on Spain - Market size and forecast 2025-2030 ($ billion)
Chart on Spain - Year-over-year growth 2025-2030 (%)
Data Table on Spain - Year-over-year growth 2025-2030 (%)

12.4.6 The Netherlands - Market size and forecast 2025-2030

Chart on The Netherlands - Market size and forecast 2025-2030 ($ billion)
Data Table on The Netherlands - Market size and forecast 2025-2030 ($ billion)
Chart on The Netherlands - Year-over-year growth 2025-2030 (%)
Data Table on The Netherlands - Year-over-year growth 2025-2030 (%)

12.5 Asia - Market size and forecast 2025-2030

Chart on Asia - Market size and forecast 2025-2030 ($ billion)
Data Table on Asia - Market size and forecast 2025-2030 ($ billion)
Chart on Asia - Year-over-year growth 2025-2030 (%)
Data Table on Asia - Year-over-year growth 2025-2030 (%)
Chart on Regional Comparison - Asia
Data Table on Regional Comparison - Asia

12.5.1 China - Market size and forecast 2025-2030

Chart on China - Market size and forecast 2025-2030 ($ billion)
Data Table on China - Market size and forecast 2025-2030 ($ billion)
Chart on China - Year-over-year growth 2025-2030 (%)
Data Table on China - Year-over-year growth 2025-2030 (%)

12.5.2 Japan - Market size and forecast 2025-2030

Chart on Japan - Market size and forecast 2025-2030 ($ billion)
Data Table on Japan - Market size and forecast 2025-2030 ($ billion)
Chart on Japan - Year-over-year growth 2025-2030 (%)
Data Table on Japan - Year-over-year growth 2025-2030 (%)

12.5.3 India - Market size and forecast 2025-2030

Chart on India - Market size and forecast 2025-2030 ($ billion)
Data Table on India - Market size and forecast 2025-2030 ($ billion)
Chart on India - Year-over-year growth 2025-2030 (%)
Data Table on India - Year-over-year growth 2025-2030 (%)

12.5.4 South Korea - Market size and forecast 2025-2030

Chart on South Korea - Market size and forecast 2025-2030 ($ billion)
Data Table on South Korea - Market size and forecast 2025-2030 ($ billion)
Chart on South Korea - Year-over-year growth 2025-2030 (%)
Data Table on South Korea - Year-over-year growth 2025-2030 (%)

12.5.5 Indonesia - Market size and forecast 2025-2030

Chart on Indonesia - Market size and forecast 2025-2030 ($ billion)
Data Table on Indonesia - Market size and forecast 2025-2030 ($ billion)
Chart on Indonesia - Year-over-year growth 2025-2030 (%)
Data Table on Indonesia - Year-over-year growth 2025-2030 (%)

12.5.6 Thailand - Market size and forecast 2025-2030

Chart on Thailand - Market size and forecast 2025-2030 ($ billion)
Data Table on Thailand - Market size and forecast 2025-2030 ($ billion)
Chart on Thailand - Year-over-year growth 2025-2030 (%)
Data Table on Thailand - Year-over-year growth 2025-2030 (%)

12.6 Rest of World (ROW) - Market size and forecast 2025-2030

Chart on Rest of World (ROW) - Market size and forecast 2025-2030 ($ billion)
Data Table on Rest of World (ROW) - Market size and forecast 2025-2030 ($ billion)
Chart on Rest of World (ROW) - Year-over-year growth 2025-2030 (%)
Data Table on Rest of World (ROW) - Year-over-year growth 2025-2030 (%)
Chart on Regional Comparison - Rest of World (ROW)
Data Table on Regional Comparison - Rest of World (ROW)

12.6.1 Brazil - Market size and forecast 2025-2030

Chart on Brazil - Market size and forecast 2025-2030 ($ billion)
Data Table on Brazil - Market size and forecast 2025-2030 ($ billion)
Chart on Brazil - Year-over-year growth 2025-2030 (%)
Data Table on Brazil - Year-over-year growth 2025-2030 (%)

12.6.2 Saudi Arabia - Market size and forecast 2025-2030

Chart on Saudi Arabia - Market size and forecast 2025-2030 ($ billion)
Data Table on Saudi Arabia - Market size and forecast 2025-2030 ($ billion)
Chart on Saudi Arabia - Year-over-year growth 2025-2030 (%)
Data Table on Saudi Arabia - Year-over-year growth 2025-2030 (%)

12.6.3 UAE - Market size and forecast 2025-2030

Chart on UAE - Market size and forecast 2025-2030 ($ billion)
Data Table on UAE - Market size and forecast 2025-2030 ($ billion)
Chart on UAE - Year-over-year growth 2025-2030 (%)
Data Table on UAE - Year-over-year growth 2025-2030 (%)

12.6.4 Turkey - Market size and forecast 2025-2030

Chart on Turkey - Market size and forecast 2025-2030 ($ billion)
Data Table on Turkey - Market size and forecast 2025-2030 ($ billion)
Chart on Turkey - Year-over-year growth 2025-2030 (%)
Data Table on Turkey - Year-over-year growth 2025-2030 (%)

12.6.5 Argentina - Market size and forecast 2025-2030

Chart on Argentina - Market size and forecast 2025-2030 ($ billion)
Data Table on Argentina - Market size and forecast 2025-2030 ($ billion)
Chart on Argentina - Year-over-year growth 2025-2030 (%)
Data Table on Argentina - Year-over-year growth 2025-2030 (%)

12.6.6 Colombia - Market size and forecast 2025-2030

Chart on Colombia - Market size and forecast 2025-2030 ($ billion)
Data Table on Colombia - Market size and forecast 2025-2030 ($ billion)
Chart on Colombia - Year-over-year growth 2025-2030 (%)
Data Table on Colombia - Year-over-year growth 2025-2030 (%)

12.6.7 South Africa - Market size and forecast 2025-2030

Chart on South Africa - Market size and forecast 2025-2030 ($ billion)
Data Table on South Africa - Market size and forecast 2025-2030 ($ billion)
Chart on South Africa - Year-over-year growth 2025-2030 (%)
Data Table on South Africa - Year-over-year growth 2025-2030 (%)

12.6.8 Israel - Market size and forecast 2025-2030

Chart on Israel - Market size and forecast 2025-2030 ($ billion)
Data Table on Israel - Market size and forecast 2025-2030 ($ billion)
Chart on Israel - Year-over-year growth 2025-2030 (%)
Data Table on Israel - Year-over-year growth 2025-2030 (%)

12.7 Market opportunity by geography

Market opportunity by geography ($ billion)
Data Tables on Market opportunity by geography ($ billion)

13. Drivers, Challenges, and Opportunity

13.1 Market drivers

Increasing prevalence of chronic diseases
Rise in geriatric population globally
Growing focus on patient satisfaction in healthcare services

13.2 Market challenges

Increasing healthcare costs
Limited availability of skilled workforce
Increasing cases of fraudulent acts by service providers

13.3 Impact of drivers and challenges

Impact of drivers and challenges in 2025 and 2030

13.4 Market opportunities

Rise in adoption of telemedicine in healthcare sector
Growing adoption of personalized medicine
Integration of AI and ML in healthcare sector

14. Competitive Landscape

14.1 Overview

14.2

Overview on criticality of inputs and factors of differentiation

14.3 Landscape disruption

Overview on factors of disruption

14.4 Industry risks

Impact of key risks on business

15. Competitive Analysis

15.1 Companies profiled

Companies covered

15.2 Company ranking index

15.3 Market positioning of companies

Matrix on companies position and classification

15.4 Apollo Hospitals Enterprise Ltd.

Apollo Hospitals Enterprise Ltd. - Overview
Apollo Hospitals Enterprise Ltd. - Business segments
Apollo Hospitals Enterprise Ltd. - Key news
Apollo Hospitals Enterprise Ltd. - Key offerings
Apollo Hospitals Enterprise Ltd. - Segment focus
SWOT

15.5 Athenahealth Inc.

Athenahealth Inc. - Overview
Athenahealth Inc. - Product / Service
Athenahealth Inc. - Key offerings
SWOT

15.6 Community Health Systems Inc.

Community Health Systems Inc. - Overview
Community Health Systems Inc. - Product / Service
Community Health Systems Inc. - Key offerings
SWOT

15.7 CVS Health Corp.

CVS Health Corp. - Overview
CVS Health Corp. - Business segments
CVS Health Corp. - Key offerings
CVS Health Corp. - Segment focus
SWOT

15.8 DaVita Inc.

DaVita Inc. - Overview
DaVita Inc. - Business segments
DaVita Inc. - Key offerings
DaVita Inc. - Segment focus
SWOT

15.9 Dr. Lal PathLabs Ltd.

Dr. Lal PathLabs Ltd. - Overview
Dr. Lal PathLabs Ltd. - Product / Service
Dr. Lal PathLabs Ltd. - Key offerings
SWOT

15.10 Fresenius Medical Co. KGaA

Fresenius Medical Co. KGaA - Overview
Fresenius Medical Co. KGaA - Business segments
Fresenius Medical Co. KGaA - Key news
Fresenius Medical Co. KGaA - Key offerings
Fresenius Medical Co. KGaA - Segment focus
SWOT

15.11 Max Healthcare Institute Ltd

Max Healthcare Institute Ltd - Overview
Max Healthcare Institute Ltd - Product / Service
Max Healthcare Institute Ltd - Key offerings
SWOT

15.12 McKesson Corp.

McKesson Corp. - Overview
McKesson Corp. - Business segments
McKesson Corp. - Key news
McKesson Corp. - Key offerings
McKesson Corp. - Segment focus
SWOT

15.13 OMH HealthEdge Holdings LLC

OMH HealthEdge Holdings LLC - Overview
OMH HealthEdge Holdings LLC - Product / Service
OMH HealthEdge Holdings LLC - Key offerings
SWOT

15.14 Optum Inc.

Optum Inc. - Overview
Optum Inc. - Product / Service
Optum Inc. - Key offerings
SWOT

15.15 Quest Diagnostics Inc.

Quest Diagnostics Inc. - Overview
Quest Diagnostics Inc. - Business segments
Quest Diagnostics Inc. - Key offerings
Quest Diagnostics Inc. - Segment focus
SWOT

15.16 Sonic Healthcare Ltd.

Sonic Healthcare Ltd. - Overview
Sonic Healthcare Ltd. - Business segments
Sonic Healthcare Ltd. - Key offerings
Sonic Healthcare Ltd. - Segment focus
SWOT

15.17 Universal Health Services Inc

Universal Health Services Inc - Overview
Universal Health Services Inc - Business segments
Universal Health Services Inc - Key offerings
Universal Health Services Inc - Segment focus
SWOT

15.18 West Suffolk NHS Foundation Trust

West Suffolk NHS Foundation Trust - Overview
West Suffolk NHS Foundation Trust - Product / Service
West Suffolk NHS Foundation Trust - Key offerings
SWOT

16. Appendix

16.1 Scope of the report

Market definition
Objectives
Notes and caveats

16.2 Inclusions and exclusions checklist

Inclusions checklist
Exclusions checklist

16.3 Currency conversion rates for US$

16.4 Research methodology

16.5 Data procurement

Information sources

16.6 Data validation

16.7 Validation techniques employed for market sizing

16.8 Data synthesis

16.9 360 degree market analysis

16.10 List of abbreviations

Research Methodology

Technavio presents a detailed picture of the market by way of study, synthesis, and summation of data from multiple sources. The analysts have presented the various facets of the market with a particular focus on identifying the key industry influencers. The data thus presented is comprehensive, reliable, and the result of extensive research, both primary and secondary.

INFORMATION SOURCES

Primary sources

  • Manufacturers and suppliers
  • Channel partners
  • Industry experts
  • Strategic decision makers

Secondary sources

  • Industry journals and periodicals
  • Government data
  • Financial reports of key industry players
  • Historical data
  • Press releases

DATA ANALYSIS

Data Synthesis

  • Collation of data
  • Estimation of key figures
  • Analysis of derived insights

Data Validation

  • Triangulation with data models
  • Reference against proprietary databases
  • Corroboration with industry experts

REPORT WRITING

Qualitative

  • Market drivers
  • Market challenges
  • Market trends
  • Five forces analysis

Quantitative

  • Market size and forecast
  • Market segmentation
  • Geographical insights
  • Competitive landscape

Interested in this report?

Get your sample now to see our research methodology and insights!

Download Now

Frequently Asked Questions

Healthcare Services market growth will increase by USD 7589.9 billion during 2026-2030.

The Healthcare Services market is expected to grow at a CAGR of 9.1% during 2026-2030.

Healthcare Services market is segmented by End-user (Adult care, Geriatric care, Pediatric care) Service (Hospitals and clinics, Primary care services, Long-term care services, Home healthcare, Others) Service type (Public insurance, Private insurance, Out-of-pocket)

Apollo Hospitals Enterprise Ltd., Athenahealth Inc., Community Health Systems Inc., CVS Health Corp., DaVita Inc., Dr. Lal PathLabs Ltd., Expedient Healthcare Pvt. Ltd., Fresenius Medical Co. KGaA, iHealth Labs Inc., Max Healthcare Institute Ltd, McKesson Corp., OMH HealthEdge Holdings LLC, Optum Inc., Quest Diagnostics Inc., Sonic Healthcare Ltd., Universal Health Services Inc, West Suffolk NHS Foundation Trust are a few of the key vendors in the Healthcare Services market.

North America will register the highest growth rate of 40.6% among the other regions. Therefore, the Healthcare Services market in North America is expected to garner significant business opportunities for the vendors during the forecast period.

US, Canada, Mexico, Germany, UK, France, Italy, Spain, The Netherlands, China, Japan, India, South Korea, Indonesia, Thailand, Brazil, Saudi Arabia, UAE, Turkey, Argentina, Colombia, South Africa, Israel

  • Increasing prevalence of chronic diseases is the driving factor this market.

The Healthcare Services market vendors should focus on grabbing business opportunities from the End-user segment as it accounted for the largest market share in the base year.