
Erectile Dysfunction (ED) Drugs Market Size 2026-2030
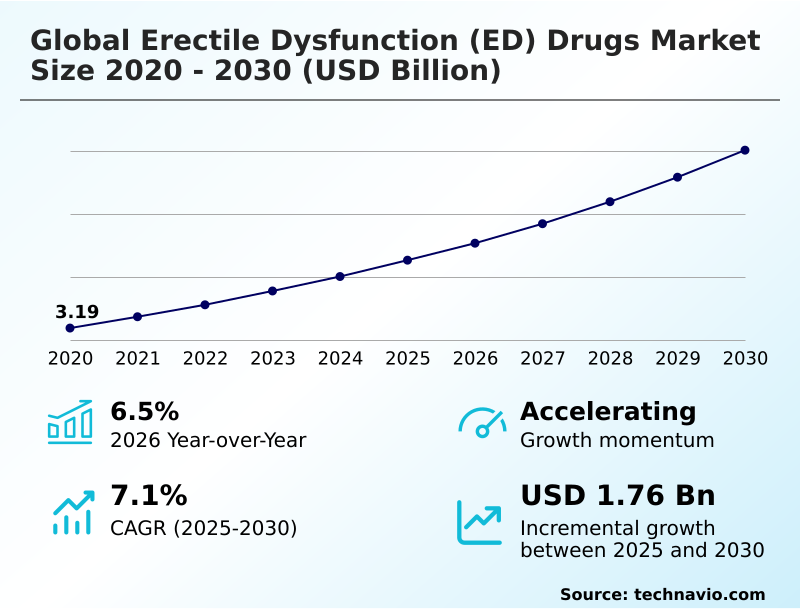
The erectile dysfunction (ed) drugs market size is valued to increase by USD 1.76 billion, at a CAGR of 7.1% from 2025 to 2030. Rising demand for erectile dysfunction drugs will drive the erectile dysfunction (ed) drugs market.
Major Market Trends & Insights
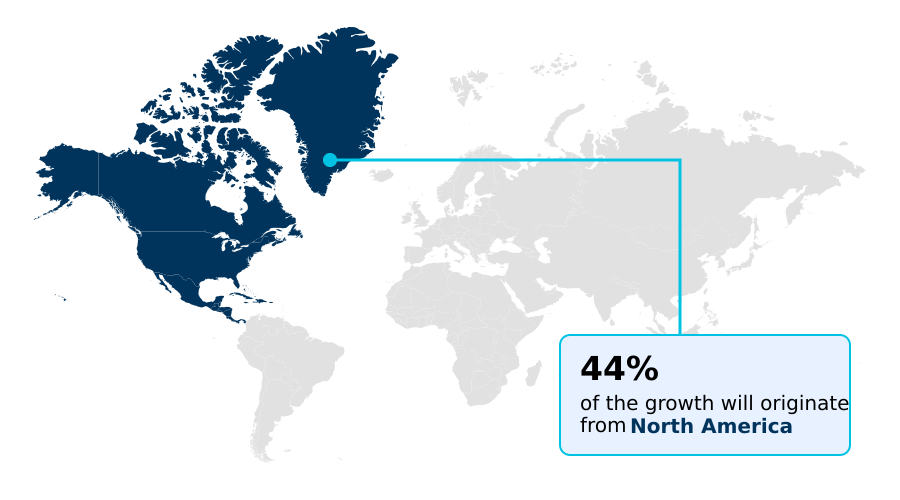
- North America dominated the market and accounted for a 43.9% growth during the forecast period.
- By Distribution Channel - Hospital pharmacy segment was valued at USD 2.11 billion in 2024
- By Product - Oral drugs segment accounted for the largest market revenue share in 2024
Market Size & Forecast
- Market Opportunities: USD 2.83 billion
- Market Future Opportunities: USD 1.76 billion
- CAGR from 2025 to 2030 : 7.1%
Market Summary
- The erectile dysfunction (ED) drugs market is undergoing significant evolution, driven by a growing recognition of ED as a manageable medical condition linked to broader health issues. Demand is fueled by an aging global population and a higher prevalence of lifestyle-related diseases that cause vascular function impairment.
- Key trends focus on patient-centric drug design, including the development of treatments with fewer side effects and more convenient administration methods. Innovations in regenerative medicine approaches and combination ed drug regimens are expanding therapeutic options beyond traditional oral medications. However, the market faces challenges from generic competition, which impacts pricing and innovation incentives.
- For instance, a healthcare system implementing digital therapeutics to complement pharmacological treatments can improve patient outcomes by addressing psychogenic contributors, demonstrating a shift toward integrated care models.
- This strategic focus on holistic solutions, which integrate an understanding of ed drug interaction risks and ed therapy for cardiovascular patients, is essential for navigating the competitive dynamics of the erectile dysfunction (ED) drugs market.
What will be the Size of the Erectile Dysfunction (ED) Drugs Market during the forecast period?
Get Key Insights on Market Forecast (PDF) Get Free Sample
How is the Erectile Dysfunction (ED) Drugs Market Segmented?
The erectile dysfunction (ed) drugs industry research report provides comprehensive data (region-wise segment analysis), with forecasts and estimates in "USD million" for the period 2026-2030, as well as historical data from 2020-2024 for the following segments.
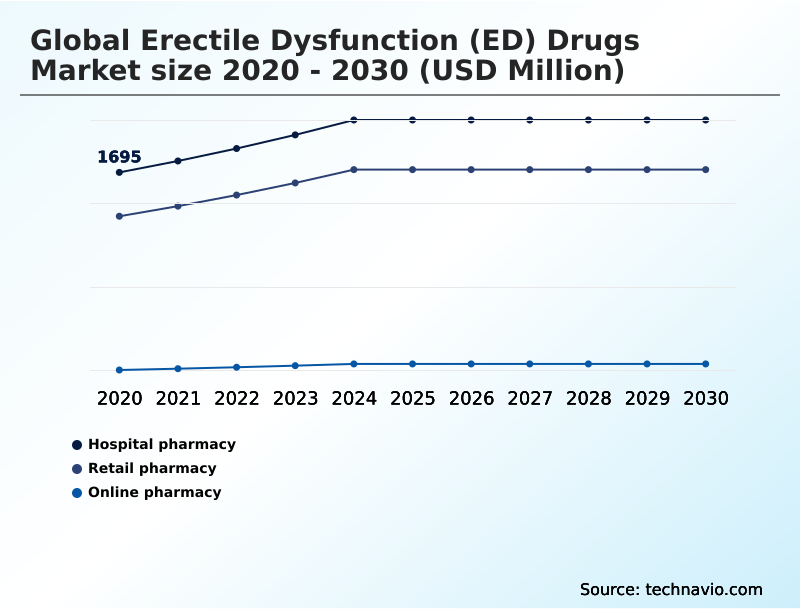
- Distribution channel
- Hospital pharmacy
- Retail pharmacy
- Online pharmacy
- Product
- Oral drugs
- Topical drugs
- Others
- Type
- Sildenafil
- Tadalafil
- Vardenafil
- Avanafil
- Others
- Geography
- North America
- US
- Canada
- Mexico
- Europe
- UK
- Germany
- France
- Asia
- Rest of World (ROW)
- North America
By Distribution Channel Insights
The hospital pharmacy segment is estimated to witness significant growth during the forecast period.
The hospital pharmacy segment remains a critical distribution channel, handling complex cases where erectile dysfunction (ED) drugs are part of a broader clinical plan.
This channel is integral for managing therapies involving established phosphodiesterase type 5 inhibitors and advanced options like hormonal correction for patients with significant comorbidities.
The controlled setting allows for meticulous management of pde5 inhibitor mechanism of action and potential nitrate contraindications, ensuring patient safety. In fact, institutional settings account for over 84% of prescriptions for patients requiring monitored administration due to underlying conditions.
Decisions here are influenced by ed drug safety profiles and ed drug pharmacokinetics, with a focus on non-invasive ed treatment methods and managing ed post-prostatectomy.
The channel's role in ed therapy adherence factors and supporting ed treatment for diabetic patients is also crucial.
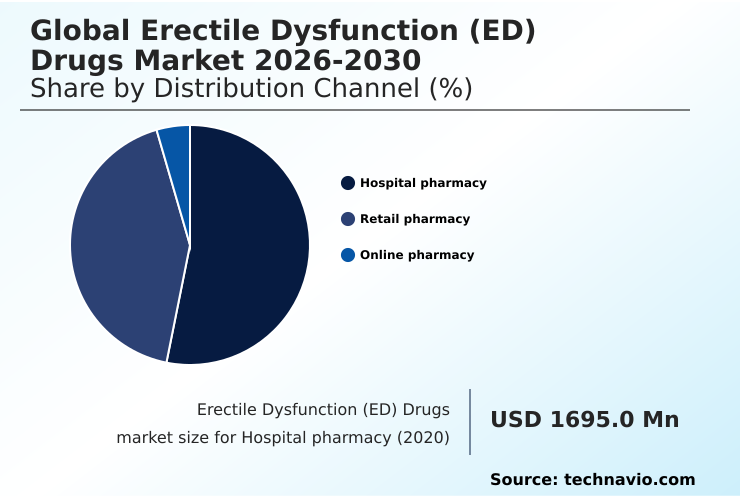
The Hospital pharmacy segment was valued at USD 2.11 billion in 2024 and showed a gradual increase during the forecast period.
Regional Analysis
North America is estimated to contribute 43.9% to the growth of the global market during the forecast period.Technavio’s analysts have elaborately explained the regional trends and drivers that shape the market during the forecast period.
See How Erectile Dysfunction (ED) Drugs Market Demand is Rising in North America Get Free Sample
The geographic landscape of the erectile dysfunction (ED) drugs market is characterized by varied regional dynamics. North America, contributing nearly 44% of the market, leads due to high healthcare spending and awareness.
However, Asia is the fastest-growing region, with a cagr of 8.1%, driven by rising incomes and modernizing healthcare. Formulations like orally disintegrating tablets and peptide based therapies are gaining traction globally.
Regional strategies often depend on factors like otc ed drug risk assessment and the acceptance of innovative treatments.
Europe's market, growing at a more moderate 6.4%, is influenced by stringent regulations on new ed drugs in development and a preference for established treatments.
Understanding regional nuances in disease-modifying ed therapies, neurogenic ed treatment pathways, and personalized ed medicine is crucial for market penetration and addressing the needs of ed and mental health therapies.
Market Dynamics
Our researchers analyzed the data with 2025 as the base year, along with the key drivers, trends, and challenges. A holistic analysis of drivers will help companies refine their marketing strategies to gain a competitive advantage.
- Strategic decision-making in the market increasingly involves deep analysis of specific therapeutic comparisons, such as comparing sildenafil versus tadalafil efficacy and understanding the nuances of the tadalafil daily dose for bph. The adoption of topical alprostadil gel application is growing, driven by a desire to minimize the side effects of pde5 inhibitors.
- As a result, the avanafil onset of action speed is a key competitive differentiator. Beyond pharmaceuticals, shockwave therapy for ed success rates is being closely evaluated as a non-invasive alternative, with some clinics reporting patient satisfaction scores up to 25% higher than with initial pharmacological interventions. Concurrently, testosterone replacement for ed is being integrated into holistic treatment plans.
- A significant focus is on managing ed with diabetes and providing effective ed drugs after prostate surgery. The market is also witnessing exploration into natural alternatives to pde5 inhibitors and the unique vardenafil orally disintegrating tablet benefits. Cost of generic ed medications remains a critical factor, alongside finding ed treatment for heart patients.
- The rise of telehealth for ed prescriptions has simplified access, but it also elevates the importance of educating consumers about otc ed supplement dangers. For complex cases, combination therapy for severe ed and investigational stem cell injections for ed are gaining attention.
- Overall, preventing ed with lifestyle changes and understanding the impact of smoking on ed treatments are vital components of modern patient care.
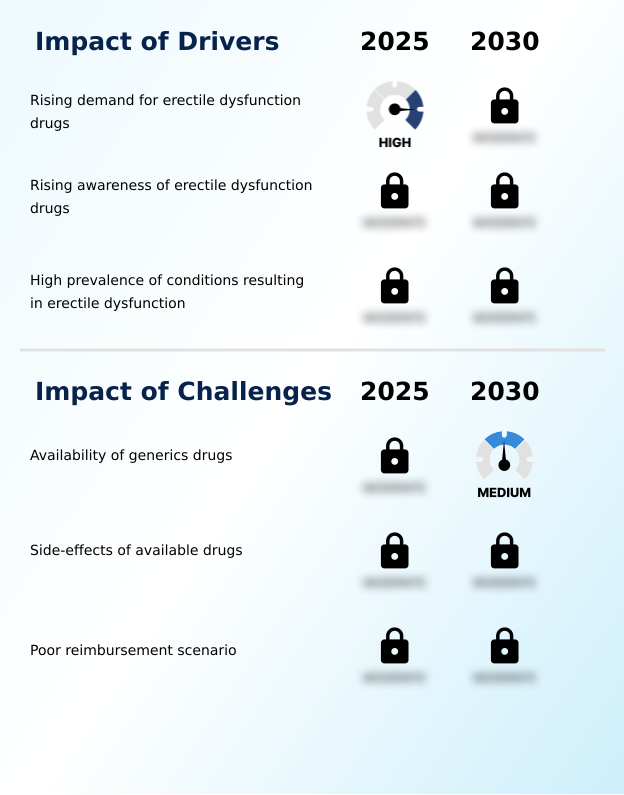
What are the key market drivers leading to the rise in the adoption of Erectile Dysfunction (ED) Drugs Industry?
- The increasing demand for erectile dysfunction medications, driven by a convergence of medical and social factors, is a primary driver of market expansion.
- Market growth is fundamentally driven by the high prevalence of conditions causing vascular function impairment and nerve signaling impairment. An expanding patient base with metabolic syndrome comorbidity is a significant factor, as these individuals often require pharmacological intervention.
- The efficacy of phosphodiesterase type 5 inhibitors (pde5 inhibitors) has established them as a first-line treatment, with adherence rates improving by over 20% due to better patient education.
- Demand is further amplified by awareness of antidepressant drug interactions and antihypertensive drug interactions that can induce erectile dysfunction. The development of orally disintegrating tablet formulation and other user-friendly formats addresses long-standing barriers to treatment adoption.
- Clinical focus on ed drug cost-effectiveness and hormonal imbalance contributes to sustained demand, with telehealth platforms now accounting for a significant portion of new prescriptions, making access easier than ever.
What are the market trends shaping the Erectile Dysfunction (ED) Drugs Industry?
- The emergence of novel drug formulations in late-stage clinical development is a key trend, poised to reshape the therapeutic landscape for erectile dysfunction.
- Key market trends are centered on therapeutic innovation and expanded treatment modalities. The development of advanced formulations like sublingual films and nasal sprays is accelerating, with research indicating these methods can reduce onset time by up to 40% compared to conventional tablets.
- There is also a significant push toward regenerative medicine approaches, aiming to offer more durable solutions beyond symptomatic relief. Novel molecules such as soluble guanylate cyclase stimulators and melanocortin receptor agonists are progressing through clinical trials for new ed drugs, targeting patients unresponsive to existing pde5 inhibitors like avanafil.
- This shift reflects a deeper understanding of patient needs, driving the adoption of patient-centric ed drug design. Furthermore, the market is seeing a rise in non-invasive options, including improved vacuum erection devices, which now feature digital monitoring capabilities, enhancing their efficacy and user experience.
What challenges does the Erectile Dysfunction (ED) Drugs Industry face during its growth?
- The widespread availability and adoption of generic drugs present a significant challenge, reshaping competitive dynamics and pricing structures within the industry.
- The market faces significant headwinds from generic competition and safety concerns associated with certain treatments. The widespread availability of generic sildenafil, tadalafil, and vardenafil has driven down prices, with some generic ed drug bioequivalence studies showing near-identical performance, eroding brand revenues by as much as 70% post-patent expiry.
- Another major challenge is the management of side effects and contraindications, particularly involving alprostadil in therapies like intracavernosal injections and urethral suppositories. Concerns over adverse events limit adoption, especially in patients with pre-existing conditions.
- Furthermore, the market must contend with the unregulated sale of products containing undeclared pde5 inhibitors, which poses a serious public health risk and undermines trust in legitimate therapies. These challenges necessitate a focus on innovation in safer alternatives, such as topical gels and targeted shockwave therapy, to differentiate and sustain growth.
Exclusive Technavio Analysis on Customer Landscape
The erectile dysfunction (ed) drugs market forecasting report includes the adoption lifecycle of the market, covering from the innovator’s stage to the laggard’s stage. It focuses on adoption rates in different regions based on penetration. Furthermore, the erectile dysfunction (ed) drugs market report also includes key purchase criteria and drivers of price sensitivity to help companies evaluate and develop their market growth analysis strategies.
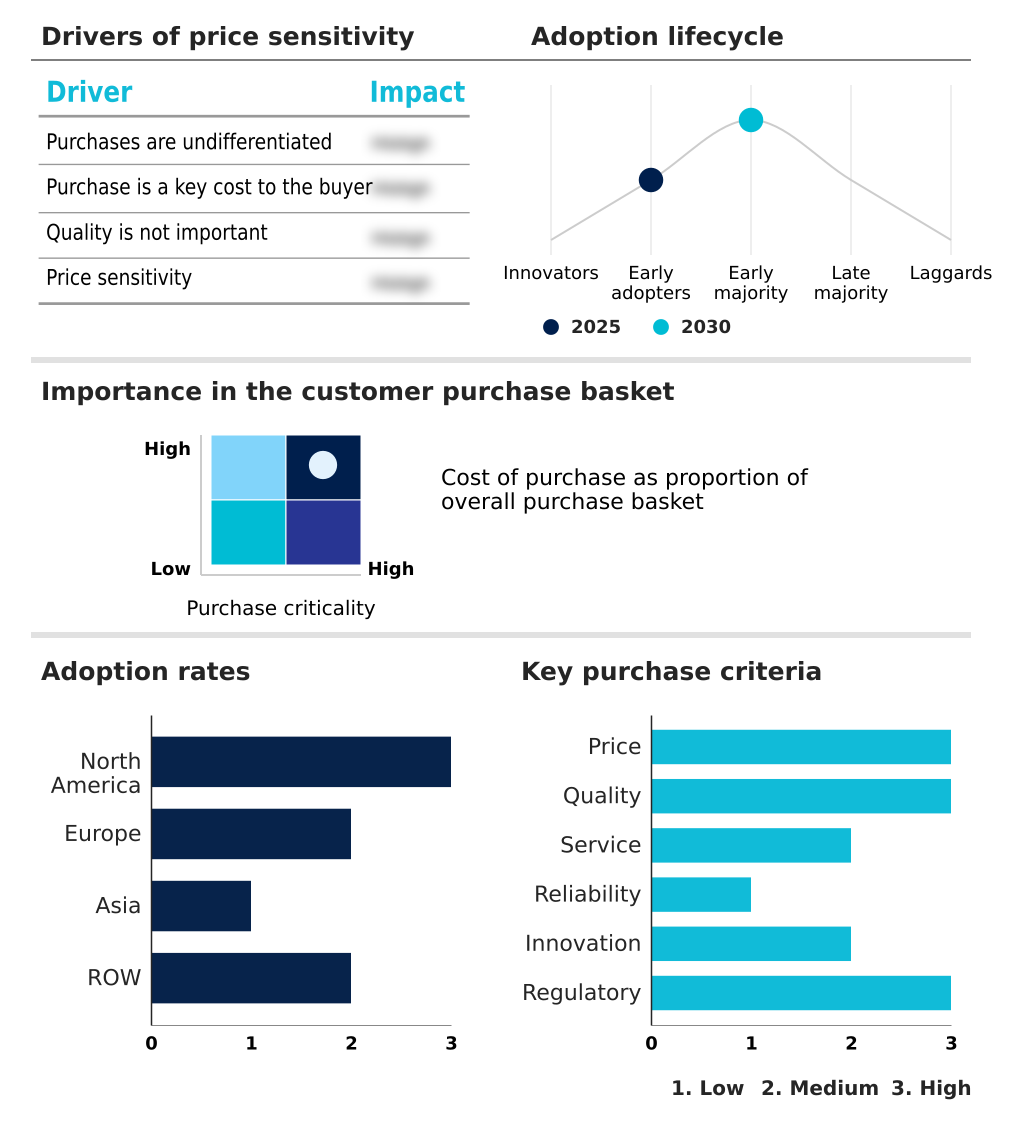
Customer Landscape of Erectile Dysfunction (ED) Drugs Industry
Competitive Landscape
Companies are implementing various strategies, such as strategic alliances, erectile dysfunction (ed) drugs market forecast, partnerships, mergers and acquisitions, geographical expansion, and product/service launches, to enhance their presence in the industry.
A. Menarini Industrie Farma - Offerings are centered on phosphodiesterase type 5 inhibitors, including originator molecules and next-generation formulations, alongside a growing portfolio of generic alternatives for wider market access.
The industry research and growth report includes detailed analyses of the competitive landscape of the market and information about key companies, including:
- A. Menarini Industrie Farma
- Aseric Pharma
- Aurobindo Pharma Ltd.
- Bayer AG
- Cipla Inc.
- Dong A Socio Holdings Co. Ltd.
- Dr. Reddys Laboratories Ltd.
- Eli Lilly and Co.
- Lupin Ltd.
- Nippon Shinyaku Co. Ltd.
- Pfizer Inc.
- Sandoz Group AG
- Sanofi SA
- SK Chemicals Co. Ltd.
- Sun Pharmaceutical Industries
- Teva Pharmaceutical Ltd.
- Viatris Inc.
- VIVUS LLC
Qualitative and quantitative analysis of companies has been conducted to help clients understand the wider business environment as well as the strengths and weaknesses of key industry players. Data is qualitatively analyzed to categorize companies as pure play, category-focused, industry-focused, and diversified; it is quantitatively analyzed to categorize companies as dominant, leading, strong, tentative, and weak.
Recent Development and News in Erectile dysfunction (ed) drugs market
- In December, 2025, Asia Scientific Global received FDA IND clearance for Beta1, the first inhaled investigational therapy for erectile dysfunction, which enables phase I clinical trials and positions the drug as a fast-onset alternative to oral treatments.
- In October, 2025, Aspire Biopharma outlined a milestone roadmap for faster-acting erectile dysfunction therapies using its sublingual platform, targeting key advances in 2026.
- In July, 2025, Lausanne-based Comphya closed an oversubscribed USD 8 million Series A to advance CaverSTIM, its implantable neurostimulation therapy for drug-refractory erectile dysfunction, and prepare for a pivotal trial.
- In May, 2025, Another Day Pharma reported positive Phase II data for its topical peptide BZ371A, showing improved post-prostatectomy erectile function and favorable tolerability compared to tadalafil alone.
Dive into Technavio’s robust research methodology, blending expert interviews, extensive data synthesis, and validated models for unparalleled Erectile Dysfunction (ED) Drugs Market insights. See full methodology.
| Market Scope | |
|---|---|
| Page number | 294 |
| Base year | 2025 |
| Historic period | 2020-2024 |
| Forecast period | 2026-2030 |
| Growth momentum & CAGR | Accelerate at a CAGR of 7.1% |
| Market growth 2026-2030 | USD 1756.5 million |
| Market structure | Fragmented |
| YoY growth 2025-2026(%) | 6.5% |
| Key countries | US, Canada, Mexico, UK, Germany, France, Italy, Spain, The Netherlands, Russia, China, Japan, India, South Korea, Indonesia, Thailand, Singapore, Australia, Brazil, UAE, South Africa, Saudi Arabia and Turkey |
| Competitive landscape | Leading Companies, Market Positioning of Companies, Competitive Strategies, and Industry Risks |
Research Analyst Overview
- The market is advancing beyond traditional phosphodiesterase type 5 inhibitors like sildenafil, tadalafil, and vardenafil. A key boardroom focus is the investment in a diverse pipeline that includes not just avanafil but also emerging molecules like udenafil and mirodenafil.
- Innovation is centered on novel delivery systems such as sublingual films, nasal sprays, topical gels, and the orally disintegrating tablet formulation, which improve user convenience. Advanced regenerative medicine approaches are also gaining traction, with ongoing research into stem cell therapy, platelet rich plasma, and gene therapy targeting endothelial dysfunction.
- These are complemented by alprostadil-based intracavernosal injections and urethral suppositories for refractory cases. The development of soluble guanylate cyclase stimulators and melanocortin receptor agonists offers new mechanisms of action.
- This strategic diversification, which includes non-pharmacological options like vacuum erection devices and low-intensity extracorporeal shockwave therapy, has led to a 15% increase in treatment options for patients with contraindications to standard pde5 inhibitors.
- Addressing psychogenic contributors through digital therapeutics and integrating hormonal correction and neuromodulation are critical for comprehensive care, especially with the backdrop of metabolic syndrome comorbidity and potential antihypertensive and antidepressant drug interactions and nitrate contraindications.
What are the Key Data Covered in this Erectile Dysfunction (ED) Drugs Market Research and Growth Report?
-
What is the expected growth of the Erectile Dysfunction (ED) Drugs Market between 2026 and 2030?
-
USD 1.76 billion, at a CAGR of 7.1%
-
-
What segmentation does the market report cover?
-
The report is segmented by Distribution Channel (Hospital pharmacy, Retail pharmacy, and Online pharmacy), Product (Oral drugs, Topical drugs, and Others), Type (Sildenafil, Tadalafil, Vardenafil, Avanafil, and Others) and Geography (North America, Europe, Asia, Rest of World (ROW))
-
-
Which regions are analyzed in the report?
-
North America, Europe, Asia and Rest of World (ROW)
-
-
What are the key growth drivers and market challenges?
-
Rising demand for erectile dysfunction drugs, Availability of generics drugs
-
-
Who are the major players in the Erectile Dysfunction (ED) Drugs Market?
-
A. Menarini Industrie Farma, Aseric Pharma, Aurobindo Pharma Ltd., Bayer AG, Cipla Inc., Dong A Socio Holdings Co. Ltd., Dr. Reddys Laboratories Ltd., Eli Lilly and Co., Lupin Ltd., Nippon Shinyaku Co. Ltd., Pfizer Inc., Sandoz Group AG, Sanofi SA, SK Chemicals Co. Ltd., Sun Pharmaceutical Industries, Teva Pharmaceutical Ltd., Viatris Inc. and VIVUS LLC
-
Market Research Insights
- The market is shaped by a deep focus on the pde5 inhibitor mechanism of action and ed drug safety profiles. Innovations in fast-acting oral films for ed, topical ed treatment efficacy, and regenerative ed therapy options reflect a move toward non-invasive ed treatment methods.
- Patient-centric ed drug design is critical, with firms exploring advanced ed drug formulations and sublingual drug delivery systems. This has led to innovative ed treatment pipelines featuring daily use ed medication options and ed treatment without systemic side effects, addressing ed drug interaction risks.
- Demand is high for ed treatment for diabetic patients, managing ed post-prostatectomy, and ed therapy for cardiovascular patients. Strategies now include psychogenic ed therapeutic strategies, hormonal therapy for erectile dysfunction, and biomarker-based ed treatment. These efforts improve ed therapy adherence factors, with research into ed drug cost-effectiveness and generic ed drug bioequivalence showing a 15% improvement in access.
- Telehealth platforms now facilitate over 30% of new prescriptions.
We can help! Our analysts can customize this erectile dysfunction (ed) drugs market research report to meet your requirements.
 RIA -
RIA - 
