Gesture Recognition Solution Market Analysis APAC, North America, Europe, Middle East and Africa, South America - US, China, Japan, Germany, South Korea - Size and Forecast 2024-2028

Gesture Recognition Solution Market Analysis APAC, North America, Europe, Middle East and Africa, South America - US, China, Japan, Germany, South Korea - Size and Forecast 2024-2028

Published: Jun 2024 181 Pages SKU: IRTNTR70905

Market Overview at a Glance

$73.44 B
Market Opportunity
37.91%
CAGR
28.4
YoY growth 2023-2024(%)

Gesture Recognition Solution Market Size 2024-2028 

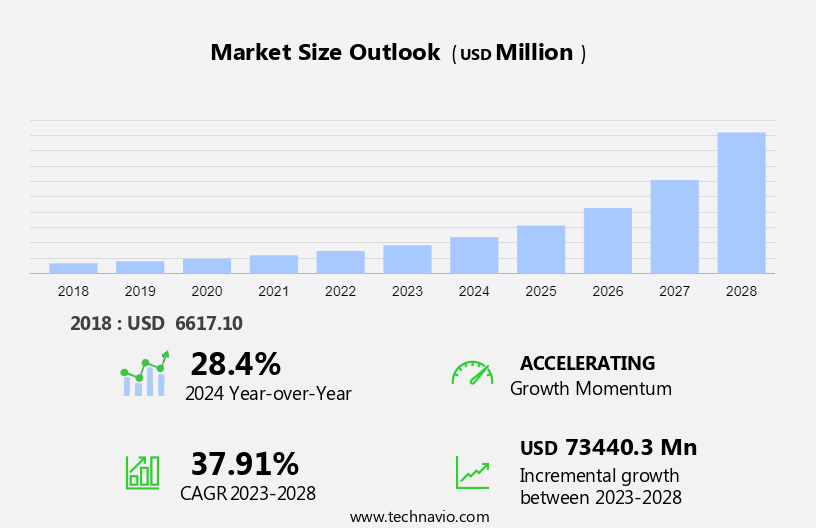
The gesture recognition solution market size is forecast to increase by USD 73.44 billion at a CAGR of 37.91% between 2023 and 2028. The market is experiencing significant growth due to several driving factors. One key trend is the increasing integration of ToF cameras in devices for advanced gesture recognition capabilities. Additionally, the development of processors specifically designed to support gesture recognition technology is accelerating market expansion. Furthermore, the low-value addition of this feature in electronic devices, such as laptops and luxury cars, is increasing its adoption rate. In the medical field, motion gesture technology is being utilized for rehabilitation purposes, showcasing its versatility and potential for various applications. Machine learning algorithms, including mathematical algorithms, are being employed to enhance gesture recognition accuracy and reliability. Multi-touch screens and advanced mouses are also incorporating gesture recognition technology, expanding its reach in the consumer electronics.

Gesture Recognition Solution Market Size

 Request Free Sample

The gesture recognition technology is a rapidly evolving field that allows users to interact with devices using natural body movements. This technology is gaining popularity in various industries, including consumer electronics, virtual reality, robotics, gaming, healthcare, and more. In North America, the demand for gesture recognition solutions is increasing due to the growing need for touchless interaction and the digitization of various sectors. Gesture recognition solutions consist of both hardware and software components. Hardware components include cameras and sensors that capture user movements. Software components include algorithms that analyze the captured data and recognize specific gestures.

Moreover, the embedded systems are also essential to process the data in real-time and enable seamless interaction between users and devices. Applications of Gesture Recognition Solutions: Gesture recognition technology has numerous applications in North America. In consumer electronics, it is used to control smartphones, televisions, and gaming consoles without the need for physical buttons or touchscreens. In virtual reality, it allows users to interact with digital environments using natural movements. In robotics, it enables humans to communicate and work with robots more effectively. In healthcare, it is used for rehabilitation therapy and patient monitoring. Benefits of Gesture Recognition Solutions: Gesture recognition solutions offer several benefits to users in North America.

Furthermore, they provide a touchless and convenient way to interact with devices, reducing the need for physical contact and promoting hygiene. They also offer a more intuitive and natural way to use technology, making it more accessible to people with disabilities or older adults. In addition, they can improve productivity and efficiency in various industries, such as healthcare and manufacturing. Future Outlook: The future of gesture recognition technology in North America looks promising. With the increasing digitization of various sectors and the growing need for touchless interaction, the demand for gesture recognition solutions is expected to continue growing. The technology is also expected to become more advanced and integrated into various devices and applications, offering new and innovative ways to interact with technology.

Market Segmentation

The market research report provides comprehensive data (region-wise segment analysis), with forecasts and estimates in "USD billion" for the period 2024-2028, as well as historical data from 2018-2022 for the following segments.

  • Technology
    • Touch-based
    • Touchless
  • Application
    • Gaming consoles
    • Smartphones
    • Automobiles
    • PCs
  • Geography
    • APAC
      • China
      • Japan
      • South Korea
    • North America
      • US
    • Europe
      • Germany
    • Middle East and Africa
    • South America

By Technology Insights

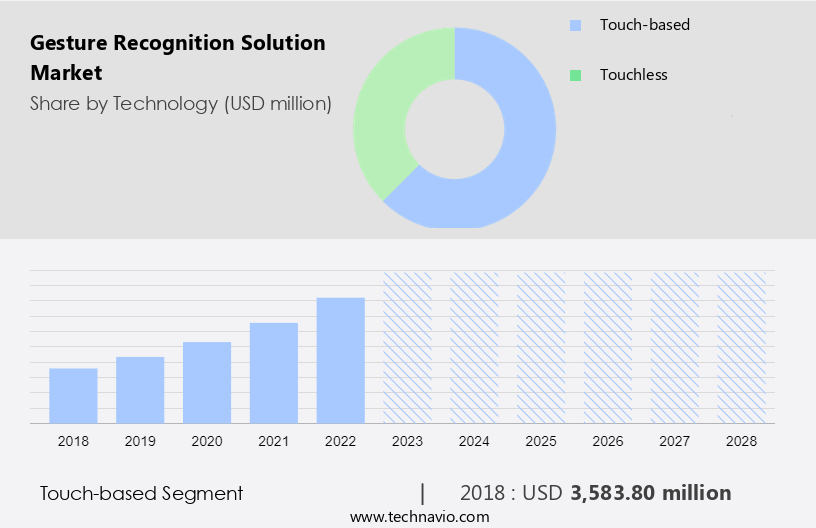
The touch-based segment is estimated to witness significant growth during the forecast period. In the realm of technology, multi-touch systems have gained significant traction in various industries, including retail stores and public transportation systems, due to their ability to enhance user experience through gesture recognition. This technology, which involves sensing techniques such as proximity detection and multi-touch, allows users to interact with devices without physical contact. However, its implementation extends beyond consumer electronics, with applications in robotics and security systems. Despite the potential benefits, the adoption of gesture recognition solutions faces several challenges. Regulations and security concerns are among the primary obstacles, as the technology raises questions about privacy and data protection.

Furthermore, per capita incomes in certain regions may limit the affordability of devices equipped with advanced gesture recognition features. Despite these challenges, the market for gesture recognition solutions is expected to grow steadily. The technology's integration into various industries, including retail and transportation, is poised to drive demand. As the technology becomes more accessible and affordable, it is likely to gain wider acceptance and become a standard feature in devices and systems. In conclusion, gesture recognition solutions offer significant potential for enhancing user experience across various industries. While challenges related to regulations, security, and affordability remain, the technology's benefits are expected to outweigh these obstacles, leading to steady growth in the market.

Gesture Recognition Solution Market Size

Get a glance at the market share of various segments Request Free Sample

The touch-based segment was valued at USD 3.58 billion in 2018 and showed a gradual increase during the forecast period.

Regional Insights

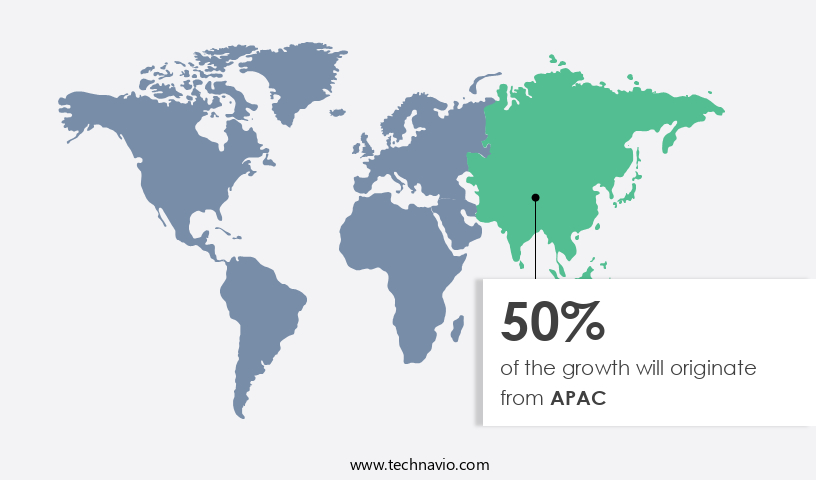
APAC is estimated to contribute 50% to the growth of the global market during the forecast period. Technavio’s analysts have elaborately explained the regional trends and drivers that shape the market during the forecast period.

Gesture Recognition Solution Market Share by Geography

For more insights on the market share of various regions Request Free Sample

The market in Asia Pacific (APAC) is experiencing significant growth due to the escalating demand for smartphones in this region. The affordability of low-cost smartphones in countries like India, Indonesia, Vietnam, the Philippines, Sri Lanka, and Pakistan has led to a demand in their popularity.  As leading brands like Apple and Samsung integrate advanced technologies such as 3D vision cameras into their devices, other manufacturers are expected to follow suit. This adoption of sophisticated hardware and software specifications will fuel the expansion of the market in APAC.

Moreover, gesture recognition technology is increasingly being adopted in commercial spaces and airports as well. This technology enables contactless interaction, making it an ideal solution for public areas where maintaining social distancing is crucial. Advanced algorithms and artificial intelligence (AI) are being employed to enhance the accuracy and efficiency of gesture recognition systems. With developer support and easy integration options, gesture recognition solutions are becoming more accessible to businesses and consumers alike. The integration of these solutions into consumer electronics, commercial spaces, and other industries will continue to drive the growth of the market in the coming years. 

Our researchers analyzed the data with 2023 as the base year, along with the key drivers, trends, and challenges. A holistic analysis of drivers will help companies refine their marketing strategies to gain a competitive advantage.

Market Driver

Increasing development of processors supporting gesture recognition is the key driver of the market. Gesture recognition technology enables electronic devices to interpret and respond to user gestures in real-time. This UI alternative relies on motion gestures as the primary data input source. A camera captures these gestures, which are then processed by sensing devices such as display capacitive sensors or those using electric field sensing.

The gesture recognition software analyzes the captured data against a predefined library of gestures, matching each gesture to a corresponding computer command. The identified gesture triggers the execution of the corresponding command, necessitating high processing speeds for efficient performance. This technology finds applications in various sectors, including driver safety, gaming, and healthcare, among others. Embedded systems in these industries leverage gesture recognition technology to enhance user experience and functionality.

Market Trends

Increasing priority for ToF cameras for gesture recognition is the upcoming trend in the market. Gesture recognition technology has gained significant traction in various industries, including electronics and medical rehabilitation. This technology allows users to control devices using motion gestures, eliminating the need for physical buttons or mice. Leading companies such as HP Development Company, L.P., Dell Technologies, and Apple Inc. Have integrated this technology into their laptops and luxury cars, among other devices, using advanced machine learning algorithms and mathematical algorithms. 3D depth-sensing cameras are the preferred choice for gesture recognition due to their higher accuracy compared to 2D cameras. These cameras use various techniques, such as structured light, passive stereo, active stereo, and Time of Flight (ToF), to detect and analyze motion gestures.

For instance, Apple's iPhones and iPads use ToF cameras for facial recognition and gesture control. Moreover, this technology is increasingly being used in medical rehabilitation to help patients regain mobility and independence. Multi-touch screens and mouses with gesture recognition capabilities are also becoming popular in the corporate world to enhance productivity and user experience. With the continuous advancements in machine learning algorithms and the increasing demand for intuitive user interfaces, the future of gesture recognition technology looks promising.

Market Challenge

Low-value addition of gesture recognition feature in electronic devices is a key challenge affecting market growth. In the realm of Human-Computer Interaction (HCI) and Human-Machine Interaction (HMI), gesture recognition technology has emerged as an innovative solution for enabling users to interact with electronic devices through motion gestures. This technology, which is particularly useful in healthcare spaces such as hospitals, relies on image sensors, including 2D cameras, to detect and interpret human movements. By offering a touch-free and smudge-free user experience, gesture recognition technology has gained popularity in various applications. However, its value proposition has been challenged by the rise of voice recognition technology and the increasing emphasis on power conservation and longer battery life in electronic devices.

Furthermore, the accuracy of 2D cameras in recognizing complex motion gestures has been a limitation. Consequently, some manufacturers have discontinued offering gesture recognition technology in their latest product releases.

Exclusive Customer Landscape

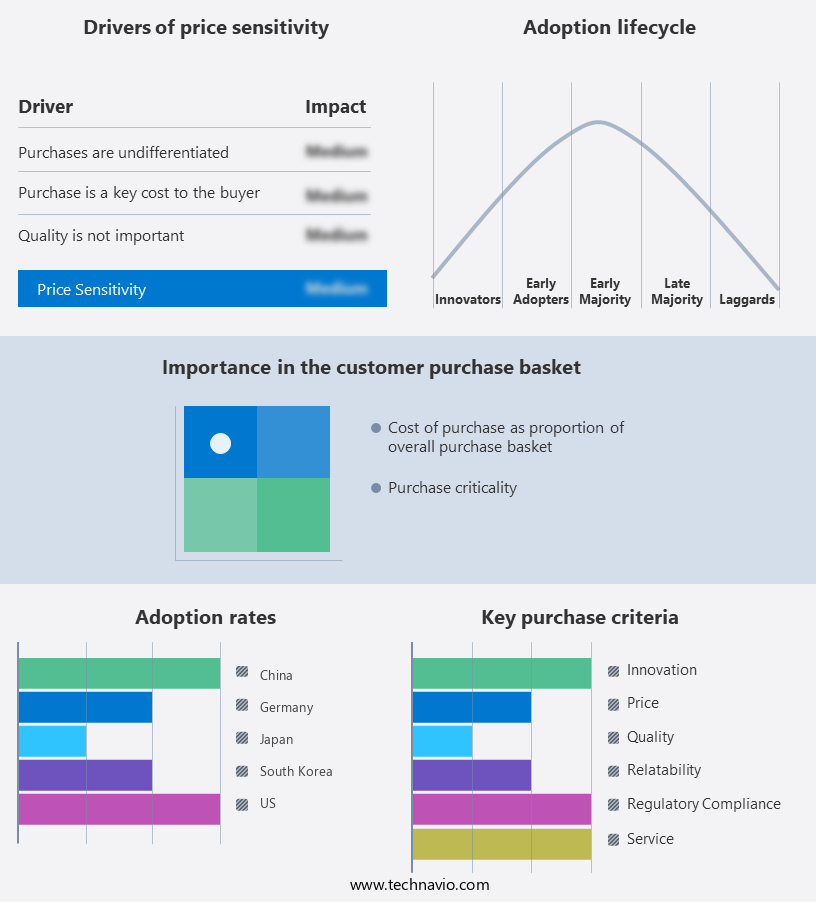
The market forecasting report includes the adoption lifecycle of the market, covering from the innovator’s stage to the laggard’s stage. It focuses on adoption rates in different regions based on penetration. Furthermore, the report also includes key purchase criteria and drivers of price sensitivity to help companies evaluate and develop their market growth analysis strategies.

Gesture Recognition Solution Market Share by Geography

 Customer Landscape

Key Companies & Market Insights

Companies are implementing various strategies, such as strategic alliances, partnerships, mergers and acquisitions, geographical expansion, and product/service launches, to enhance their presence in the market.

Cipia Vision Ltd. - The key offerings of the company include a gesture recognition solution that allows drivers and passengers to interact with vehicles for controlling the infotainment system without touching any buttons or screens.

The market research and growth report includes detailed analyses of the competitive landscape of the market and information about key companies, including:

  • Alphabet Inc.
  • Apple Inc.
  • Elliptic Laboratories AS
  • ESPROS Photonics Corp.
  • GestureTek technologies
  • Infineon Technologies AG
  • Intel Corp.
  • IrisGuard Ltd.
  • Jabil Inc.
  • Microchip Technology Inc.
  • NVIDIA Corp.
  • OMRON Corp.
  • Qualcomm Inc.
  • Sony Group Corp.
  • STMicroelectronics International N.V.
  • Synaptics Inc.
  • Texas Instruments Inc.
  • Ultraleap Ltd.
  • Vishay Intertechnology Inc.

Qualitative and quantitative analysis of companies has been conducted to help clients understand the wider business environment as well as the strengths and weaknesses of key market players. Data is qualitatively analyzed to categorize companies as pure play, category-focused, industry-focused, and diversified; it is quantitatively analyzed to categorize companies as dominant, leading, strong, tentative, and weak.

Research Analyst Overview

The gesture recognition solution market is experiencing significant growth due to the increasing adoption of advanced technologies in various industries. This technology enables systems to recognize and interpret human movements without physical contact, making it an attractive solution for interactive devices and applications. The use of 3D vision technologies, artificial intelligence (AI), and machine learning (ML) algorithms are driving the development of more sophisticated gesture recognition systems. Cameras, image sensors, and infrared sensors are essential hardware components for gesture recognition technology. These sensors capture data on human movements, which are then processed using mathematical algorithms and ML models to identify specific gestures.

Moreover, the technology is finding applications in consumer electronics, commercial spaces, healthcare, robotics, and even in luxury cars. The growing digitization of industries, such as retail and transportation, is also fueling the demand for gesture recognition technology. However, technical complexity and security concerns are potential challenges that need to be addressed by leading companies. Sensing techniques, such as electric field sensing and ultrasonic sensors, are being explored to enhance the capabilities of gesture recognition systems. Gesture recognition technology is transforming human-computer interaction (HCI) and human-machine interaction (HMI) in various applications, including driver safety, healthcare spaces, and public transportation systems.

Furthermore, it is also finding use in gaming, virtual reality, and touchless multifactor authentication systems. The market is expected to grow further as per capita incomes increase and technology becomes more accessible to consumers.

Market Scope

Report Coverage

Details

Page number

181

Base year

2023

Historic period

2018-2022

Forecast period

2024-2028

Growth momentum & CAGR

Accelerate at a CAGR of 37.91%

Market growth 2024-2028

USD 73.44 billion

Market structure

Fragmented

YoY growth 2023-2024(%)

28.4

Regional analysis

APAC, North America, Europe, Middle East and Africa, and South America

Performing market contribution

APAC at 50%

Key countries

US, China, Japan, Germany, and South Korea

Competitive landscape

Leading Companies, Market Positioning of Companies, Competitive Strategies, and Industry Risks

Key companies profiled

Alphabet Inc., Apple Inc., Cipia Vision Ltd., Elliptic Laboratories AS, ESPROS Photonics Corp., GestureTek technologies, Infineon Technologies AG, Intel Corp., IrisGuard Ltd., Jabil Inc., Microchip Technology Inc., NVIDIA Corp., OMRON Corp., Qualcomm Inc., Sony Group Corp., STMicroelectronics International N.V., Synaptics Inc., Texas Instruments Inc., Ultraleap Ltd., and Vishay Intertechnology Inc.

Market dynamics

Parent market analysis, market growth inducers and obstacles, market forecast, fast-growing and slow-growing segment analysis, COVID-19 impact and recovery analysis and future consumer dynamics, market condition analysis for the forecast period

Customization purview

If our market report has not included the data that you are looking for, you can reach out to our analysts and get segments customized.

Request Free Sample

What are the Key Data Covered in this Market Research and Growth Report?

  • CAGR of the market during the forecast period
  • Detailed information on factors that will drive the market growth and forecasting between 2024 and 2028
  • Precise estimation of the size of the market  and its contribution of the market in focus to the parent market
  • Accurate predictions about upcoming market growth and trends and changes in consumer behaviour
  • Growth of the market across APAC, North America, Europe, Middle East and Africa, and South America
  • Thorough analysis of the market’s competitive landscape and detailed information about companies
  • Comprehensive analysis of factors that will challenge the growth of market companies

We can help! Our analysts can customize this market research report to meet your requirements. Get in touch

1 Executive Summary

  • 1.1 Market overview
    • Executive Summary - Chart on Market Overview
    • Executive Summary - Data Table on Market Overview
    • Executive Summary - Chart on Global Market Characteristics
    • Executive Summary - Chart on Market by Geography
    • Executive Summary - Chart on Market Segmentation by Technology
    • Executive Summary - Chart on Market Segmentation by Application
    • Executive Summary - Chart on Incremental Growth
    • Executive Summary - Data Table on Incremental Growth
    • Executive Summary - Chart on Company Market Positioning

2 Market Landscape

  • 2.1 Market ecosystem
    • Parent Market
    • Data Table on - Parent Market
  • 2.2 Market characteristics
    • Market characteristics analysis
  • 2.3 Value chain analysis
    • Value Chain Analysis

3 Market Sizing

  • 3.1 Market definition
    • Offerings of companies included in the market definition
  • 3.2 Market segment analysis
    • Market segments
  • 3.3 Market size 2023
    • 3.4 Market outlook: Forecast for 2023-2028
      • Chart on Global - Market size and forecast 2023-2028 ($ million)
      • Data Table on Global - Market size and forecast 2023-2028 ($ million)
      • Chart on Global Market: Year-over-year growth 2023-2028 (%)
      • Data Table on Global Market: Year-over-year growth 2023-2028 (%)

    4 Historic Market Size

    • 4.1 Global Gesture Recognition Solution Market 2018 - 2022
      • Historic Market Size - Data Table on Global Gesture Recognition Solution Market 2018 - 2022 ($ million)
    • 4.2 Technology segment analysis 2018 - 2022
      • Historic Market Size - Technology Segment 2018 - 2022 ($ million)
    • 4.3 Application segment analysis 2018 - 2022
      • Historic Market Size - Application Segment 2018 - 2022 ($ million)
    • 4.4 Geography segment analysis 2018 - 2022
      • Historic Market Size - Geography Segment 2018 - 2022 ($ million)
    • 4.5 Country segment analysis 2018 - 2022
      • Historic Market Size - Country Segment 2018 - 2022 ($ million)

    5 Five Forces Analysis

    • 5.1 Five forces summary
      • Five forces analysis - Comparison between 2023 and 2028
    • 5.2 Bargaining power of buyers
      • Bargaining power of buyers - Impact of key factors 2023 and 2028
    • 5.3 Bargaining power of suppliers
      • Bargaining power of suppliers - Impact of key factors in 2023 and 2028
    • 5.4 Threat of new entrants
      • Threat of new entrants - Impact of key factors in 2023 and 2028
    • 5.5 Threat of substitutes
      • Threat of substitutes - Impact of key factors in 2023 and 2028
    • 5.6 Threat of rivalry
      • Threat of rivalry - Impact of key factors in 2023 and 2028
    • 5.7 Market condition
      • Chart on Market condition - Five forces 2023 and 2028

    6 Market Segmentation by Technology

    • 6.1 Market segments
      • Chart on Technology - Market share 2023-2028 (%)
      • Data Table on Technology - Market share 2023-2028 (%)
    • 6.2 Comparison by Technology
      • Chart on Comparison by Technology
      • Data Table on Comparison by Technology
    • 6.3 Touch-based - Market size and forecast 2023-2028
      • Chart on Touch-based - Market size and forecast 2023-2028 ($ million)
      • Data Table on Touch-based - Market size and forecast 2023-2028 ($ million)
      • Chart on Touch-based - Year-over-year growth 2023-2028 (%)
      • Data Table on Touch-based - Year-over-year growth 2023-2028 (%)
    • 6.4 Touchless - Market size and forecast 2023-2028
      • Chart on Touchless - Market size and forecast 2023-2028 ($ million)
      • Data Table on Touchless - Market size and forecast 2023-2028 ($ million)
      • Chart on Touchless - Year-over-year growth 2023-2028 (%)
      • Data Table on Touchless - Year-over-year growth 2023-2028 (%)
    • 6.5 Market opportunity by Technology
      • Market opportunity by Technology ($ million)
      • Data Table on Market opportunity by Technology ($ million)

    7 Market Segmentation by Application

    • 7.1 Market segments
      • Chart on Application - Market share 2023-2028 (%)
      • Data Table on Application - Market share 2023-2028 (%)
    • 7.2 Comparison by Application
      • Chart on Comparison by Application
      • Data Table on Comparison by Application
    • 7.3 Gaming consoles - Market size and forecast 2023-2028
      • Chart on Gaming consoles - Market size and forecast 2023-2028 ($ million)
      • Data Table on Gaming consoles - Market size and forecast 2023-2028 ($ million)
      • Chart on Gaming consoles - Year-over-year growth 2023-2028 (%)
      • Data Table on Gaming consoles - Year-over-year growth 2023-2028 (%)
    • 7.4 Smartphones - Market size and forecast 2023-2028
      • Chart on Smartphones - Market size and forecast 2023-2028 ($ million)
      • Data Table on Smartphones - Market size and forecast 2023-2028 ($ million)
      • Chart on Smartphones - Year-over-year growth 2023-2028 (%)
      • Data Table on Smartphones - Year-over-year growth 2023-2028 (%)
    • 7.5 Automobiles - Market size and forecast 2023-2028
      • Chart on Automobiles - Market size and forecast 2023-2028 ($ million)
      • Data Table on Automobiles - Market size and forecast 2023-2028 ($ million)
      • Chart on Automobiles - Year-over-year growth 2023-2028 (%)
      • Data Table on Automobiles - Year-over-year growth 2023-2028 (%)
    • 7.6 PCs - Market size and forecast 2023-2028
      • Chart on PCs - Market size and forecast 2023-2028 ($ million)
      • Data Table on PCs - Market size and forecast 2023-2028 ($ million)
      • Chart on PCs - Year-over-year growth 2023-2028 (%)
      • Data Table on PCs - Year-over-year growth 2023-2028 (%)
    • 7.7 Market opportunity by Application
      • Market opportunity by Application ($ million)
      • Data Table on Market opportunity by Application ($ million)

    8 Customer Landscape

    • 8.1 Customer landscape overview
      • Analysis of price sensitivity, lifecycle, customer purchase basket, adoption rates, and purchase criteria

    9 Geographic Landscape

    • 9.1 Geographic segmentation
      • Chart on Market share by geography 2023-2028 (%)
      • Data Table on Market share by geography 2023-2028 (%)
    • 9.2 Geographic comparison
      • Chart on Geographic comparison
      • Data Table on Geographic comparison
    • 9.3 APAC - Market size and forecast 2023-2028
      • Chart on APAC - Market size and forecast 2023-2028 ($ million)
      • Data Table on APAC - Market size and forecast 2023-2028 ($ million)
      • Chart on APAC - Year-over-year growth 2023-2028 (%)
      • Data Table on APAC - Year-over-year growth 2023-2028 (%)
    • 9.4 North America - Market size and forecast 2023-2028
      • Chart on North America - Market size and forecast 2023-2028 ($ million)
      • Data Table on North America - Market size and forecast 2023-2028 ($ million)
      • Chart on North America - Year-over-year growth 2023-2028 (%)
      • Data Table on North America - Year-over-year growth 2023-2028 (%)
    • 9.5 Europe - Market size and forecast 2023-2028
      • Chart on Europe - Market size and forecast 2023-2028 ($ million)
      • Data Table on Europe - Market size and forecast 2023-2028 ($ million)
      • Chart on Europe - Year-over-year growth 2023-2028 (%)
      • Data Table on Europe - Year-over-year growth 2023-2028 (%)
    • 9.6 Middle East and Africa - Market size and forecast 2023-2028
      • Chart on Middle East and Africa - Market size and forecast 2023-2028 ($ million)
      • Data Table on Middle East and Africa - Market size and forecast 2023-2028 ($ million)
      • Chart on Middle East and Africa - Year-over-year growth 2023-2028 (%)
      • Data Table on Middle East and Africa - Year-over-year growth 2023-2028 (%)
    • 9.7 South America - Market size and forecast 2023-2028
      • Chart on South America - Market size and forecast 2023-2028 ($ million)
      • Data Table on South America - Market size and forecast 2023-2028 ($ million)
      • Chart on South America - Year-over-year growth 2023-2028 (%)
      • Data Table on South America - Year-over-year growth 2023-2028 (%)
    • 9.8 US - Market size and forecast 2023-2028
      • Chart on US - Market size and forecast 2023-2028 ($ million)
      • Data Table on US - Market size and forecast 2023-2028 ($ million)
      • Chart on US - Year-over-year growth 2023-2028 (%)
      • Data Table on US - Year-over-year growth 2023-2028 (%)
    • 9.9 China - Market size and forecast 2023-2028
      • Chart on China - Market size and forecast 2023-2028 ($ million)
      • Data Table on China - Market size and forecast 2023-2028 ($ million)
      • Chart on China - Year-over-year growth 2023-2028 (%)
      • Data Table on China - Year-over-year growth 2023-2028 (%)
    • 9.10 Japan - Market size and forecast 2023-2028
      • Chart on Japan - Market size and forecast 2023-2028 ($ million)
      • Data Table on Japan - Market size and forecast 2023-2028 ($ million)
      • Chart on Japan - Year-over-year growth 2023-2028 (%)
      • Data Table on Japan - Year-over-year growth 2023-2028 (%)
    • 9.11 Germany - Market size and forecast 2023-2028
      • Chart on Germany - Market size and forecast 2023-2028 ($ million)
      • Data Table on Germany - Market size and forecast 2023-2028 ($ million)
      • Chart on Germany - Year-over-year growth 2023-2028 (%)
      • Data Table on Germany - Year-over-year growth 2023-2028 (%)
    • 9.12 South Korea - Market size and forecast 2023-2028
      • Chart on South Korea - Market size and forecast 2023-2028 ($ million)
      • Data Table on South Korea - Market size and forecast 2023-2028 ($ million)
      • Chart on South Korea - Year-over-year growth 2023-2028 (%)
      • Data Table on South Korea - Year-over-year growth 2023-2028 (%)
    • 9.13 Market opportunity by geography
      • Market opportunity by geography ($ million)
      • Data Tables on Market opportunity by geography ($ million)

    10 Drivers, Challenges, and Opportunity/Restraints

    • 10.1 Market drivers
      • 10.2 Market challenges
        • 10.3 Impact of drivers and challenges
          • Impact of drivers and challenges in 2023 and 2028
        • 10.4 Market opportunities/restraints

          11 Competitive Landscape

          • 11.1 Overview
            • 11.2 Competitive Landscape
              • Overview on criticality of inputs and factors of differentiation
            • 11.3 Landscape disruption
              • Overview on factors of disruption
            • 11.4 Industry risks
              • Impact of key risks on business

            12 Competitive Analysis

            • 12.1 Companies profiled
              • Companies covered
            • 12.2 Market positioning of companies
              • Matrix on companies position and classification
            • 12.3 Alphabet Inc.
              • Alphabet Inc. - Overview
              • Alphabet Inc. - Business segments
              • Alphabet Inc. - Key offerings
              • Alphabet Inc. - Segment focus
            • 12.4 Apple Inc.
              • Apple Inc. - Overview
              • Apple Inc. - Business segments
              • Apple Inc. - Key news
              • Apple Inc. - Key offerings
              • Apple Inc. - Segment focus
            • 12.5 Cipia Vision Ltd.
              • Cipia Vision Ltd. - Overview
              • Cipia Vision Ltd. - Product / Service
              • Cipia Vision Ltd. - Key offerings
            • 12.6 GestureTek technologies
              • GestureTek technologies - Overview
              • GestureTek technologies - Product / Service
              • GestureTek technologies - Key offerings
            • 12.7 Infineon Technologies AG
              • Infineon Technologies AG - Overview
              • Infineon Technologies AG - Business segments
              • Infineon Technologies AG - Key news
              • Infineon Technologies AG - Key offerings
              • Infineon Technologies AG - Segment focus
            • 12.8 Intel Corp.
              • Intel Corp. - Overview
              • Intel Corp. - Business segments
              • Intel Corp. - Key news
              • Intel Corp. - Key offerings
              • Intel Corp. - Segment focus
            • 12.9 IrisGuard Ltd.
              • IrisGuard Ltd. - Overview
              • IrisGuard Ltd. - Product / Service
              • IrisGuard Ltd. - Key offerings
            • 12.10 Jabil Inc.
              • Jabil Inc. - Overview
              • Jabil Inc. - Business segments
              • Jabil Inc. - Key news
              • Jabil Inc. - Key offerings
              • Jabil Inc. - Segment focus
            • 12.11 Microchip Technology Inc.
              • Microchip Technology Inc. - Overview
              • Microchip Technology Inc. - Business segments
              • Microchip Technology Inc. - Key news
              • Microchip Technology Inc. - Key offerings
              • Microchip Technology Inc. - Segment focus
            • 12.12 NVIDIA Corp.
              • NVIDIA Corp. - Overview
              • NVIDIA Corp. - Business segments
              • NVIDIA Corp. - Key news
              • NVIDIA Corp. - Key offerings
              • NVIDIA Corp. - Segment focus
            • 12.13 OMRON Corp.
              • OMRON Corp. - Overview
              • OMRON Corp. - Business segments
              • OMRON Corp. - Key news
              • OMRON Corp. - Key offerings
              • OMRON Corp. - Segment focus
            • 12.14 Qualcomm Inc.
              • Qualcomm Inc. - Overview
              • Qualcomm Inc. - Business segments
              • Qualcomm Inc. - Key news
              • Qualcomm Inc. - Key offerings
              • Qualcomm Inc. - Segment focus
            • 12.15 STMicroelectronics International N.V.
              • STMicroelectronics International N.V. - Overview
              • STMicroelectronics International N.V. - Business segments
              • STMicroelectronics International N.V. - Key news
              • STMicroelectronics International N.V. - Key offerings
              • STMicroelectronics International N.V. - Segment focus
            • 12.16 Synaptics Inc.
              • Synaptics Inc. - Overview
              • Synaptics Inc. - Product / Service
              • Synaptics Inc. - Key offerings
            • 12.17 Ultraleap Ltd.
              • Ultraleap Ltd. - Overview
              • Ultraleap Ltd. - Product / Service
              • Ultraleap Ltd. - Key offerings

            13 Appendix

            • 13.1 Scope of the report
              • 13.2 Inclusions and exclusions checklist
                • Inclusions checklist
                • Exclusions checklist
              • 13.3 Currency conversion rates for US$
                • Currency conversion rates for US$
              • 13.4 Research methodology
                • Research methodology
              • 13.5 Data procurement
                • Information sources
              • 13.6 Data validation
                • Data validation
              • 13.7 Validation techniques employed for market sizing
                • Validation techniques employed for market sizing
              • 13.8 Data synthesis
                • Data synthesis
              • 13.9 360 degree market analysis
                • 360 degree market analysis
              • 13.10 List of abbreviations
                • List of abbreviations

              Research Methodology

              Technavio presents a detailed picture of the market by way of study, synthesis, and summation of data from multiple sources. The analysts have presented the various facets of the market with a particular focus on identifying the key industry influencers. The data thus presented is comprehensive, reliable, and the result of extensive research, both primary and secondary.

              INFORMATION SOURCES

              Primary sources

              • Manufacturers and suppliers
              • Channel partners
              • Industry experts
              • Strategic decision makers

              Secondary sources

              • Industry journals and periodicals
              • Government data
              • Financial reports of key industry players
              • Historical data
              • Press releases

              DATA ANALYSIS

              Data Synthesis

              • Collation of data
              • Estimation of key figures
              • Analysis of derived insights

              Data Validation

              • Triangulation with data models
              • Reference against proprietary databases
              • Corroboration with industry experts

              REPORT WRITING

              Qualitative

              • Market drivers
              • Market challenges
              • Market trends
              • Five forces analysis

              Quantitative

              • Market size and forecast
              • Market segmentation
              • Geographical insights
              • Competitive landscape

              Interested in this report?

              Get your sample now to see our research methodology and insights!

              Download Now

              Frequently Asked Questions

              Gesture Recognition Solution market growth will increase by $ 73440.3 mn during 2024-2028.

              The Gesture Recognition Solution market is expected to grow at a CAGR of 37.91% during 2024-2028.

              Gesture Recognition Solution market is segmented by Technology( Touch-based, Touchless, Automobiles, PCs) Application( Gaming consoles, Smartphones, Automobiles, PCs, South America)

              Alphabet Inc., Apple Inc., Cipia Vision Ltd., Elliptic Laboratories AS, ESPROS Photonics Corp., GestureTek technologies, Infineon Technologies AG, Intel Corp., IrisGuard Ltd., Jabil Inc., Microchip Technology Inc., NVIDIA Corp., OMRON Corp., Qualcomm Inc., Sony Group Corp., STMicroelectronics International N.V., Synaptics Inc., Texas Instruments Inc., Ultraleap Ltd., Vishay Intertechnology Inc. are a few of the key vendors in the Gesture Recognition Solution market.

              APAC will register the highest growth rate of 50% among the other regions. Therefore, the Gesture Recognition Solution market in APAC is expected to garner significant business opportunities for the vendors during the forecast period.

              US, China, Japan, Germany, South Korea

              • Increasing development of processors supporting gesture recognitionGesture recognition is an alternative user interface (UI) that provides real-time data to electronic devices in the form of gestures. Motion gestures are considered the primary source of data input. A camera is used to capture motion gestures. The camera feeds the image data into sensing devices is the driving factor this market.
              • which could be an IR sensor or a projector is the driving factor this market.
              • for calculating the depth of the image. The gesture recognition software identifies motion gestures from a predetermined gesture library is the driving factor this market.
              • wherein each gesture is matched to a computer command. Once the gesture has been interpreted is the driving factor this market.
              • the specific command for the gesture is executed. High processing speed is required for executing the command. This is the driving factor this market.
              • in turn is the driving factor this market.
              • increases the need for powerful processors. For instance is the driving factor this market.
              • In December 2020 is the driving factor this market.
              • Intel launched revealed Loihi chip improvements in voice command recognition is the driving factor this market.
              • gesture recognition in artificial intelligence (AI) applications is the driving factor this market.
              • image retrieval is the driving factor this market.
              • search functions is the driving factor this market.
              • and robotics. Such factors are expected to drive the growth of the global gesture recognition solution market during the forecast period. is the driving factor this market.

              The Gesture Recognition Solution market vendors should focus on grabbing business opportunities from the Touch-based segment as it accounted for the largest market share in the base year.