Infrared Sensors Market Analysis APAC, North America, Europe, South America, Middle East and Africa - US, China, Japan, Germany, South Korea - Size and Forecast 2024-2028

Infrared Sensors Market Analysis APAC, North America, Europe, South America, Middle East and Africa - US, China, Japan, Germany, South Korea - Size and Forecast 2024-2028

Published: Jul 2024 186 Pages SKU: IRTNTR70607

Market Overview at a Glance

$284.3 Mn
Market Opportunity
9.45%
CAGR
8.41
YoY growth 2023-2024(%)

Infrared Sensors Market Size 2024-2028 

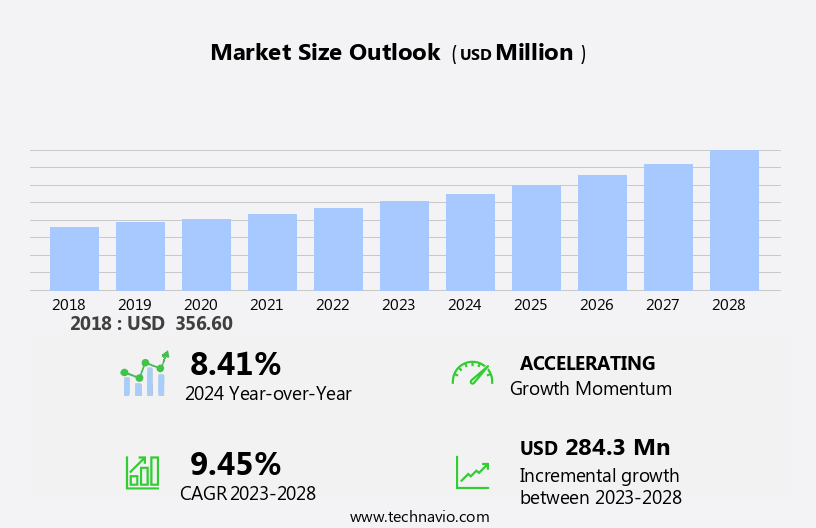
The infrared sensors market size is forecast to increase by USD 284.3 million at a CAGR of 9.45% between 2023 and 2028.

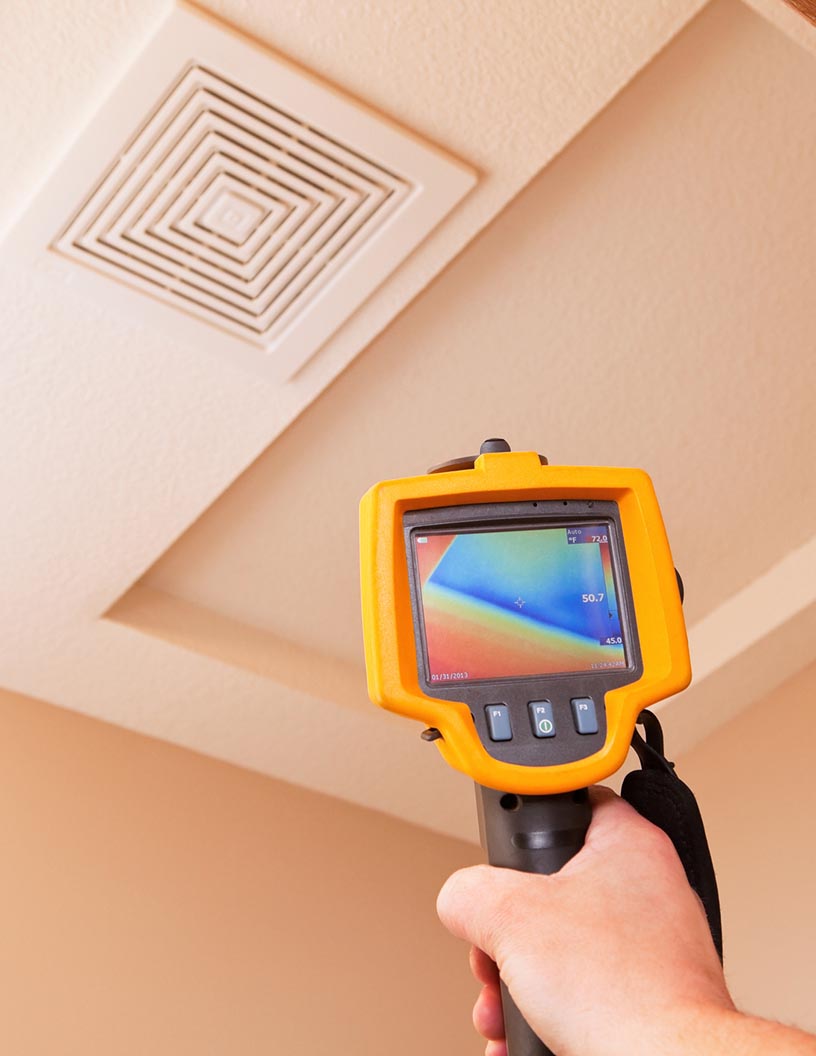
  • Infrared sensors have gained significant traction in various industries due to their ability to detect objects in darkness. The market for infrared sensors is driven by several factors, including the increasing number of burglaries and the adoption of night vision technologies in smart home devices such as doorbells. Additionally, the impact of environmental conditions, particularly temperature and humidity, is a key challenge that manufacturers must address to ensure product reliability. These sensors are essential for applications in security systems, industrial automation, and medical devices, among others. As the demand for these applications continues to grow, the market is expected to expand at a steady pace. The use of advanced technologies like machine learning and artificial intelligence to enhance performance is also a significant trend In the market. Overall, the market presents numerous opportunities for growth and innovation.

What will be the Size of the Infrared Sensors Market During the Forecast Period?

Infrared Sensors Market Size

 Request Free Sample

  • The infrared sensor market encompasses a range of technologies, including IR LEDs, photodiodes, and micro-electromechanical systems (MEMS), which convert infrared radiation into electrical signals. These sensors find extensive applications in various industries, including consumer electronics, automotive, industrial facilities, defense, and surveillance.
  • Notable trends include the integration of IR sensors in smartphones for facial recognition and night vision capabilities, the use of anti-masking technology to enhance the performance of IR sensors in dusty atmospheres, and the adoption of IR sensors in autonomous vehicles and ADAS systems for thermal imaging and obstacle detection. Furthermore, IR sensors are increasingly utilized in smart cameras, connected cars, machines, wearables, and other applications, driving market growth. The versatility and ability to function in various environments make them indispensable for numerous applications, ensuring their continued relevance and expansion in diverse sectors.

How is this Infrared Sensors Industry segmented and which is the largest segment?

The research report provides comprehensive data (region-wise segment analysis), with forecasts and estimates in "USD million" for the period 2024-2028, as well as historical data from 2018-2022 for the following segments.
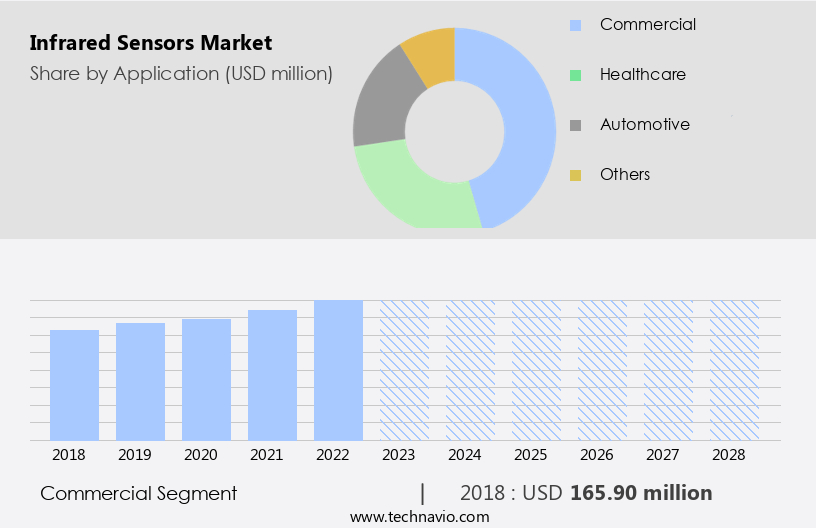
  • Application
    • Commercial
    • Healthcare
    • Automotive
    • Others
  • Technology
    • Pyroelectric
    • Thermopile
    • Microbolometers
    • InGaAs
    • MCT
  • Geography
    • APAC
      • China
      • Japan
      • South Korea
    • North America
      • US
    • Europe
      • Germany
    • South America
    • Middle East and Africa

By Application Insights

  • The commercial segment is estimated to witness significant growth during the forecast period.

Infrared sensors, a critical component in various industries, find extensive applications in consumer electronics and monitoring and surveillance. The proliferation of smartphones and tablets, driven by their compact size and advanced features, has significantly boosted the demand for miniature type. These sensors are integral to high-quality cameras and gesture recognition devices, making them indispensable In the consumer electronics sector. They are also extensively used in security and surveillance systems, including smart cameras and autonomous vehicles, to ensure safety and security. They come in different forms, such as infrared LED, photodiode, passive infrared sensor, and infrared motion sensor.

Technologies like LIDAR and thermal imaging further expand their applications in industries like automotive, military and defense, IoT, and healthcare. The integration in industrial processes, machinery safety, and smart home devices enhances efficiency, productivity, and convenience.

Infrared Sensors Market Size

Get a glance at the  Infrared Sensors Industry report of share of various segments Request Free Sample

The Commercial segment was valued at USD 165.90 million in 2018 and showed a gradual increase during the forecast period.

Regional Analysis

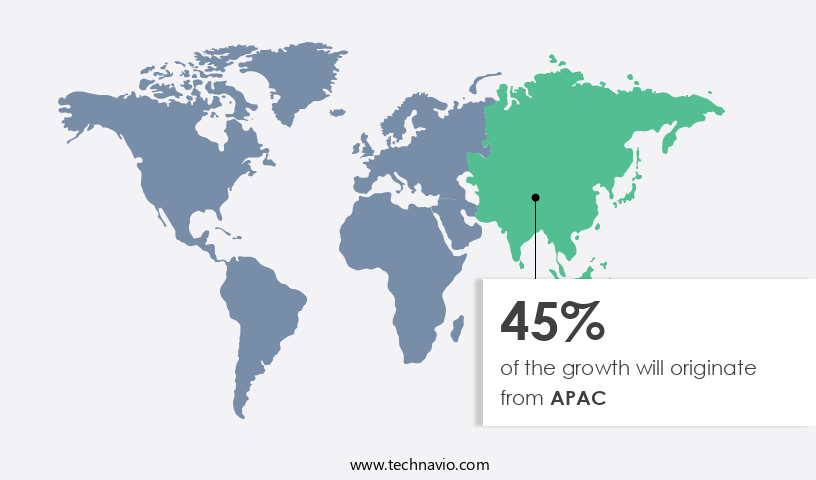
  • APAC is estimated to contribute 45% to the growth of the global market during the forecast period.

Technavio's analysts have elaborately explained the regional trends and drivers that shape the market during the forecast period.

Infrared Sensors Market Share by Geography

For more insights on the market share of various regions, Request Free Sample

Infrared sensors, a critical component in various industries, experienced significant demand in 2023, with the Asia Pacific region leading the global market. The availability of raw materials and lower production costs have encouraged these companies to establish production centers In the region. End-users, such as consumer electronics and automotive industries, will continue to demand for applications like smartphones, smart cameras, autonomous vehicles, and ADAS systems. These are also essential in industrial processes, IoT devices, smart home systems, and healthcare applications, among others.

Furthermore, these come in various forms, such as passive ones, IR temperature sensors, IR motion sensors, and IR proximity sensors. These sensors play a crucial role in applications like child presence detection, pyroelectric for video surveillance, LIDAR technology for near-infrared imaging, and thermal imaging technology for defense and industrial facilities. They are also integrated into wearables, connected cars, and machines for motion sensing, machinery safety, and quality control. These are essential for various applications In the automotive, industrial, consumer electronics, and healthcare industries.

Market Dynamics

Our infrared sensors market researchers analyzed the data with 2023 as the base year, along with the key drivers, trends, and challenges. A holistic analysis of drivers will help companies refine their marketing strategies to gain a competitive advantage.

What are the key market drivers leading to the rise In the adoption of Infrared Sensors Industry?

Increasing number of burglaries is the key driver of the market.

  • It is a crucial component of various technologies, have gained significant traction in numerous industries due to their ability to detect presence, motion, and temperature In the absence of visible light. IR sensors utilize IR LED and photodiodes to convert IR radiation into electrical signals. These sensors are integral to smartphones and smart cameras for features like facial recognition and autofocus. In the automotive sector, they are employed in autonomous vehicles and Advanced Driver-Assistance Systems (ADAS) for motion sensing and night vision capabilities. sensors also find applications in military and defense, IoT, consumer electronics, the automation industry, medical imaging, and more.
  • Anti-masking technology and dusty atmosphere-resistant sensors enhance their functionality in challenging environments. Sensors are used in security and surveillance systems, including video surveillance and CCTV cameras, for intruder alarms, automatic ticket gates, entryway lighting, and security lighting. They are also utilized in automated sinks, toilet flushers, and passive sensors for temperature sensing and motion detection. Sensors are increasingly being integrated into connected cars, machines, wearables, and IoT-enabled vehicles for environmental monitoring and machinery safety. Thermal imaging technology, pyroelectric sensors, and near-infrared (NIR) imaging are advanced applications of sensors in industries like defense, industrial facilities, automotive manufacturers, and healthcare.

What are the market trends shaping the Infrared Sensors Industry?

The adoption of night vision technologies in smart doorbells is the upcoming market trend.

  • Infrared sensors, a critical component in various industries and applications, enable functionalities such as motion sensing, temperature measurement, and night vision capabilities. These sensors utilize IR LEDs and photodiodes to detect infrared radiation and convert it into electrical signals. The technology is extensively used in consumer electronics, including smartphones and smart cameras, as well as In the automotive industry for ADAS systems and autonomous vehicles. They also play a significant role in military and defense applications, IoT devices, industrial processes, healthcare, and environmental monitoring. Anti-masking technology is employed to mitigate interference from dusty atmospheres, ensuring accurate readings.
  • Pyroelectric infrared sensors are commonly used in video surveillance, CCTV cameras, and LIDAR technology for near-infrared (NIR) imaging and thermal cameras. Infrared temperature sensors, motion sensors, and proximity sensors are integral to security systems, including intruder alarms, automatic ticket gates, entryway lighting, and security lighting. Infrared sensors are also employed in automated sinks, toilet flushers, and wearable devices. The automation industry, including manufacturing and machinery safety, utilizes for quality control, material handling, and process monitoring. Infrared sensors are also used in connected cars, thermography, and industrial facilities for defense and security purposes. The advancement of micro-electromechanical systems technology has led to the development of smaller, more efficient ones, enabling their integration into various applications.

What challenges does the Infrared Sensors Industry face during its growth?

The impact of environmental conditions on infrared sensors is a key challenge affecting the industry growth.

  • Infrared sensors, a critical component in various industries, can be affected by environmental conditions such as rain, fog, dust, and sunlight. These atmospheric effects can interfere with the infrared radiation transmitted from the target, leading to inaccurate detection and faulty measurement. For instance, In the automotive industry, infrared sensors used in Autonomous vehicles and Advanced Driver Assistance Systems (ADAS) can be impacted by rain, fog, or dust, causing potential safety issues. In the military and defense sector, they are used for surveillance and night vision capabilities can be affected by harsh sunlight or fog, leading to incorrect data processing. Moreover, In the consumer electronics industry, sensors used in smartphones, smart cameras, and wearables can be impacted by dust or sunlight, resulting in incorrect functionality.
  • In the industrial automation sector, sensors used in IoT devices, smart home devices, industrial processes, and machinery safety can be affected by environmental conditions, leading to production delays and inefficiencies. Environmental monitoring applications, such as temperature sensing and motion detection, can also be impacted by atmospheric interference. Infrared sensors used in medical applications, such as thermography and biomedical engineering, can be affected by dust or moisture, leading to inaccurate readings. To mitigate these issues, infrared sensors use various technologies, such as anti-masking technology, which helps prevent the sensor from being affected by external sources of infrared radiation.

Exclusive Customer Landscape

The infrared sensors market forecasting report includes the adoption lifecycle of the market, covering from the innovator's stage to the laggard's stage. It focuses on adoption rates in different regions based on penetration. Furthermore, the infrared sensors market report also includes key purchase criteria and drivers of price sensitivity to help companies evaluate and develop their market growth analysis strategies.

Infrared Sensors Market Share by Geography

 Customer Landscape

Key Companies & Market Insights

Companies are implementing various strategies, such as strategic alliances, infrared sensors market forecast, partnerships, mergers and acquisitions, geographical expansion, and product/service launches, to enhance their presence In the industry.

The industry research and growth report includes detailed analyses of the competitive landscape of the market and information about key companies, including:

  • ams OSRAM AG
  • Elmos Semiconductor AG
  • Excelitas Technologies Corp.
  • FUJI and Co.
  • Hamamatsu Photonics KK
  • Honeywell International Inc.
  • InfraTec GmbH
  • L3Harris Technologies Inc.
  • Leonardo Spa
  • Melexis NV
  • Murata Manufacturing Co. Ltd.
  • Nippon Avionics Co. Ltd.
  • Nippon Ceramic Co. Ltd.
  • OMRON Corp.
  • Parallax Inc.
  • RTX Corp.
  • Teledyne Technologies Inc.
  • Texas Instruments Inc.
  • Thales Group
  • Zhengzhou Winsen Electronics Technology Co. Ltd.

Qualitative and quantitative analysis of companies has been conducted to help clients understand the wider business environment as well as the strengths and weaknesses of key industry players. Data is qualitatively analyzed to categorize companies as pure play, category-focused, industry-focused, and diversified; it is quantitatively analyzed to categorize companies as dominant, leading, strong, tentative, and weak.

Research Analyst Overview

Infrared sensors, a vital component in various industries and applications, have gained significant traction due to their ability to detect and measure infrared radiation. These sensors play a pivotal role in numerous sectors, including automotive, industrial, consumer electronics, and security. Sensors employ different technologies such as photodiodes, IR LEDs, and pyroelectric elements to detect and measure infrared radiation. The sensors' functionality varies based on their design and application. For instance, passive sensors (PIR) are used for motion detection, while IR temperature sensors measure temperature, and proximity sensors determine the presence of objects. The automotive industry utilizes sensors in advanced driver-assistance systems (ADAS) to enhance vehicle safety.

Moreover, these sensors enable features like automatic emergency braking, lane departure warnings, and pedestrian detection. sensors are also crucial for night vision capabilities in autonomous vehicles, enabling them to detect objects and obstacles in low-light conditions. The industrial sector benefits from sensors in various applications, such as material handling, quality control, machinery safety, and environmental monitoring. These sensors help optimize industrial processes, improve product quality, and ensure worker safety. In the consumer electronics realm, sensors are used in smartphones for remote control functions and infrared proximity sensors for automatic turn-on/off features. sensors are also employed in smart home devices, such as automated sinks, toilet flushers, and entryway lighting, for added convenience and energy efficiency.

Furthermore, the security and surveillance sector heavily relies onsensors for video surveillance and CCTV cameras. These sensors enable night vision capabilities, ensuring continuous monitoring in low-light conditions. sensors are also used in intruder alarms and automatic ticket gates for access control. sensors are also essential In the medical field for various applications, such as biomedical engineering, thermography, and child presence detection. Infrared temperature sensors are used in medical imaging to diagnose and monitor conditions, while pyroelectric sensors are used for detecting body heat in child presence detection systems. The IoT and automation industries are witnessing a rise In the adoption of sensors due to their ability to provide real-time data and enhance system efficiency.

Infrared Sensors Market Scope

Report Coverage

Details

Page number

186

Base year

2023

Historic period

2018-2022

Forecast period

2024-2028

Growth momentum & CAGR

Accelerate at a CAGR of 9.45%

Market Growth 2024-2028

USD 284.3 million

Market structure

Fragmented

YoY growth 2023-2024(%)

8.41

Key countries

US, China, Japan, Germany, and South Korea

Competitive landscape

Leading Companies, Market Positioning of Companies, Competitive Strategies, and Industry Risks

Request Free Sample

What are the Key Data Covered in this Infrared Sensors Market Research and Growth Report?

  • CAGR of the Infrared Sensors industry during the forecast period
  • Detailed information on factors that will drive the Infrared Sensors market growth and forecasting between 2024 and 2028
  • Precise estimation of the size of the market and its contribution to the industry in focus on the parent market
  • Accurate predictions about upcoming growth and trends and changes in consumer behaviour
  • Growth of the market across APAC, North America, Europe, South America, and Middle East and Africa
  • Thorough analysis of the market's competitive landscape and detailed information about companies
  • Comprehensive analysis of factors that will challenge the infrared sensors market growth of industry companies

We can help! Our analysts can customize this infrared sensors market research report to meet your requirements.

Get in touch

1 Executive Summary

  • 1.1 Market overview
    • Executive Summary - Chart on Market Overview
    • Executive Summary - Data Table on Market Overview
    • Executive Summary - Chart on Global Market Characteristics
    • Executive Summary - Chart on Market by Geography
    • Executive Summary - Chart on Market Segmentation by Application
    • Executive Summary - Chart on Market Segmentation by Technology
    • Executive Summary - Chart on Incremental Growth
    • Executive Summary - Data Table on Incremental Growth
    • Executive Summary - Chart on Company Market Positioning

2 Market Landscape

  • 2.1 Market ecosystem
    • Parent Market
    • Data Table on - Parent Market
  • 2.2 Market characteristics
    • Market characteristics analysis
  • 2.3 Value chain analysis
    • Value Chain Analysis

3 Market Sizing

  • 3.1 Market definition
    • Offerings of companies included in the market definition
  • 3.2 Market segment analysis
    • Market segments
  • 3.3 Market size 2023
    • 3.4 Market outlook: Forecast for 2023-2028
      • Chart on Global - Market size and forecast 2023-2028 ($ million)
      • Data Table on Global - Market size and forecast 2023-2028 ($ million)
      • Chart on Global Market: Year-over-year growth 2023-2028 (%)
      • Data Table on Global Market: Year-over-year growth 2023-2028 (%)

    4 Historic Market Size

    • 4.1 Global Infrared Sensors Market 2018 - 2022
      • Historic Market Size - Data Table on Global Infrared Sensors Market 2018 - 2022 ($ million)
    • 4.2 Application segment analysis 2018 - 2022
      • Historic Market Size - Application Segment 2018 - 2022 ($ million)
    • 4.3 Technology segment analysis 2018 - 2022
      • Historic Market Size - Technology Segment 2018 - 2022 ($ million)
    • 4.4 Geography segment analysis 2018 - 2022
      • Historic Market Size - Geography Segment 2018 - 2022 ($ million)
    • 4.5 Country segment analysis 2018 - 2022
      • Historic Market Size - Country Segment 2018 - 2022 ($ million)

    5 Five Forces Analysis

    • 5.1 Five forces summary
      • Five forces analysis - Comparison between 2023 and 2028
    • 5.2 Bargaining power of buyers
      • Bargaining power of buyers - Impact of key factors 2023 and 2028
    • 5.3 Bargaining power of suppliers
      • Bargaining power of suppliers - Impact of key factors in 2023 and 2028
    • 5.4 Threat of new entrants
      • Threat of new entrants - Impact of key factors in 2023 and 2028
    • 5.5 Threat of substitutes
      • Threat of substitutes - Impact of key factors in 2023 and 2028
    • 5.6 Threat of rivalry
      • Threat of rivalry - Impact of key factors in 2023 and 2028
    • 5.7 Market condition
      • Chart on Market condition - Five forces 2023 and 2028

    6 Market Segmentation by Application

    • 6.1 Market segments
      • Chart on Application - Market share 2023-2028 (%)
      • Data Table on Application - Market share 2023-2028 (%)
    • 6.2 Comparison by Application
      • Chart on Comparison by Application
      • Data Table on Comparison by Application
    • 6.3 Commercial - Market size and forecast 2023-2028
      • Chart on Commercial - Market size and forecast 2023-2028 ($ million)
      • Data Table on Commercial - Market size and forecast 2023-2028 ($ million)
      • Chart on Commercial - Year-over-year growth 2023-2028 (%)
      • Data Table on Commercial - Year-over-year growth 2023-2028 (%)
    • 6.4 Healthcare - Market size and forecast 2023-2028
      • Chart on Healthcare - Market size and forecast 2023-2028 ($ million)
      • Data Table on Healthcare - Market size and forecast 2023-2028 ($ million)
      • Chart on Healthcare - Year-over-year growth 2023-2028 (%)
      • Data Table on Healthcare - Year-over-year growth 2023-2028 (%)
    • 6.5 Automotive - Market size and forecast 2023-2028
      • Chart on Automotive - Market size and forecast 2023-2028 ($ million)
      • Data Table on Automotive - Market size and forecast 2023-2028 ($ million)
      • Chart on Automotive - Year-over-year growth 2023-2028 (%)
      • Data Table on Automotive - Year-over-year growth 2023-2028 (%)
    • 6.6 Others - Market size and forecast 2023-2028
      • Chart on Others - Market size and forecast 2023-2028 ($ million)
      • Data Table on Others - Market size and forecast 2023-2028 ($ million)
      • Chart on Others - Year-over-year growth 2023-2028 (%)
      • Data Table on Others - Year-over-year growth 2023-2028 (%)
    • 6.7 Market opportunity by Application
      • Market opportunity by Application ($ million)
      • Data Table on Market opportunity by Application ($ million)

    7 Market Segmentation by Technology

    • 7.1 Market segments
      • Chart on Technology - Market share 2023-2028 (%)
      • Data Table on Technology - Market share 2023-2028 (%)
    • 7.2 Comparison by Technology
      • Chart on Comparison by Technology
      • Data Table on Comparison by Technology
    • 7.3 Pyroelectric - Market size and forecast 2023-2028
      • Chart on Pyroelectric - Market size and forecast 2023-2028 ($ million)
      • Data Table on Pyroelectric - Market size and forecast 2023-2028 ($ million)
      • Chart on Pyroelectric - Year-over-year growth 2023-2028 (%)
      • Data Table on Pyroelectric - Year-over-year growth 2023-2028 (%)
    • 7.4 Thermopile - Market size and forecast 2023-2028
      • Chart on Thermopile - Market size and forecast 2023-2028 ($ million)
      • Data Table on Thermopile - Market size and forecast 2023-2028 ($ million)
      • Chart on Thermopile - Year-over-year growth 2023-2028 (%)
      • Data Table on Thermopile - Year-over-year growth 2023-2028 (%)
    • 7.5 Microbolometers - Market size and forecast 2023-2028
      • Chart on Microbolometers - Market size and forecast 2023-2028 ($ million)
      • Data Table on Microbolometers - Market size and forecast 2023-2028 ($ million)
      • Chart on Microbolometers - Year-over-year growth 2023-2028 (%)
      • Data Table on Microbolometers - Year-over-year growth 2023-2028 (%)
    • 7.6 InGaAs - Market size and forecast 2023-2028
      • Chart on InGaAs - Market size and forecast 2023-2028 ($ million)
      • Data Table on InGaAs - Market size and forecast 2023-2028 ($ million)
      • Chart on InGaAs - Year-over-year growth 2023-2028 (%)
      • Data Table on InGaAs - Year-over-year growth 2023-2028 (%)
    • 7.7 MCT - Market size and forecast 2023-2028
      • Chart on MCT - Market size and forecast 2023-2028 ($ million)
      • Data Table on MCT - Market size and forecast 2023-2028 ($ million)
      • Chart on MCT - Year-over-year growth 2023-2028 (%)
      • Data Table on MCT - Year-over-year growth 2023-2028 (%)
    • 7.8 Market opportunity by Technology
      • Market opportunity by Technology ($ million)
      • Data Table on Market opportunity by Technology ($ million)

    8 Customer Landscape

    • 8.1 Customer landscape overview
      • Analysis of price sensitivity, lifecycle, customer purchase basket, adoption rates, and purchase criteria

    9 Geographic Landscape

    • 9.1 Geographic segmentation
      • Chart on Market share by geography 2023-2028 (%)
      • Data Table on Market share by geography 2023-2028 (%)
    • 9.2 Geographic comparison
      • Chart on Geographic comparison
      • Data Table on Geographic comparison
    • 9.3 APAC - Market size and forecast 2023-2028
      • Chart on APAC - Market size and forecast 2023-2028 ($ million)
      • Data Table on APAC - Market size and forecast 2023-2028 ($ million)
      • Chart on APAC - Year-over-year growth 2023-2028 (%)
      • Data Table on APAC - Year-over-year growth 2023-2028 (%)
    • 9.4 North America - Market size and forecast 2023-2028
      • Chart on North America - Market size and forecast 2023-2028 ($ million)
      • Data Table on North America - Market size and forecast 2023-2028 ($ million)
      • Chart on North America - Year-over-year growth 2023-2028 (%)
      • Data Table on North America - Year-over-year growth 2023-2028 (%)
    • 9.5 Europe - Market size and forecast 2023-2028
      • Chart on Europe - Market size and forecast 2023-2028 ($ million)
      • Data Table on Europe - Market size and forecast 2023-2028 ($ million)
      • Chart on Europe - Year-over-year growth 2023-2028 (%)
      • Data Table on Europe - Year-over-year growth 2023-2028 (%)
    • 9.6 South America - Market size and forecast 2023-2028
      • Chart on South America - Market size and forecast 2023-2028 ($ million)
      • Data Table on South America - Market size and forecast 2023-2028 ($ million)
      • Chart on South America - Year-over-year growth 2023-2028 (%)
      • Data Table on South America - Year-over-year growth 2023-2028 (%)
    • 9.7 Middle East and Africa - Market size and forecast 2023-2028
      • Chart on Middle East and Africa - Market size and forecast 2023-2028 ($ million)
      • Data Table on Middle East and Africa - Market size and forecast 2023-2028 ($ million)
      • Chart on Middle East and Africa - Year-over-year growth 2023-2028 (%)
      • Data Table on Middle East and Africa - Year-over-year growth 2023-2028 (%)
    • 9.8 US - Market size and forecast 2023-2028
      • Chart on US - Market size and forecast 2023-2028 ($ million)
      • Data Table on US - Market size and forecast 2023-2028 ($ million)
      • Chart on US - Year-over-year growth 2023-2028 (%)
      • Data Table on US - Year-over-year growth 2023-2028 (%)
    • 9.9 China - Market size and forecast 2023-2028
      • Chart on China - Market size and forecast 2023-2028 ($ million)
      • Data Table on China - Market size and forecast 2023-2028 ($ million)
      • Chart on China - Year-over-year growth 2023-2028 (%)
      • Data Table on China - Year-over-year growth 2023-2028 (%)
    • 9.10 Japan - Market size and forecast 2023-2028
      • Chart on Japan - Market size and forecast 2023-2028 ($ million)
      • Data Table on Japan - Market size and forecast 2023-2028 ($ million)
      • Chart on Japan - Year-over-year growth 2023-2028 (%)
      • Data Table on Japan - Year-over-year growth 2023-2028 (%)
    • 9.11 Germany - Market size and forecast 2023-2028
      • Chart on Germany - Market size and forecast 2023-2028 ($ million)
      • Data Table on Germany - Market size and forecast 2023-2028 ($ million)
      • Chart on Germany - Year-over-year growth 2023-2028 (%)
      • Data Table on Germany - Year-over-year growth 2023-2028 (%)
    • 9.12 South Korea - Market size and forecast 2023-2028
      • Chart on South Korea - Market size and forecast 2023-2028 ($ million)
      • Data Table on South Korea - Market size and forecast 2023-2028 ($ million)
      • Chart on South Korea - Year-over-year growth 2023-2028 (%)
      • Data Table on South Korea - Year-over-year growth 2023-2028 (%)
    • 9.13 Market opportunity by geography
      • Market opportunity by geography ($ million)
      • Data Tables on Market opportunity by geography ($ million)

    10 Drivers, Challenges, and Opportunity/Restraints

    • 10.1 Market drivers
      • 10.2 Market challenges
        • 10.3 Impact of drivers and challenges
          • Impact of drivers and challenges in 2023 and 2028
        • 10.4 Market opportunities/restraints

          11 Competitive Landscape

          • 11.1 Overview
            • 11.2 Competitive Landscape
              • Overview on criticality of inputs and factors of differentiation
            • 11.3 Landscape disruption
              • Overview on factors of disruption
            • 11.4 Industry risks
              • Impact of key risks on business

            12 Competitive Analysis

            • 12.1 Companies profiled
              • Companies covered
            • 12.2 Market positioning of companies
              • Matrix on companies position and classification
            • 12.3 ams OSRAM AG
              • ams OSRAM AG - Overview
              • ams OSRAM AG - Business segments
              • ams OSRAM AG - Key news
              • ams OSRAM AG - Key offerings
              • ams OSRAM AG - Segment focus
            • 12.4 Elmos Semiconductor AG
              • Elmos Semiconductor AG - Overview
              • Elmos Semiconductor AG - Key offerings
            • 12.5 Excelitas Technologies Corp.
              • Excelitas Technologies Corp. - Overview
              • Excelitas Technologies Corp. - Product / Service
              • Excelitas Technologies Corp. - Key offerings
            • 12.6 FUJI and Co.
              • FUJI and Co. - Overview
              • FUJI and Co. - Product / Service
              • FUJI and Co. - Key offerings
            • 12.7 Hamamatsu Photonics KK
              • Hamamatsu Photonics KK - Overview
              • Hamamatsu Photonics KK - Business segments
              • Hamamatsu Photonics KK - Key news
              • Hamamatsu Photonics KK - Key offerings
              • Hamamatsu Photonics KK - Segment focus
            • 12.8 Honeywell International Inc.
              • Honeywell International Inc. - Overview
              • Honeywell International Inc. - Business segments
              • Honeywell International Inc. - Key news
              • Honeywell International Inc. - Key offerings
              • Honeywell International Inc. - Segment focus
            • 12.9 InfraTec GmbH
              • InfraTec GmbH - Overview
              • InfraTec GmbH - Product / Service
              • InfraTec GmbH - Key offerings
            • 12.10 Leonardo Spa
              • Leonardo Spa - Overview
              • Leonardo Spa - Business segments
              • Leonardo Spa - Key news
              • Leonardo Spa - Key offerings
              • Leonardo Spa - Segment focus
            • 12.11 Murata Manufacturing Co. Ltd.
              • Murata Manufacturing Co. Ltd. - Overview
              • Murata Manufacturing Co. Ltd. - Business segments
              • Murata Manufacturing Co. Ltd. - Key news
              • Murata Manufacturing Co. Ltd. - Key offerings
              • Murata Manufacturing Co. Ltd. - Segment focus
            • 12.12 OMRON Corp.
              • OMRON Corp. - Overview
              • OMRON Corp. - Business segments
              • OMRON Corp. - Key news
              • OMRON Corp. - Key offerings
              • OMRON Corp. - Segment focus
            • 12.13 Parallax Inc.
              • Parallax Inc. - Overview
              • Parallax Inc. - Product / Service
              • Parallax Inc. - Key offerings
            • 12.14 RTX Corp.
              • RTX Corp. - Overview
              • RTX Corp. - Business segments
              • RTX Corp. - Key news
              • RTX Corp. - Key offerings
              • RTX Corp. - Segment focus
            • 12.15 Teledyne Technologies Inc.
              • Teledyne Technologies Inc. - Overview
              • Teledyne Technologies Inc. - Business segments
              • Teledyne Technologies Inc. - Key news
              • Teledyne Technologies Inc. - Key offerings
              • Teledyne Technologies Inc. - Segment focus
            • 12.16 Texas Instruments Inc.
              • Texas Instruments Inc. - Overview
              • Texas Instruments Inc. - Business segments
              • Texas Instruments Inc. - Key news
              • Texas Instruments Inc. - Key offerings
              • Texas Instruments Inc. - Segment focus
            • 12.17 Thales Group
              • Thales Group - Overview
              • Thales Group - Business segments
              • Thales Group - Key news
              • Thales Group - Key offerings
              • Thales Group - Segment focus

            13 Appendix

            • 13.1 Scope of the report
              • 13.2 Inclusions and exclusions checklist
                • Inclusions checklist
                • Exclusions checklist
              • 13.3 Currency conversion rates for US$
                • Currency conversion rates for US$
              • 13.4 Research methodology
                • Research methodology
              • 13.5 Data procurement
                • Information sources
              • 13.6 Data validation
                • Data validation
              • 13.7 Validation techniques employed for market sizing
                • Validation techniques employed for market sizing
              • 13.8 Data synthesis
                • Data synthesis
              • 13.9 360 degree market analysis
                • 360 degree market analysis
              • 13.10 List of abbreviations
                • List of abbreviations

              Research Methodology

              Technavio presents a detailed picture of the market by way of study, synthesis, and summation of data from multiple sources. The analysts have presented the various facets of the market with a particular focus on identifying the key industry influencers. The data thus presented is comprehensive, reliable, and the result of extensive research, both primary and secondary.

              INFORMATION SOURCES

              Primary sources

              • Manufacturers and suppliers
              • Channel partners
              • Industry experts
              • Strategic decision makers

              Secondary sources

              • Industry journals and periodicals
              • Government data
              • Financial reports of key industry players
              • Historical data
              • Press releases

              DATA ANALYSIS

              Data Synthesis

              • Collation of data
              • Estimation of key figures
              • Analysis of derived insights

              Data Validation

              • Triangulation with data models
              • Reference against proprietary databases
              • Corroboration with industry experts

              REPORT WRITING

              Qualitative

              • Market drivers
              • Market challenges
              • Market trends
              • Five forces analysis

              Quantitative

              • Market size and forecast
              • Market segmentation
              • Geographical insights
              • Competitive landscape

              Interested in this report?

              Get your sample now to see our research methodology and insights!

              Download Now

              Frequently Asked Questions

              Infrared Sensors market growth will increase by $ 284.3 mn during 2024-2028.

              The Infrared Sensors market is expected to grow at a CAGR of 9.45% during 2024-2028.

              Infrared Sensors market is segmented by Application( Commercial, Healthcare, Automotive, Others, MCT) Technology( Pyroelectric, Thermopile, Microbolometers, InGaAs, MCT)

              ams OSRAM AG, Elmos Semiconductor AG, Excelitas Technologies Corp., FUJI and Co., Hamamatsu Photonics KK, Honeywell International Inc., InfraTec GmbH, L3Harris Technologies Inc., Leonardo Spa, Melexis NV, Murata Manufacturing Co. Ltd., Nippon Avionics Co. Ltd., Nippon Ceramic Co. Ltd., OMRON Corp., Parallax Inc., RTX Corp., Teledyne Technologies Inc., Texas Instruments Inc., Thales Group, Zhengzhou Winsen Electronics Technology Co. Ltd. are a few of the key vendors in the Infrared Sensors market.

              APAC will register the highest growth rate of 45% among the other regions. Therefore, the Infrared Sensors market in APAC is expected to garner significant business opportunities for the vendors during the forecast period.

              US, China, Japan, Germany, South Korea

              • Increasing number of burglariesThe number of burglaries is increasing in several countries. Some countries with high burglary rates (per 100 is the driving factor this market.
              • 000 population) include the Netherlands is the driving factor this market.
              • Denmark is the driving factor this market.
              • Sweden is the driving factor this market.
              • Belgium is the driving factor this market.
              • Brazil is the driving factor this market.
              • Costa Rica is the driving factor this market.
              • and Australia. In addition is the driving factor this market.
              • some countries with high burglary incidents include the US is the driving factor this market.
              • Germany is the driving factor this market.
              • France is the driving factor this market.
              • Russia is the driving factor this market.
              • and Switzerland. Also is the driving factor this market.
              • the average time for burglary can be less than 10 minutes. The rising need to reduce instances of theft and burglaries has resulted in increased demand for smart homes. As there is a live video feed is the driving factor this market.
              • homeowners can be aware of an intruder and take the necessary action as required. A burglar alarm circuit is embedded with the photodiode is the driving factor this market.
              • which emits and detects the incidence and thereby helps in detecting the intrusion. The infrared sensors are fitted on one side of the door frame and photodiode on the other side. The infrared radiation emitted by the infrared sensors falls on the photodiode directly is the driving factor this market.
              • and when an object or person obstructs the infrared path is the driving factor this market.
              • the alarm rings. This mechanism is used extensively in security systems in smart homes. Also is the driving factor this market.
              • as smart homes fall under the purview of the Internet of Things (IoT) connected devices is the driving factor this market.
              • in case of a burglary is the driving factor this market.
              • the smart home will be able to send an emergency message to the nearest police department is the driving factor this market.
              • thereby alerting policemen of a robbery. Hence is the driving factor this market.
              • to prevent and reduce the rate of theft and burglaries across the globe is the driving factor this market.
              • primarily in regions such as America and EMEA is the driving factor this market.
              • the demand for smart homes is increasing is the driving factor this market.
              • which is the driving factor this market.
              • in turn is the driving factor this market.
              • will drive the market during the forecast period. is the driving factor this market.

              The Infrared Sensors market vendors should focus on grabbing business opportunities from the Commercial segment as it accounted for the largest market share in the base year.
              RIA - Research AI Assistant
              Ask RIA