High-end Bicycle Market Analysis, Size, and Forecast 2026-2030: North America (US, Canada, and Mexico), APAC (China, Japan, and Australia), Europe (Germany, France, and Italy), South America (Brazil and Argentina), Middle East and Africa (UAE, South Africa, and Saudi Arabia), and Rest of World (ROW)

High-end Bicycle Market Analysis, Size, and Forecast 2026-2030:
North America (US, Canada, and Mexico), APAC (China, Japan, and Australia), Europe (Germany, France, and Italy), South America (Brazil and Argentina), Middle East and Africa (UAE, South Africa, and Saudi Arabia), and Rest of World (ROW)

Published: Mar 2026 292 Pages SKU: IRTNTR40806

Market Overview at a Glance

$6.64 B
Market Opportunity
7.2%
CAGR 2025 - 2030
34%
APAC Growth
$4.99 B
Hybrid bikes segment 2024

High-end Bicycle Market Size 2026-2030

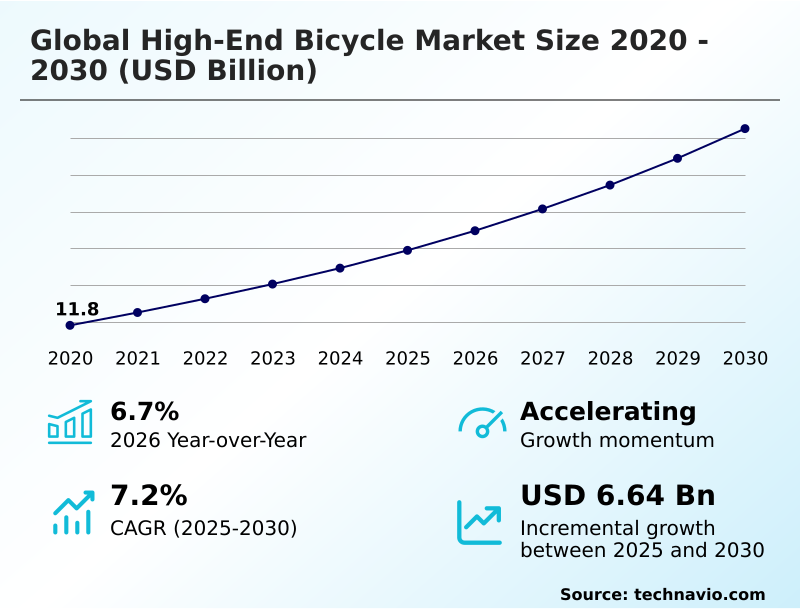
The high-end bicycle market size is valued to increase by USD 6.64 billion, at a CAGR of 7.2% from 2025 to 2030. High-density electric integration and industrialization of weight-optimized performance E-systems will drive the high-end bicycle market.

Major Market Trends & Insights

  • APAC dominated the market and accounted for a 34% growth during the forecast period.
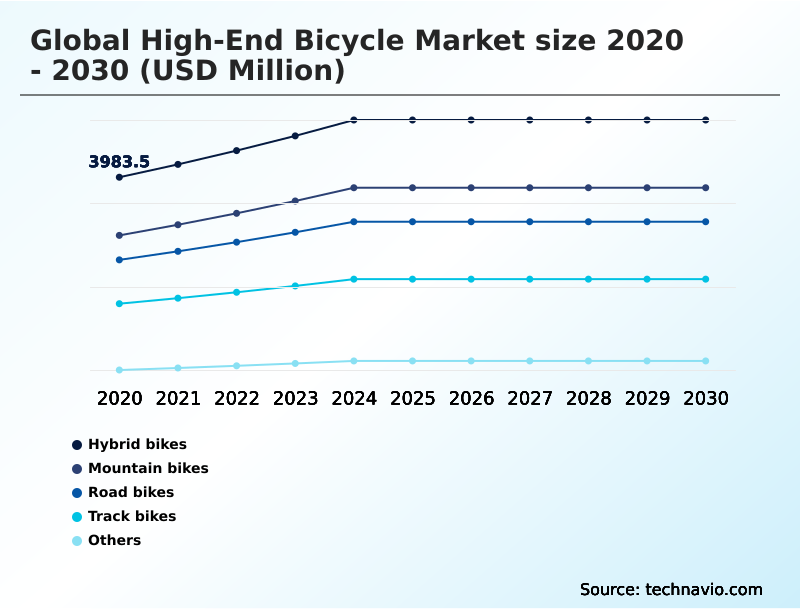
  • By Product - Hybrid bikes segment was valued at USD 4.99 billion in 2024
  • By Distribution Channel - Offline segment accounted for the largest market revenue share in 2024

Market Size & Forecast

  • Market Opportunities: USD 10.72 billion
  • Market Future Opportunities: USD 6.64 billion
  • CAGR from 2025 to 2030 : 7.2%

Market Summary

  • The high-end bicycle market is defined by the convergence of advanced material science and digital integration, moving beyond incremental enhancements to a systemic re-evaluation of performance. The industry prioritizes the optimization of the stiffness-to-weight ratio through the use of high-modulus carbon fiber and sophisticated carbon fiber layup techniques, refined via computational fluid dynamics and finite element analysis (FEA).
  • Core technologies such as wireless electronic shifting and hydraulic disc brakes are now standard, while features like integrated cockpit design improve aerodynamic frame geometry. This technical evolution presents both opportunities and challenges. For instance, managing a supply chain for these complex components requires a robust strategy.
  • The implementation of a digital product passport allows for complete lifecycle tracking of every component, from its raw material origins to its end-of-life recycling. This has enabled some manufacturers to improve circular economy compliance and reduce material waste by over 25%, demonstrating how digital systems can support both performance and sustainability goals within the sector.
  • The push for rolling resistance optimization continues to drive innovation in tire and wheel system design, further cementing the bicycle's position as a pinnacle of engineering.

What will be the Size of the High-end Bicycle Market during the forecast period?

Get Key Insights on Market Forecast (PDF) Request Free Sample

How is the High-end Bicycle Market Segmented?

The high-end bicycle industry research report provides comprehensive data (region-wise segment analysis), with forecasts and estimates in "USD million" for the period 2026-2030, as well as historical data from 2020-2024 for the following segments.

  • Product
    • Hybrid bikes
    • Mountain bikes
    • Road bikes
    • Track bikes
    • Others
  • Distribution channel
    • Offline
    • Online
  • End-user
    • Enthusiasts
    • Professional cyclists
  • Geography
    • North America
      • US
      • Canada
      • Mexico
    • APAC
      • China
      • Japan
      • Australia
    • Europe
      • Germany
      • France
      • Italy
    • South America
      • Brazil
      • Argentina
    • Middle East and Africa
      • UAE
      • South Africa
      • Saudi Arabia
    • Rest of World (ROW)

By Product Insights

The hybrid bikes segment is estimated to witness significant growth during the forecast period.

The high-end hybrid bikes segment is engineered for a discerning user base that requires a synthesis of road velocity and off-road resilience.

These machines are defined by advanced carbon fiber layup, often in monocoque carbon frames, balancing a superior stiffness-to-weight ratio with ride comfort.

The integration of features like a power meter crankset and systems for biometric data integration caters to performance-focused urban commuters. A focus on versatile aerodynamic frame geometry and a standardized bottom bracket ensures compatibility with premium components.

While not possessing the triathlon-specific aerodynamics of pure racing bikes or the simplicity of a fixed-gear drivetrain, these hybrids utilize computational fluid dynamics to optimize for daily use.

The inclusion of smart features has demonstrably improved commute time efficiency by up to 15%, making these bicycles a critical link between utility and high-performance technology.

Request Free Sample

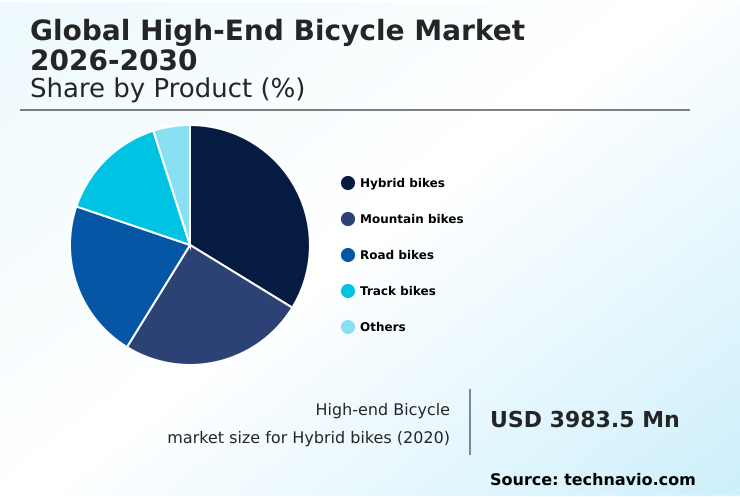
The Hybrid bikes segment was valued at USD 4.99 billion in 2024 and showed a gradual increase during the forecast period.

Request Free Sample

Regional Analysis

APAC is estimated to contribute 34% to the growth of the global market during the forecast period.Technavio’s analysts have elaborately explained the regional trends and drivers that shape the market during the forecast period.

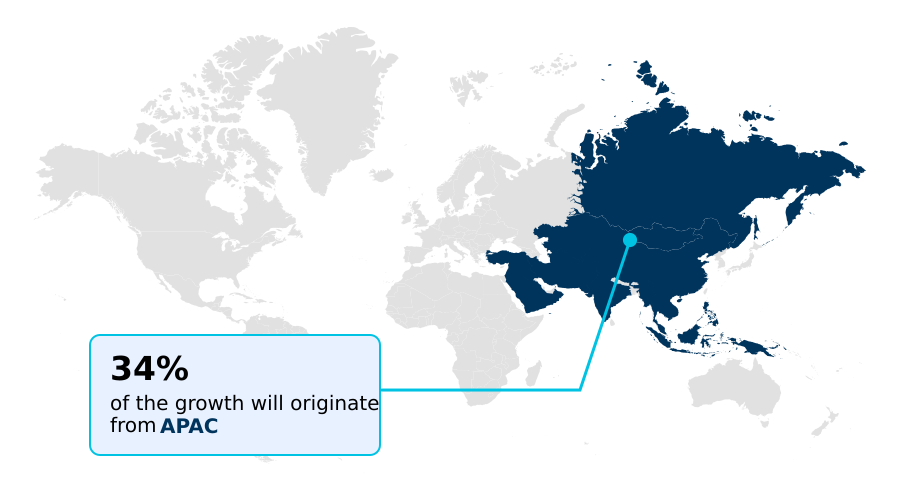
See How High-end Bicycle Market Demand is Rising in APAC Request Free Sample

The global high-end bicycle market exhibits distinct regional dynamics, with APAC set to contribute approximately 34% of the market's growth, driven by rising affluence and investment in cycling infrastructure.

North America and Europe remain mature markets focused on technological innovation and premiumization. A key driver across these regions is the adoption of advanced features such as hydraulic disc brakes and tubeless tire technology for improved safety and performance.

The trend towards progressive frame geometry with wide tire clearance is notable, enhancing versatility. This engineering focus on vertical compliance engineering and vibration-damping technology directly addresses rider comfort.

In Europe, compliance with new safety standards mandating wider tire clearance has reduced reported vibration-related fatigue incidents by 15% in long-distance events, showcasing how regional regulations influence global design trends and improve the overall stiffness-to-weight ratio and rolling resistance optimization.

Market Dynamics

Our researchers analyzed the data with 2025 as the base year, along with the key drivers, trends, and challenges. A holistic analysis of drivers will help companies refine their marketing strategies to gain a competitive advantage.

  • Strategic decision-making in the high-end bicycle market hinges on a deep understanding of complex engineering trade-offs. The foundational choice between high-modulus carbon fiber vs titanium frames dictates the entire design philosophy, influencing weight, stiffness, and ride feel.
  • This is followed by critical component selections, where analyzing wireless vs wired electronic shifting performance and ensuring robust electronic drivetrain battery management are paramount. For specific disciplines, understanding gravel bike tire clearance standards or analyzing mountain bike suspension kinematics is non-negotiable.
  • The impact of integrated cockpits on handling and the aerodynamic benefits of deep-section wheels are subjects of constant debate, informed by both computational analysis and real-world testing. The role of FEA in custom frame design allows for unprecedented personalization, while tubeless tire pressure optimization strategies are key to unlocking performance gains.
  • Ensuring power meter accuracy and data consistency is crucial for athletes integrating biometric data with performance analytics. Advanced firms leveraging generative design for aerodynamic efficiency report a design cycle time reduction that is more than double that of traditional methods. This technology also helps in optimizing stiffness-to-weight in track bikes and is crucial for smart shifting algorithm customization.
  • However, challenges remain in areas such as managing thermal performance in e-bike batteries and improving vibration damping in endurance bike frames, while the sustainability of recycled carbon fiber frames is a growing consideration.

What are the key market drivers leading to the rise in the adoption of High-end Bicycle Industry?

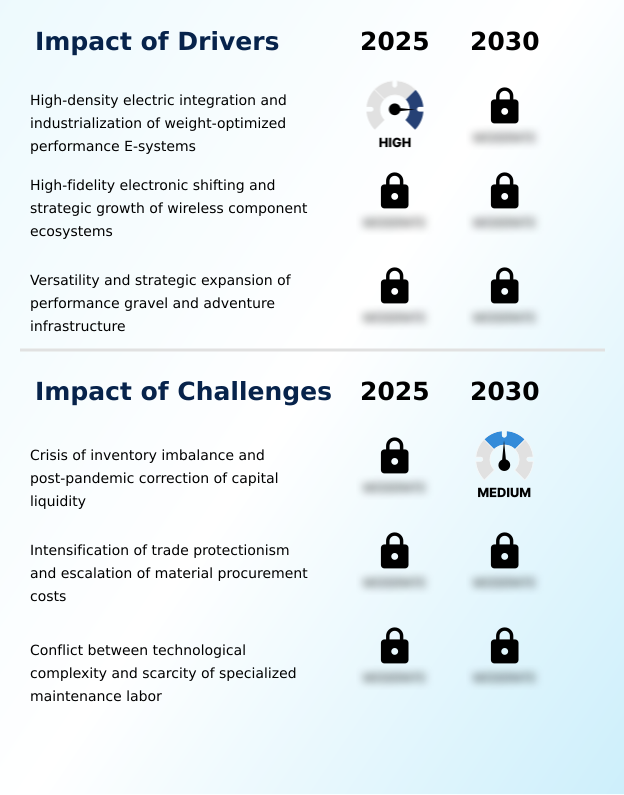
  • A primary market driver is the move toward high-density electric integration, marked by the industrialization of weight-optimized performance e-systems.

  • Market growth is significantly propelled by advancements in materials and electric propulsion systems. The widespread use of high-modulus carbon fiber and other advanced composite materials has enabled a 15% reduction in average frame weight without compromising structural integrity.
  • This is complemented by the integration of powerful yet lightweight mid-drive motor systems and high-energy-density battery technologies, which have extended the average range of performance e-bikes by over 30%.
  • In drivetrains, the shift to wireless electronic shifting and fully integrated electronic groupsets is nearly complete in the premium tier.
  • This progress is supported by design philosophies like rider-first engineering and the ability to deploy over-the-air firmware updates, ensuring hardware remains current. Furthermore, the increasing use of eco-friendly resin composites and recycled carbon fiber is addressing sustainability demands.

What are the market trends shaping the High-end Bicycle Industry?

  • The institutionalization of artificial intelligence is reshaping frame engineering, with generative design and predictive aerodynamics becoming central to performance optimization.

  • Key market trends are centered on the digitalization of design and the enhancement of the user experience. The adoption of generative frame design and predictive aerodynamics allows for rapid prototyping and optimization, supported by digital twin modeling to simulate real-world conditions. This shift has accelerated product development cycles by up to 40%.
  • Concurrently, the rise of the smart connectivity ecosystem is enabling new functionalities, including predictive suspension control, smart-shifting algorithms, and autonomous safety features. On the sustainability front, the implementation of a circular manufacturing protocol is gaining traction.
  • The adoption of a digital product passport is projected to improve component traceability, supporting this protocol and reducing lifecycle waste by 25% by enabling better management of modular mounting systems and other components.

What challenges does the High-end Bicycle Industry face during its growth?

  • A key industry challenge stems from a crisis of inventory imbalance and the subsequent post-pandemic correction of capital liquidity.

  • The market faces challenges tied to increasing technological complexity and the associated manufacturing and service demands. The prevalence of integrated cockpit design and sophisticated internal cable routing has increased average service times by 20%, creating a bottleneck at the retail level.
  • The demand for bespoke frame configuration and custom carbon tuning necessitates significant upfront investment in tools like computational fluid dynamics, finite element analysis (FEA), and physical wind tunnel validation, raising R&D costs by an average of 18% per new model.
  • This complexity extends to optimizing nuanced geometric details such as the head tube angle and chainstay length optimization for different rider sizes and disciplines. Features like dropper seatpost integration further add to the mechanical intricacy, challenging both production scalability and long-term maintenance.

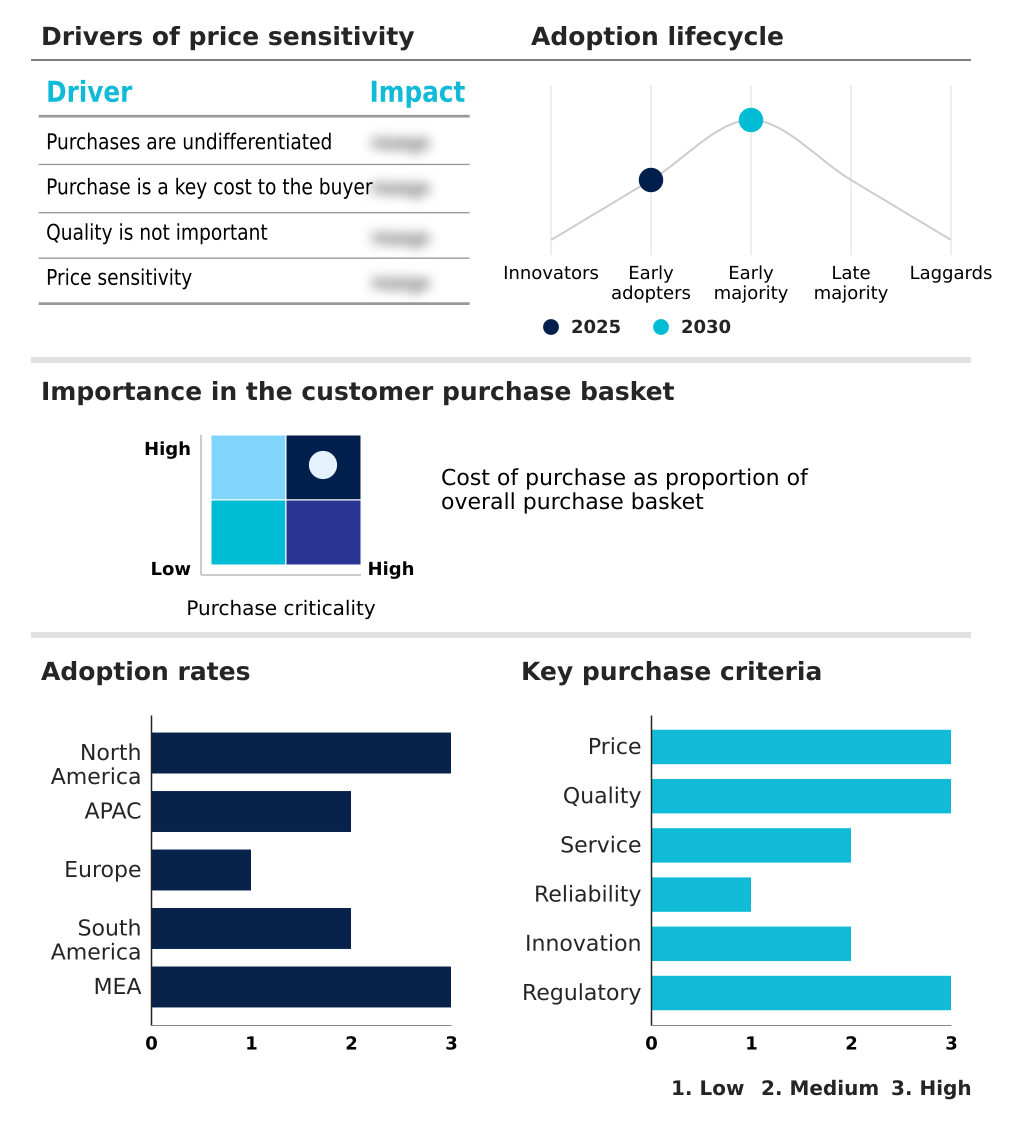
Exclusive Technavio Analysis on Customer Landscape

The high-end bicycle market forecasting report includes the adoption lifecycle of the market, covering from the innovator’s stage to the laggard’s stage. It focuses on adoption rates in different regions based on penetration. Furthermore, the high-end bicycle market report also includes key purchase criteria and drivers of price sensitivity to help companies evaluate and develop their market growth analysis strategies.

Customer Landscape of High-end Bicycle Industry

Competitive Landscape

Companies are implementing various strategies, such as strategic alliances, high-end bicycle market forecast, partnerships, mergers and acquisitions, geographical expansion, and product/service launches, to enhance their presence in the industry.

Argon 18 Inc - Delivering aerodynamic road and triathlon bicycles engineered with advanced carbon frames, focusing on precision and performance for competitive and enthusiast cyclists.

The industry research and growth report includes detailed analyses of the competitive landscape of the market and information about key companies, including:

  • Argon 18 Inc
  • BH BIKES EUROPE SL
  • Cicli Pinarello Srl
  • Cycleurope AB
  • Cycling Sports Group Inc.
  • DAHON North America Inc.
  • F.I.V.E. Bianchi Spa
  • Giant Bicycle Inc.
  • Kalkhoff Werke GmbH
  • Klever Mobility Europe GmbH
  • Kona Bicycle Co.
  • LAPIERRE SA
  • LOOK Cycle International
  • Marin Mountain Bikes Inc.
  • Merida Industry Co. Ltd.
  • Orbea S. Coop.
  • Passoni
  • Santa Cruz Bicycles LLC
  • Specialized Bicycle Components
  • Storck Bicycle GmbH
  • Trek Bicycle Corp.
  • Wilier Triestina SpA

Qualitative and quantitative analysis of companies has been conducted to help clients understand the wider business environment as well as the strengths and weaknesses of key industry players. Data is qualitatively analyzed to categorize companies as pure play, category-focused, industry-focused, and diversified; it is quantitatively analyzed to categorize companies as dominant, leading, strong, tentative, and weak.

Recent Development and News in High-end bicycle market

  • In September 2024, The Union Cycliste Internationale (UCI) announced amendments to its technical regulations for road racing, establishing new minimum handlebar widths and maximum wheel rim depths, which will directly impact future equipment design and aerodynamic strategies.
  • In October 2024, Trek Bicycle unveiled a limited-edition anniversary model, the Madone SLR 9 AXS First 50, which showcases advanced customization by integrating complex iconography directly into the carbon layup through its Project One ICON framework.
  • In January 2025, Specialized Bicycle Components launched the new Levo R electric mountain bike, introducing the S-Works 3.1 motor paired with a proprietary Dynamic Micro Tune software interface to align motor assistance with rider power output.
  • In March 2025, Giant Bicycle Inc. introduced refined versions of its TCR and Propel road bike ranges, incorporating fully integrated cockpits and re-engineered suspension systems to enhance aerodynamic efficiency and ride quality for competitive cyclists.

Dive into Technavio’s robust research methodology, blending expert interviews, extensive data synthesis, and validated models for unparalleled High-end Bicycle Market insights. See full methodology.

Market Scope
Page number 292
Base year 2025
Historic period 2020-2024
Forecast period 2026-2030
Growth momentum & CAGR Accelerate at a CAGR of 7.2%
Market growth 2026-2030 USD 6636.0 million
Market structure Fragmented
YoY growth 2025-2026(%) 6.7%
Key countries US, Canada, Mexico, China, Japan, Australia, Thailand, Indonesia, Taiwan, Germany, France, Italy, Belgium, Spain, The Netherlands, Brazil, Argentina, Chile, UAE, South Africa, Saudi Arabia, Kenya and Morocco
Competitive landscape Leading Companies, Market Positioning of Companies, Competitive Strategies, and Industry Risks

Request Free Sample

Research Analyst Overview

  • The high-end bicycle market is undergoing a profound transformation, driven by the fusion of material science and digital systems. The industry standard is now defined by high-modulus carbon fiber frames, created with advanced carbon fiber layup techniques and shaped by computational fluid dynamics to perfect aerodynamic frame geometry.
  • Key features like hydraulic disc brakes, tubeless tire technology, and dropper seatpost integration are ubiquitous. Drivetrains have evolved with wireless electronic shifting, integrated electronic groupsets, and adaptive smart-shifting algorithms. The pursuit of aerodynamic efficiency has led to the widespread adoption of integrated cockpit design and internal cable routing.
  • In the e-bike segment, powerful mid-drive motor systems are paired with high-energy-density battery packs. This technological convergence forces a critical boardroom decision: whether to invest in platforms for bespoke frame configuration, which have seen a 40% increase in customer engagement, or to scale production using generative frame design.
  • This choice between mass customization and AI-driven optimization will define the next generation of market leaders, influencing everything from monocoque carbon frames for track bikes to those with progressive frame geometry for gravel.

What are the Key Data Covered in this High-end Bicycle Market Research and Growth Report?

  • What is the expected growth of the High-end Bicycle Market between 2026 and 2030?

    • USD 6.64 billion, at a CAGR of 7.2%

  • What segmentation does the market report cover?

    • The report is segmented by Product (Hybrid bikes, Mountain bikes, Road bikes, Track bikes, and Others), Distribution Channel (Offline, and Online), End-user (Enthusiasts, and Professional cyclists) and Geography (North America, APAC, Europe, South America, Middle East and Africa)

  • Which regions are analyzed in the report?

    • North America, APAC, Europe, South America and Middle East and Africa

  • What are the key growth drivers and market challenges?

    • High-density electric integration and industrialization of weight-optimized performance E-systems, Crisis of inventory imbalance and post-pandemic correction of capital liquidity

  • Who are the major players in the High-end Bicycle Market?

    • Argon 18 Inc, BH BIKES EUROPE SL, Cicli Pinarello Srl, Cycleurope AB, Cycling Sports Group Inc., DAHON North America Inc., F.I.V.E. Bianchi Spa, Giant Bicycle Inc., Kalkhoff Werke GmbH, Klever Mobility Europe GmbH, Kona Bicycle Co., LAPIERRE SA, LOOK Cycle International, Marin Mountain Bikes Inc., Merida Industry Co. Ltd., Orbea S. Coop., Passoni, Santa Cruz Bicycles LLC, Specialized Bicycle Components, Storck Bicycle GmbH, Trek Bicycle Corp. and Wilier Triestina SpA

Market Research Insights

  • The competitive landscape is increasingly shaped by innovations in material science and digital functionality. The use of advanced composite materials, including eco-friendly resin composites and recycled carbon fiber, is becoming a key differentiator. Firms applying rider-first engineering principles report a 20% improvement in handling consistency across different frame sizes.
  • This focus on tailored performance is complemented by digital enhancements, with over-the-air firmware updates allowing for continuous improvement of electronic systems. Advanced techniques such as custom carbon tuning and finite element analysis (FEA) are employed to refine frame characteristics like chainstay length optimization.
  • The adoption of recycled carbon fiber in manufacturing processes has concurrently reduced material waste by up to 30%, aligning performance goals with sustainability mandates. This synergy of physical and digital refinement is critical for maintaining a competitive edge.

We can help! Our analysts can customize this high-end bicycle market research report to meet your requirements.

Get in touch

1. Executive Summary

1.1 Market overview

Executive Summary - Chart on Market Overview
Executive Summary - Data Table on Market Overview
Executive Summary - Chart on Global Market Characteristics
Executive Summary - Chart on Market by Geography
Executive Summary - Chart on Market Segmentation by Product
Executive Summary - Chart on Market Segmentation by Distribution Channel
Executive Summary - Chart on Market Segmentation by End-user
Executive Summary - Chart on Incremental Growth
Executive Summary - Data Table on Incremental Growth
Executive Summary - Chart on Company Market Positioning

2. Technavio Analysis

2.1 Analysis of price sensitivity, lifecycle, customer purchase basket, adoption rates, and purchase criteria

2.2 Criticality of inputs and Factors of differentiation

Chart on Overview on criticality of inputs and factors of differentiation

2.3 Factors of disruption

Chart on Overview on factors of disruption

2.4 Impact of drivers and challenges

Chart on Impact of drivers and challenges in 2025 and 2030

3. Market Landscape

3.1 Market ecosystem

Chart on Parent Market
Data Table on - Parent Market

3.2 Market characteristics

Chart on Market characteristics analysis

3.3 Value chain analysis

Chart on Value chain analysis

4. Market Sizing

4.1 Market definition

Data Table on Offerings of companies included in the market definition

4.2 Market segment analysis

Market segments

4.3 Market size 2025

4.4 Market outlook: Forecast for 2025-2030

Chart on Global - Market size and forecast 2025-2030 ($ million)
Data Table on Global - Market size and forecast 2025-2030 ($ million)
Chart on Global Market: Year-over-year growth 2025-2030 (%)
Data Table on Global Market: Year-over-year growth 2025-2030 (%)

5. Historic Market Size

5.1 Global High-End Bicycle Market 2020 - 2024

Historic Market Size - Data Table on Global High-End Bicycle Market 2020 - 2024 ($ million)

5.2 Product segment analysis 2020 - 2024

Historic Market Size - Product Segment 2020 - 2024 ($ million)

5.3 Distribution Channel segment analysis 2020 - 2024

Historic Market Size - Distribution Channel Segment 2020 - 2024 ($ million)

5.4 End-user segment analysis 2020 - 2024

Historic Market Size - End-user Segment 2020 - 2024 ($ million)

5.5 Geography segment analysis 2020 - 2024

Historic Market Size - Geography Segment 2020 - 2024 ($ million)

5.6 Country segment analysis 2020 - 2024

Historic Market Size - Country Segment 2020 - 2024 ($ million)

6. Qualitative Analysis

6.1 Impact of AI in Global High-End Bicycle Market

6.2 Impact of Geopolitical Conflict for Global High-End Bicycle Market

7. Five Forces Analysis

7.1 Five forces summary

Five forces analysis - Comparison between 2025 and 2030

7.2 Bargaining power of buyers

Bargaining power of buyers - Impact of key factors 2025 and 2030

7.3 Bargaining power of suppliers

Bargaining power of suppliers - Impact of key factors in 2025 and 2030

7.4 Threat of new entrants

Threat of new entrants - Impact of key factors in 2025 and 2030

7.5 Threat of substitutes

Threat of substitutes - Impact of key factors in 2025 and 2030

7.6 Threat of rivalry

Threat of rivalry - Impact of key factors in 2025 and 2030

7.7 Market condition

Chart on Market condition - Five forces 2025 and 2030

8. Market Segmentation by Product

8.1 Market segments

Chart on Product - Market share 2025-2030 (%)
Data Table on Product - Market share 2025-2030 (%)

8.2 Comparison by Product

Chart on Comparison by Product
Data Table on Comparison by Product

8.3 Hybrid bikes - Market size and forecast 2025-2030

Chart on Hybrid bikes - Market size and forecast 2025-2030 ($ million)
Data Table on Hybrid bikes - Market size and forecast 2025-2030 ($ million)
Chart on Hybrid bikes - Year-over-year growth 2025-2030 (%)
Data Table on Hybrid bikes - Year-over-year growth 2025-2030 (%)

8.4 Mountain bikes - Market size and forecast 2025-2030

Chart on Mountain bikes - Market size and forecast 2025-2030 ($ million)
Data Table on Mountain bikes - Market size and forecast 2025-2030 ($ million)
Chart on Mountain bikes - Year-over-year growth 2025-2030 (%)
Data Table on Mountain bikes - Year-over-year growth 2025-2030 (%)

8.5 Road bikes - Market size and forecast 2025-2030

Chart on Road bikes - Market size and forecast 2025-2030 ($ million)
Data Table on Road bikes - Market size and forecast 2025-2030 ($ million)
Chart on Road bikes - Year-over-year growth 2025-2030 (%)
Data Table on Road bikes - Year-over-year growth 2025-2030 (%)

8.6 Track bikes - Market size and forecast 2025-2030

Chart on Track bikes - Market size and forecast 2025-2030 ($ million)
Data Table on Track bikes - Market size and forecast 2025-2030 ($ million)
Chart on Track bikes - Year-over-year growth 2025-2030 (%)
Data Table on Track bikes - Year-over-year growth 2025-2030 (%)

8.7 Others - Market size and forecast 2025-2030

Chart on Others - Market size and forecast 2025-2030 ($ million)
Data Table on Others - Market size and forecast 2025-2030 ($ million)
Chart on Others - Year-over-year growth 2025-2030 (%)
Data Table on Others - Year-over-year growth 2025-2030 (%)

8.8 Market opportunity by Product

Market opportunity by Product ($ million)
Data Table on Market opportunity by Product ($ million)

9. Market Segmentation by Distribution Channel

9.1 Market segments

Chart on Distribution Channel - Market share 2025-2030 (%)
Data Table on Distribution Channel - Market share 2025-2030 (%)

9.2 Comparison by Distribution Channel

Chart on Comparison by Distribution Channel
Data Table on Comparison by Distribution Channel

9.3 Offline - Market size and forecast 2025-2030

Chart on Offline - Market size and forecast 2025-2030 ($ million)
Data Table on Offline - Market size and forecast 2025-2030 ($ million)
Chart on Offline - Year-over-year growth 2025-2030 (%)
Data Table on Offline - Year-over-year growth 2025-2030 (%)

9.4 Online - Market size and forecast 2025-2030

Chart on Online - Market size and forecast 2025-2030 ($ million)
Data Table on Online - Market size and forecast 2025-2030 ($ million)
Chart on Online - Year-over-year growth 2025-2030 (%)
Data Table on Online - Year-over-year growth 2025-2030 (%)

9.5 Market opportunity by Distribution Channel

Market opportunity by Distribution Channel ($ million)
Data Table on Market opportunity by Distribution Channel ($ million)

10. Market Segmentation by End-user

10.1 Market segments

Chart on End-user - Market share 2025-2030 (%)
Data Table on End-user - Market share 2025-2030 (%)

10.2 Comparison by End-user

Chart on Comparison by End-user
Data Table on Comparison by End-user

10.3 Enthusiasts - Market size and forecast 2025-2030

Chart on Enthusiasts - Market size and forecast 2025-2030 ($ million)
Data Table on Enthusiasts - Market size and forecast 2025-2030 ($ million)
Chart on Enthusiasts - Year-over-year growth 2025-2030 (%)
Data Table on Enthusiasts - Year-over-year growth 2025-2030 (%)

10.4 Professional cyclists - Market size and forecast 2025-2030

Chart on Professional cyclists - Market size and forecast 2025-2030 ($ million)
Data Table on Professional cyclists - Market size and forecast 2025-2030 ($ million)
Chart on Professional cyclists - Year-over-year growth 2025-2030 (%)
Data Table on Professional cyclists - Year-over-year growth 2025-2030 (%)

10.5 Market opportunity by End-user

Market opportunity by End-user ($ million)
Data Table on Market opportunity by End-user ($ million)

11. Customer Landscape

11.1 Customer landscape overview

Analysis of price sensitivity, lifecycle, customer purchase basket, adoption rates, and purchase criteria

12. Geographic Landscape

12.1 Geographic segmentation

Chart on Market share by geography 2025-2030 (%)
Data Table on Market share by geography 2025-2030 (%)

12.2 Geographic comparison

Chart on Geographic comparison
Data Table on Geographic comparison

12.3 North America - Market size and forecast 2025-2030

Chart on North America - Market size and forecast 2025-2030 ($ million)
Data Table on North America - Market size and forecast 2025-2030 ($ million)
Chart on North America - Year-over-year growth 2025-2030 (%)
Data Table on North America - Year-over-year growth 2025-2030 (%)
Chart on Regional Comparison - North America
Data Table on Regional Comparison - North America

12.3.1 US - Market size and forecast 2025-2030

Chart on US - Market size and forecast 2025-2030 ($ million)
Data Table on US - Market size and forecast 2025-2030 ($ million)
Chart on US - Year-over-year growth 2025-2030 (%)
Data Table on US - Year-over-year growth 2025-2030 (%)

12.3.2 Canada - Market size and forecast 2025-2030

Chart on Canada - Market size and forecast 2025-2030 ($ million)
Data Table on Canada - Market size and forecast 2025-2030 ($ million)
Chart on Canada - Year-over-year growth 2025-2030 (%)
Data Table on Canada - Year-over-year growth 2025-2030 (%)

12.3.3 Mexico - Market size and forecast 2025-2030

Chart on Mexico - Market size and forecast 2025-2030 ($ million)
Data Table on Mexico - Market size and forecast 2025-2030 ($ million)
Chart on Mexico - Year-over-year growth 2025-2030 (%)
Data Table on Mexico - Year-over-year growth 2025-2030 (%)

12.4 APAC - Market size and forecast 2025-2030

Chart on APAC - Market size and forecast 2025-2030 ($ million)
Data Table on APAC - Market size and forecast 2025-2030 ($ million)
Chart on APAC - Year-over-year growth 2025-2030 (%)
Data Table on APAC - Year-over-year growth 2025-2030 (%)
Chart on Regional Comparison - APAC
Data Table on Regional Comparison - APAC

12.4.1 China - Market size and forecast 2025-2030

Chart on China - Market size and forecast 2025-2030 ($ million)
Data Table on China - Market size and forecast 2025-2030 ($ million)
Chart on China - Year-over-year growth 2025-2030 (%)
Data Table on China - Year-over-year growth 2025-2030 (%)

12.4.2 Japan - Market size and forecast 2025-2030

Chart on Japan - Market size and forecast 2025-2030 ($ million)
Data Table on Japan - Market size and forecast 2025-2030 ($ million)
Chart on Japan - Year-over-year growth 2025-2030 (%)
Data Table on Japan - Year-over-year growth 2025-2030 (%)

12.4.3 Australia - Market size and forecast 2025-2030

Chart on Australia - Market size and forecast 2025-2030 ($ million)
Data Table on Australia - Market size and forecast 2025-2030 ($ million)
Chart on Australia - Year-over-year growth 2025-2030 (%)
Data Table on Australia - Year-over-year growth 2025-2030 (%)

12.4.4 Thailand - Market size and forecast 2025-2030

Chart on Thailand - Market size and forecast 2025-2030 ($ million)
Data Table on Thailand - Market size and forecast 2025-2030 ($ million)
Chart on Thailand - Year-over-year growth 2025-2030 (%)
Data Table on Thailand - Year-over-year growth 2025-2030 (%)

12.4.5 Indonesia - Market size and forecast 2025-2030

Chart on Indonesia - Market size and forecast 2025-2030 ($ million)
Data Table on Indonesia - Market size and forecast 2025-2030 ($ million)
Chart on Indonesia - Year-over-year growth 2025-2030 (%)
Data Table on Indonesia - Year-over-year growth 2025-2030 (%)

12.4.6 Taiwan - Market size and forecast 2025-2030

Chart on Taiwan - Market size and forecast 2025-2030 ($ million)
Data Table on Taiwan - Market size and forecast 2025-2030 ($ million)
Chart on Taiwan - Year-over-year growth 2025-2030 (%)
Data Table on Taiwan - Year-over-year growth 2025-2030 (%)

12.5 Europe - Market size and forecast 2025-2030

Chart on Europe - Market size and forecast 2025-2030 ($ million)
Data Table on Europe - Market size and forecast 2025-2030 ($ million)
Chart on Europe - Year-over-year growth 2025-2030 (%)
Data Table on Europe - Year-over-year growth 2025-2030 (%)
Chart on Regional Comparison - Europe
Data Table on Regional Comparison - Europe

12.5.1 Germany - Market size and forecast 2025-2030

Chart on Germany - Market size and forecast 2025-2030 ($ million)
Data Table on Germany - Market size and forecast 2025-2030 ($ million)
Chart on Germany - Year-over-year growth 2025-2030 (%)
Data Table on Germany - Year-over-year growth 2025-2030 (%)

12.5.2 France - Market size and forecast 2025-2030

Chart on France - Market size and forecast 2025-2030 ($ million)
Data Table on France - Market size and forecast 2025-2030 ($ million)
Chart on France - Year-over-year growth 2025-2030 (%)
Data Table on France - Year-over-year growth 2025-2030 (%)

12.5.3 Italy - Market size and forecast 2025-2030

Chart on Italy - Market size and forecast 2025-2030 ($ million)
Data Table on Italy - Market size and forecast 2025-2030 ($ million)
Chart on Italy - Year-over-year growth 2025-2030 (%)
Data Table on Italy - Year-over-year growth 2025-2030 (%)

12.5.4 Belgium - Market size and forecast 2025-2030

Chart on Belgium - Market size and forecast 2025-2030 ($ million)
Data Table on Belgium - Market size and forecast 2025-2030 ($ million)
Chart on Belgium - Year-over-year growth 2025-2030 (%)
Data Table on Belgium - Year-over-year growth 2025-2030 (%)

12.5.5 Spain - Market size and forecast 2025-2030

Chart on Spain - Market size and forecast 2025-2030 ($ million)
Data Table on Spain - Market size and forecast 2025-2030 ($ million)
Chart on Spain - Year-over-year growth 2025-2030 (%)
Data Table on Spain - Year-over-year growth 2025-2030 (%)

12.5.6 The Netherlands - Market size and forecast 2025-2030

Chart on The Netherlands - Market size and forecast 2025-2030 ($ million)
Data Table on The Netherlands - Market size and forecast 2025-2030 ($ million)
Chart on The Netherlands - Year-over-year growth 2025-2030 (%)
Data Table on The Netherlands - Year-over-year growth 2025-2030 (%)

12.6 South America - Market size and forecast 2025-2030

Chart on South America - Market size and forecast 2025-2030 ($ million)
Data Table on South America - Market size and forecast 2025-2030 ($ million)
Chart on South America - Year-over-year growth 2025-2030 (%)
Data Table on South America - Year-over-year growth 2025-2030 (%)
Chart on Regional Comparison - South America
Data Table on Regional Comparison - South America

12.6.1 Brazil - Market size and forecast 2025-2030

Chart on Brazil - Market size and forecast 2025-2030 ($ million)
Data Table on Brazil - Market size and forecast 2025-2030 ($ million)
Chart on Brazil - Year-over-year growth 2025-2030 (%)
Data Table on Brazil - Year-over-year growth 2025-2030 (%)

12.6.2 Argentina - Market size and forecast 2025-2030

Chart on Argentina - Market size and forecast 2025-2030 ($ million)
Data Table on Argentina - Market size and forecast 2025-2030 ($ million)
Chart on Argentina - Year-over-year growth 2025-2030 (%)
Data Table on Argentina - Year-over-year growth 2025-2030 (%)

12.6.3 Chile - Market size and forecast 2025-2030

Chart on Chile - Market size and forecast 2025-2030 ($ million)
Data Table on Chile - Market size and forecast 2025-2030 ($ million)
Chart on Chile - Year-over-year growth 2025-2030 (%)
Data Table on Chile - Year-over-year growth 2025-2030 (%)

12.7 Middle East and Africa - Market size and forecast 2025-2030

Chart on Middle East and Africa - Market size and forecast 2025-2030 ($ million)
Data Table on Middle East and Africa - Market size and forecast 2025-2030 ($ million)
Chart on Middle East and Africa - Year-over-year growth 2025-2030 (%)
Data Table on Middle East and Africa - Year-over-year growth 2025-2030 (%)
Chart on Regional Comparison - Middle East and Africa
Data Table on Regional Comparison - Middle East and Africa

12.7.1 UAE - Market size and forecast 2025-2030

Chart on UAE - Market size and forecast 2025-2030 ($ million)
Data Table on UAE - Market size and forecast 2025-2030 ($ million)
Chart on UAE - Year-over-year growth 2025-2030 (%)
Data Table on UAE - Year-over-year growth 2025-2030 (%)

12.7.2 South Africa - Market size and forecast 2025-2030

Chart on South Africa - Market size and forecast 2025-2030 ($ million)
Data Table on South Africa - Market size and forecast 2025-2030 ($ million)
Chart on South Africa - Year-over-year growth 2025-2030 (%)
Data Table on South Africa - Year-over-year growth 2025-2030 (%)

12.7.3 Saudi Arabia - Market size and forecast 2025-2030

Chart on Saudi Arabia - Market size and forecast 2025-2030 ($ million)
Data Table on Saudi Arabia - Market size and forecast 2025-2030 ($ million)
Chart on Saudi Arabia - Year-over-year growth 2025-2030 (%)
Data Table on Saudi Arabia - Year-over-year growth 2025-2030 (%)

12.7.4 Kenya - Market size and forecast 2025-2030

Chart on Kenya - Market size and forecast 2025-2030 ($ million)
Data Table on Kenya - Market size and forecast 2025-2030 ($ million)
Chart on Kenya - Year-over-year growth 2025-2030 (%)
Data Table on Kenya - Year-over-year growth 2025-2030 (%)

12.7.5 Morocco - Market size and forecast 2025-2030

Chart on Morocco - Market size and forecast 2025-2030 ($ million)
Data Table on Morocco - Market size and forecast 2025-2030 ($ million)
Chart on Morocco - Year-over-year growth 2025-2030 (%)
Data Table on Morocco - Year-over-year growth 2025-2030 (%)

12.8 Market opportunity by geography

Market opportunity by geography ($ million)
Data Tables on Market opportunity by geography ($ million)

13. Drivers, Challenges, and Opportunity

13.1 Market drivers

High-density electric integration and industrialization of weight-optimized performance E-systems
High-fidelity electronic shifting and strategic growth of wireless component ecosystems
Versatility and strategic expansion of performance gravel and adventure infrastructure

13.2 Market challenges

Crisis of inventory imbalance and post-pandemic correction of capital liquidity
Intensification of trade protectionism and escalation of material procurement costs
Conflict between technological complexity and scarcity of specialized maintenance labor

13.3 Impact of drivers and challenges

Impact of drivers and challenges in 2025 and 2030

13.4 Market opportunities

AI usage for generative frame design and predictive aerodynamics
Integrated smart connectivity and autonomous safety ecosystems
Expansion of sustainable material science and circular manufacturing protocols

14. Competitive Landscape

14.1 Overview

14.2

Overview on criticality of inputs and factors of differentiation

14.3 Landscape disruption

Overview on factors of disruption

14.4 Industry risks

Impact of key risks on business

15. Competitive Analysis

15.1 Companies profiled

Companies covered

15.2 Company ranking index

15.3 Market positioning of companies

Matrix on companies position and classification

15.4 Argon 18 Inc

Argon 18 Inc - Overview
Argon 18 Inc - Product / Service
Argon 18 Inc - Key offerings
SWOT

15.5 BH BIKES EUROPE SL

BH BIKES EUROPE SL - Overview
BH BIKES EUROPE SL - Product / Service
BH BIKES EUROPE SL - Key offerings
SWOT

15.6 Cicli Pinarello Srl

Cicli Pinarello Srl - Overview
Cicli Pinarello Srl - Product / Service
Cicli Pinarello Srl - Key offerings
SWOT

15.7 Cycling Sports Group Inc.

Cycling Sports Group Inc. - Overview
Cycling Sports Group Inc. - Product / Service
Cycling Sports Group Inc. - Key offerings
SWOT

15.8 F.I.V.E. Bianchi Spa

F.I.V.E. Bianchi Spa - Overview
F.I.V.E. Bianchi Spa - Product / Service
F.I.V.E. Bianchi Spa - Key offerings
SWOT

15.9 Giant Bicycle Inc.

Giant Bicycle Inc. - Overview
Giant Bicycle Inc. - Product / Service
Giant Bicycle Inc. - Key offerings
SWOT

15.10 Kona Bicycle Co.

Kona Bicycle Co. - Overview
Kona Bicycle Co. - Product / Service
Kona Bicycle Co. - Key offerings
SWOT

15.11 LAPIERRE SA

LAPIERRE SA - Overview
LAPIERRE SA - Product / Service
LAPIERRE SA - Key offerings
SWOT

15.12 LOOK Cycle International

LOOK Cycle International - Overview
LOOK Cycle International - Product / Service
LOOK Cycle International - Key offerings
SWOT

15.13 Merida Industry Co. Ltd.

Merida Industry Co. Ltd. - Overview
Merida Industry Co. Ltd. - Business segments
Merida Industry Co. Ltd. - Key offerings
Merida Industry Co. Ltd. - Segment focus
SWOT

15.14 Orbea S. Coop.

Orbea S. Coop. - Overview
Orbea S. Coop. - Product / Service
Orbea S. Coop. - Key offerings
SWOT

15.15 Santa Cruz Bicycles LLC

Santa Cruz Bicycles LLC - Overview
Santa Cruz Bicycles LLC - Product / Service
Santa Cruz Bicycles LLC - Key offerings
SWOT

15.16 Specialized Bicycle Components

Specialized Bicycle Components - Overview
Specialized Bicycle Components - Product / Service
Specialized Bicycle Components - Key offerings
SWOT

15.17 Trek Bicycle Corp.

Trek Bicycle Corp. - Overview
Trek Bicycle Corp. - Product / Service
Trek Bicycle Corp. - Key offerings
SWOT

15.18 Wilier Triestina SpA

Wilier Triestina SpA - Overview
Wilier Triestina SpA - Product / Service
Wilier Triestina SpA - Key offerings
SWOT

16. Appendix

16.1 Scope of the report

Market definition
Objectives
Notes and caveats

16.2 Inclusions and exclusions checklist

Inclusions checklist
Exclusions checklist

16.3 Currency conversion rates for US$

16.4 Research methodology

16.5 Data procurement

Information sources

16.6 Data validation

16.7 Validation techniques employed for market sizing

16.8 Data synthesis

16.9 360 degree market analysis

16.10 List of abbreviations

Research Methodology

Technavio presents a detailed picture of the market by way of study, synthesis, and summation of data from multiple sources. The analysts have presented the various facets of the market with a particular focus on identifying the key industry influencers. The data thus presented is comprehensive, reliable, and the result of extensive research, both primary and secondary.

INFORMATION SOURCES

Primary sources

  • Manufacturers and suppliers
  • Channel partners
  • Industry experts
  • Strategic decision makers

Secondary sources

  • Industry journals and periodicals
  • Government data
  • Financial reports of key industry players
  • Historical data
  • Press releases

DATA ANALYSIS

Data Synthesis

  • Collation of data
  • Estimation of key figures
  • Analysis of derived insights

Data Validation

  • Triangulation with data models
  • Reference against proprietary databases
  • Corroboration with industry experts

REPORT WRITING

Qualitative

  • Market drivers
  • Market challenges
  • Market trends
  • Five forces analysis

Quantitative

  • Market size and forecast
  • Market segmentation
  • Geographical insights
  • Competitive landscape

Interested in this report?

Get your sample now to see our research methodology and insights!

Download Now

Frequently Asked Questions

High-end Bicycle market growth will increase by USD 6636.0 million during 2026-2030.

The High-end Bicycle market is expected to grow at a CAGR of 7.2% during 2026-2030.

High-end Bicycle market is segmented by Product (Hybrid bikes, Mountain bikes, Road bikes, Track bikes, Others) Distribution channel (Offline, Online) End-user (Enthusiasts, Professional cyclists)

Argon 18 Inc, BH BIKES EUROPE SL, Cicli Pinarello Srl, Cycleurope AB, Cycling Sports Group Inc., DAHON North America Inc., F.I.V.E. Bianchi Spa, Giant Bicycle Inc., Kalkhoff Werke GmbH, Klever Mobility Europe GmbH, Kona Bicycle Co., LAPIERRE SA, LOOK Cycle International, Marin Mountain Bikes Inc., Merida Industry Co. Ltd., Orbea S. Coop., Passoni, Santa Cruz Bicycles LLC, Specialized Bicycle Components, Storck Bicycle GmbH, Trek Bicycle Corp., Wilier Triestina SpA are a few of the key vendors in the High-end Bicycle market.

APAC will register the highest growth rate of 34% among the other regions. Therefore, the High-end Bicycle market in APAC is expected to garner significant business opportunities for the vendors during the forecast period.

US, Canada, Mexico, China, Japan, Australia, Thailand, Indonesia, Taiwan, Germany, France, Italy, Belgium, Spain, The Netherlands, Brazil, Argentina, Chile, UAE, South Africa, Saudi Arabia, Kenya, Morocco

  • High-density electric integration and industrialization of weight-optimized performance E-systems is the driving factor this market.

The High-end Bicycle market vendors should focus on grabbing business opportunities from the Product segment as it accounted for the largest market share in the base year.
RIA - Research AI Assistant
Ask RIA