Composite Materials Market Analysis, Size, and Forecast 2025-2029: North America (US and Canada), Europe (France, Germany, Italy, and UK), APAC (China, India, and Japan), South America (Brazil), and Rest of World (ROW)

Composite Materials Market Analysis, Size, and Forecast 2025-2029:
North America (US and Canada), Europe (France, Germany, Italy, and UK), APAC (China, India, and Japan), South America (Brazil), and Rest of World (ROW)

Published: Jun 2025 231 Pages SKU: IRTNTR71070

Market Overview at a Glance

$37.24 B
Market Opportunity
11.3%
CAGR
10.6
YoY growth 2024-2025(%)

Composite Materials Market Size 2025-2029

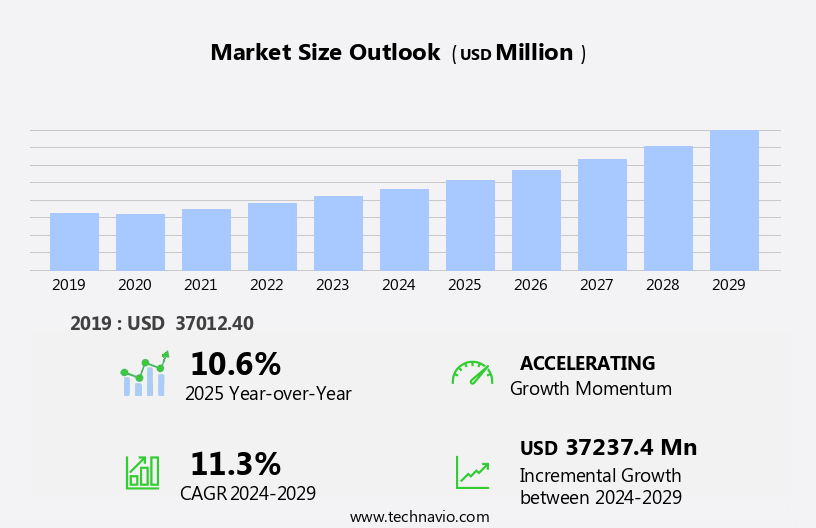
The composite materials market size is forecast to increase by USD 37.24 billion, at a CAGR of 11.3% between 2024 and 2029.

  • The market is witnessing significant growth, driven primarily by the increasing demand in the transportation industry. Composite materials offer numerous advantages, including high strength-to-weight ratio, corrosion resistance, and durability, making them an ideal choice for automotive and aerospace applications. Aramid fiber, basalt fiber, and carbon fiber are popular reinforcement choices for their unique properties, such as high strength and UV resistance.  This sector's growth is further fueled by strategic collaborations, partnerships, and mergers and acquisitions, enabling companies to expand their product portfolios and geographical reach. However, the high cost of composites remains a significant challenge for market growth.
  • Companies seeking to capitalize on the market opportunities must focus on cost reduction strategies, such as optimizing production processes and exploring alternative raw materials, while also investing in research and development to improve the performance and affordability of composite materials. The production process for composite materials is complex and resource-intensive, leading to higher production costs compared to traditional materials. Additionally, the limited availability of raw materials and the need for specialized equipment and expertise further contribute to the high cost. In the realm of renewable energy, composite materials are increasingly being used in wind energy applications due to their lightweight and high strength properties.

What will be the Size of the Composite Materials Market during the forecast period?

Composite Materials Market Size

Explore in-depth regional segment analysis with market size data - historical 2019-2023 and forecasts 2025-2029 - in the full report.  
Request Free Sample

The market continues to evolve, driven by advancements in material science and technological innovations. These materials, which include thermoset and thermoplastic composites, are renowned for their exceptional properties, such as high strength-to-weight ratio, creep resistance, and thermal stability. In various sectors, composite materials are making a significant impact. Construction applications utilize these materials for their excellent mechanical properties and resistance to chemical and environmental factors. In the automotive industry, composite components offer weight reduction and improved fuel efficiency. In the aerospace sector, composites ensure superior structural performance and durability.

Supply chain management plays a crucial role in the market, with companies focusing on optimizing production processes and ensuring quality control through non-destructive testing (NDT) techniques. Filament winding and resin transfer molding are common manufacturing techniques, while thermoset composites are known for their fatigue resistance and polymer matrix provides excellent design optimization. Thermoplastic composites offer advantages like ease of processing and recyclability. Sandwich structures, honeycomb cores, and advanced resin systems contribute to the efficiency and durability of wind turbine blades. 

As the market continues to unfold, ongoing research and development efforts focus on improving surface treatment, material selection, and joining techniques. Standard testing methods ensure consistent quality and performance across various applications, from consumer electronics to biomedical applications. In summary, the market is a dynamic and evolving landscape, with continuous advancements in material science, manufacturing techniques, and applications across various sectors. The ongoing quest for improved properties, cost analysis, and sustainable production methods ensures a vibrant and innovative future for this industry.

How is this Composite Materials Industry segmented?

The composite materials industry research report provides comprehensive data (region-wise segment analysis), with forecasts and estimates in "USD million" for the period 2025-2029, as well as historical data from 2019-2023 for the following segments.

  • Type
    • Glass fiber
    • Carbon fiber
    • Aramid Fiber
    • Others
  • End-user
    • Electricals and electronics
    • Construction
    • Aerospace and defense
    • Others
  • Material
    • Polymer Matrix Composites
    • Ceramic and carbon matrix composites
    • Metal matrix composites
  • Geography
    • North America
      • US
      • Canada
    • Europe
      • France
      • Germany
      • Italy
      • UK
    • APAC
      • China
      • India
      • Japan
    • South America
      • Brazil
    • Rest of World (ROW)

By Type Insights

The Glass fiber segment is estimated to witness significant growth during the forecast period. The market encompasses various segments, including resin systems, molding techniques, and fiber types, with glass fiber holding the largest share. Glass fibers' superior attributes, such as strength, flexibility, durability, stability, low weight, and resistance to heat, temperature, and moisture, make them a preferred choice in industries like construction, wind energy, pipes and tanks, marine, and transportation. In the marine industry, glass fiber is utilized in applications such as underbody systems, deck lids, front-end modules, bumper beams, engine covers and instrument panels, and air ducts, owing to its excellent chemical resistance and electrical properties. Moreover, the development of glass fiber-reinforced composite materials for wind energy applications, particularly in the production of turbine blades, is expected to boost demand in the forecast period.

Additionally, material science advancements have led to the emergence of alternative fiber types, such as carbon, aramid, basalt, and natural fibers, which offer unique properties, including thermal stability, fatigue resistance, and UV resistance, respectively. These fibers are increasingly being adopted in various applications, including automotive, aerospace, sporting goods, and biomedical industries, through techniques like injection molding, compression molding, filament winding, and resin transfer molding. Furthermore, advancements in material science, design optimization, and supply chain management have enabled the production of high-performance composites with superior mechanical properties, thermal properties, and surface finishing, catering to the evolving demands of various industries.

Non-destructive testing methods, such as ultrasonic testing and X-ray radiography, are crucial in ensuring quality control and maintaining the integrity of composite structures. The market's growth is driven by factors like weight reduction, cost analysis, and the increasing adoption of composite materials in various industries, leading to a diverse range of applications and opportunities for innovation. These alliances are helping companies strengthen their capabilities, expand product portfolios, and improve innovation in medical composites, accelerating the development and adoption of advanced composite materials in transportation applications as well as others such as aerospace.

Composite Materials Market Size

Request Free Sample

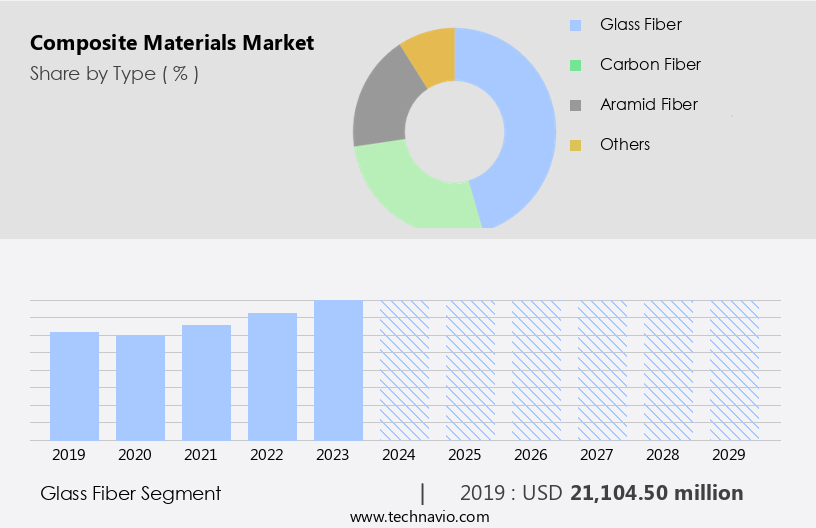
The Glass fiber segment was valued at USD 21.1 billion in 2019 and showed a gradual increase during the forecast period.

Regional Analysis

APAC is estimated to contribute 30% to the growth of the global market during the forecast period.Technavio's analysts have elaborately explained the regional trends and drivers that shape the market during the forecast period.

Composite Materials Market Share by Geography

 Request Free Sample

The market in North America is currently the largest in the global industry, driven by the presence of major manufacturers and end-users in the region. In the US, the automotive sector is the primary market for composite materials due to the increasing demand for lightweight, strong, and non-corrosive alternatives to steel. Glass fibers and carbon fibers, in particular, offer significant advantages in terms of weight reduction and improved mechanical properties, making them popular choices for automotive applications. The region's automotive industry is further bolstered by the presence of leading automakers like General Motors, and the steady growth of the market.

Additionally, composite materials find extensive use in various industries, including marine, construction, aerospace, wind energy, and consumer electronics, among others. Material science advancements have led to the development of innovative composite structures, such as sandwich structures, honeycomb structures, and filament winding, which offer enhanced thermal, electrical, and chemical resistance properties. The market also benefits from advancements in molding techniques, such as injection molding, compression molding, and resin systems, enabling cost-effective and efficient production. Supply chain management, standard testing methods, and non-destructive testing techniques ensure quality control and reliability. Natural fibers, basalt fibers, aramid fibers, and coupling agents are also gaining popularity due to their unique properties and cost-effectiveness.

The market is expected to continue its growth trajectory, driven by the increasing demand for lightweight and high-performance materials across various industries.

Market Dynamics

Our researchers analyzed the data with 2024 as the base year, along with the key drivers, trends, and challenges. A holistic analysis of drivers will help companies refine their marketing strategies to gain a competitive advantage.

What are the key market drivers leading to the rise in the adoption of Composite Materials Industry?

  • The transportation industry's increasing requirement for lightweight and durable materials, leading to a surging demand for composite materials, serves as the primary market driver. Composite materials, including resin systems and fiber reinforcements such as carbon fiber and basalt fiber, have gained significant traction in various industries due to their superior properties. In consumer electronics applications, composite materials offer enhanced durability and thermal stability, making them ideal for manufacturing lightweight and robust devices. Surface finishing techniques have further expanded their usage, allowing for customizable aesthetics. The automotive sector has been a major adopter of composite materials, with a growing preference for carbon fiber and natural fibers in lightweight construction and e-mobility applications. These materials offer improved thermal properties, leading to better fuel efficiency and reduced CO2 emissions.
  • Composite materials are increasingly used in vehicle components beyond body panels, including frames, rims, springs, and truck bed liners, providing damage resistance and increased safety. Joining techniques for composite materials have also advanced, enabling more complex designs and optimized structures. Standard testing methods ensure consistent quality and performance, ensuring that these materials meet the evolving demands of various industries. Sporting goods applications, such as bicycles and golf clubs, also benefit from the lightweight and durable nature of composite materials. Overall, the versatility and performance advantages of composite materials continue to drive their adoption across various industries.

What are the market trends shaping the Composite Materials Industry?

  • Strategic collaborations, partnerships, and mergers and acquisitions are increasingly becoming the norm in today's business landscape. These approaches enable organizations to expand their reach, enhance their capabilities, and drive growth in a dynamic market. The market is witnessing significant strategic initiatives as companies collaborate and partner to develop advanced, cost-effective composite materials. In one notable instance, Mitsubishi Chemical Group completed the acquisition of CPC SRL in January 2024, a specialist in carbon fiber reinforced plastics for the automotive sector. This acquisition enhances Mitsubishi's capabilities in this field. In another move, Gurit expanded its presence in North America by acquiring 100% of FX Composites LLC's assets in February 2024. This acquisition strengthens Gurit's material finishing, kitting, and logistics capabilities in the marine and industrial sectors, improving its competitive position. Material science continues to play a crucial role in the development of composite materials for various applications, including construction and wind energy.
  • Supply chain management and non-destructive testing (NDT) are essential aspects of ensuring the quality and reliability of these materials. Aramid fiber, a high-performance reinforcement material, is increasingly being used due to its excellent fatigue resistance and UV resistance. Manufacturers are employing techniques like filament winding and thermoset composites to create lightweight, strong materials. Thermoplastic composites, with their polymer matrix, offer advantages like ease of processing and recyclability. The reinforcement layup process is a critical step in the production of composite materials, ensuring optimal fiber alignment and material properties. These advancements are driving the growth and innovation in the market.

What challenges does the Composite Materials Industry face during its growth?

  • The high cost of composites poses a significant challenge to the growth of the industry. In order to remain competitive and profitable, companies must find ways to reduce manufacturing costs or develop more cost-effective composite materials. This can be achieved through advancements in production techniques, raw material sourcing, or research and development of new composite technologies. Despite these challenges, the industry continues to grow due to the unique properties of composites, such as strength, lightweight, and durability, which make them ideal for use in various industries including aerospace, automotive, and construction. Composite materials, consisting of polymeric resins and reinforcing fibers such as glass or carbon, have gained significant attention in various industries due to their superior mechanical properties and lightweight nature. The high creep resistance and excellent compressive strength make them ideal for structural applications in aerospace and automotive sectors.
  • However, the high cost of carbon fiber, primarily due to the cost and yield of its precursors and conversion processes, remains a challenge. The current carbon fiber is primarily PAN-based, with an average cost near USD21 per pound. In addition to structural applications, composite materials have found use in biomedical fields for their biocompatibility and excellent mechanical properties. Honeycomb structures and coupling agents are essential in enhancing the moisture absorption resistance and mechanical properties of these materials. Structural analysis and product design are critical in optimizing the performance and cost of composite materials in various applications. Curing processes are crucial in enhancing the physical properties of composite materials. Compression molding is a common manufacturing technique used to produce large, complex parts with high fiber volume fractions. Carbon fiber composites, in particular, have seen increased usage due to their high specific strength and modulus, which surpass those of steel, aluminum, wood, and performance plastics.

Exclusive Customer Landscape

The composite materials market forecasting report includes the adoption lifecycle of the market, covering from the innovator's stage to the laggard's stage. It focuses on adoption rates in different regions based on penetration. Furthermore, the composite materials market report also includes key purchase criteria and drivers of price sensitivity to help companies evaluate and develop their market growth analysis strategies.

Composite Materials Market Share by Geography

 Customer Landscape

Key Companies & Market Insights

Companies are implementing various strategies, such as strategic alliances, composite materials market forecast, partnerships, mergers and acquisitions, geographical expansion, and product/service launches, to enhance their presence in the industry.

3M Co. - The company specializes in composite materials, with a focus on honeycomb sandwich composites, which serve as a key innovation in the aerospace industry.

The industry research and growth report includes detailed analyses of the competitive landscape of the market and information about key companies, including:

  • 3M Co.
  • Cabot Corp.
  • China Jushi Co. Ltd.
  • Compagnie de Saint Gobain SA
  • COMPOSITES UNIVERSAL GROUP
  • DuPont de Nemours Inc.
  • Gurit Holding AG
  • Hexcel Corp.
  • Huntsman Corp.
  • Kineco Ltd.
  • Mitsubishi Chemical Corp.
  • Momentive Performance Materials
  • Nippon Electric Glass Co. Ltd.
  • Owens Corning
  • Scott Bader Co. Ltd.
  • SGL Carbon SE
  • Solvay SA
  • Teijin Ltd.
  • Toray Industries Inc.
  • Veplas dd

Qualitative and quantitative analysis of companies has been conducted to help clients understand the wider business environment as well as the strengths and weaknesses of key industry players. Data is qualitatively analyzed to categorize companies as pure play, category-focused, industry-focused, and diversified; it is quantitatively analyzed to categorize companies as dominant, leading, strong, tentative, and weak.

Recent Development and News in Composite Materials Market

  • In January 2024, Hexcel Corporation, a leading composite materials provider, announced the launch of a new lightweight composite material for the aerospace industry, which reduced fuel consumption by 5% without compromising structural integrity (Hexcel Corporation Press Release).
  • In March 2024, SGL Carbon and Lanxess AG formed a strategic partnership to jointly develop and produce carbon fiber composites for the automotive industry, aiming to increase market share and reduce production costs (SGL Carbon Press Release).
  • In April 2024, Teijin Limited, a major player in the market, completed the acquisition of Toho Tenax Europe GmbH, a leading European manufacturer of carbon fiber composites, significantly expanding its European production capacity and market presence (Teijin Limited Press Release).
  • In May 2025, the European Union approved the use of composite materials in the construction sector for earthquake-resistant structures, opening a new market for composite material manufacturers and driving demand for these materials in the region (European Commission Press Release).

Research Analyst Overview

The market is experiencing significant advancements in various properties, driven by the integration of innovative technologies such as additive manufacturing and 3D printing. These techniques enable the optimization of fiber orientation, interlaminar shear strength, and tensile strength, among others, leading to enhanced performance in applications requiring high flexural strength, fatigue life, and impact resistance. Moreover, out-of-autoclave (ooa) curing and thermal conductivity are gaining traction due to their potential to reduce production costs and improve supply chain resilience. Fire resistance, compressive strength, and smoke emission are also crucial factors influencing the market, with regulatory compliance and product certification playing a vital role in ensuring safety and quality.

Technology roadmaps highlight the importance of performance optimization, cure monitoring, and non-destructive evaluation (NDE) techniques to address challenges related to fracture toughness, thermal expansion, and creep behavior. Additionally, specific strength, specific stiffness, dielectric strength, and acoustic properties are essential considerations for various industries, including aerospace and automotive, where lightweight and high-performing materials are essential. Regulatory compliance, quality assurance, and supply chain resilience are crucial aspects of the market, with regulatory bodies increasingly focusing on smoke emission, thermal expansion, and fire resistance. As the industry continues to evolve, it is essential to stay updated on the latest trends and advancements to remain competitive and meet the demands of diverse industries.

Dive into Technavio's robust research methodology, blending expert interviews, extensive data synthesis, and validated models for unparalleled Composite Materials Market insights. See full methodology.

Market Scope

Report Coverage

Details

Page number

231

Base year

2024

Historic period

2019-2023

Forecast period

2025-2029

Growth momentum & CAGR

Accelerate at a CAGR of 11.3%

Market growth 2025-2029

USD 37.24 billion

Market structure

Fragmented

YoY growth 2024-2025(%)

10.6

Key countries

US, China, Germany, UK, Japan, France, Canada, Brazil, India, and Italy

Competitive landscape

Leading Companies, Market Positioning of Companies, Competitive Strategies, and Industry Risks

Request Free Sample

What are the Key Data Covered in this Composite Materials Market Research and Growth Report?

  • CAGR of the Composite Materials industry during the forecast period
  • Detailed information on factors that will drive the growth and forecasting between 2025 and 2029
  • Precise estimation of the size of the market and its contribution of the industry in focus to the parent market
  • Accurate predictions about upcoming growth and trends and changes in consumer behaviour
  • Growth of the market across North America, Europe, APAC, South America, and Middle East and Africa
  • Thorough analysis of the market's competitive landscape and detailed information about companies
  • Comprehensive analysis of factors that will challenge the composite materials market growth of industry companies

We can help! Our analysts can customize this composite materials market research report to meet your requirements.

Get in touch

1 Executive Summary

  • 1.1 Market overview
    • Executive Summary - Chart on Market Overview
    • Executive Summary - Data Table on Market Overview
    • Executive Summary - Chart on Global Market Characteristics
    • Executive Summary - Chart on Market by Geography
    • Executive Summary - Chart on Market Segmentation by Type
    • Executive Summary - Chart on Market Segmentation by End-user
    • Executive Summary - Chart on Market Segmentation by Material
    • Executive Summary - Chart on Incremental Growth
    • Executive Summary - Data Table on Incremental Growth
    • Executive Summary - Chart on Company Market Positioning

2 Technavio Analysis

  • 2.1 Analysis of price sensitivity, lifecycle, customer purchase basket, adoption rates, and purchase criteria
    • Analysis of price sensitivity, lifecycle, customer purchase basket, adoption rates, and purchase criteria
  • 2.2 Criticality of inputs and Factors of differentiation
    • Overview on criticality of inputs and factors of differentiation
  • 2.3 Factors of disruption
    • Overview on factors of disruption
  • 2.4 Impact of drivers and challenges
    • Impact of drivers and challenges in 2024 and 2029

3 Market Landscape

  • 3.1 Market ecosystem
    • Parent Market
    • Data Table on - Parent Market
  • 3.2 Market characteristics
    • Market characteristics analysis
  • 3.3 Value chain analysis
    • Value chain analysis

4 Market Sizing

  • 4.1 Market definition
    • Offerings of companies included in the market definition
  • 4.2 Market segment analysis
    • Market segments
  • 4.3 Market size 2024
    • 4.4 Market outlook: Forecast for 2024-2029
      • Chart on Global - Market size and forecast 2024-2029 ($ million)
      • Data Table on Global - Market size and forecast 2024-2029 ($ million)
      • Chart on Global Market: Year-over-year growth 2024-2029 (%)
      • Data Table on Global Market: Year-over-year growth 2024-2029 (%)

    5 Historic Market Size

    • 5.1 Global Composite Materials Market 2019 - 2023
      • Historic Market Size - Data Table on Global Composite Materials Market 2019 - 2023 ($ million)
    • 5.2 Type segment analysis 2019 - 2023
      • Historic Market Size - Type Segment 2019 - 2023 ($ million)
    • 5.3 End-user segment analysis 2019 - 2023
      • Historic Market Size - End-user Segment 2019 - 2023 ($ million)
    • 5.4 Material segment analysis 2019 - 2023
      • Historic Market Size - Material Segment 2019 - 2023 ($ million)
    • 5.5 Geography segment analysis 2019 - 2023
      • Historic Market Size - Geography Segment 2019 - 2023 ($ million)
    • 5.6 Country segment analysis 2019 - 2023
      • Historic Market Size - Country Segment 2019 - 2023 ($ million)

    6 Qualitative Analysis

    • 6.1 Impact of AI in global composite materials market

      7 Five Forces Analysis

      • 7.1 Five forces summary
        • Five forces analysis - Comparison between 2024 and 2029
      • 7.2 Bargaining power of buyers
        • Bargaining power of buyers - Impact of key factors 2024 and 2029
      • 7.3 Bargaining power of suppliers
        • Bargaining power of suppliers - Impact of key factors in 2024 and 2029
      • 7.4 Threat of new entrants
        • Threat of new entrants - Impact of key factors in 2024 and 2029
      • 7.5 Threat of substitutes
        • Threat of substitutes - Impact of key factors in 2024 and 2029
      • 7.6 Threat of rivalry
        • Threat of rivalry - Impact of key factors in 2024 and 2029
      • 7.7 Market condition
        • Chart on Market condition - Five forces 2024 and 2029

      8 Market Segmentation by Type

      • 8.1 Market segments
        • Chart on Type - Market share 2024-2029 (%)
        • Data Table on Type - Market share 2024-2029 (%)
      • 8.2 Comparison by Type
        • Chart on Comparison by Type
        • Data Table on Comparison by Type
      • 8.3 Glass fiber - Market size and forecast 2024-2029
        • Chart on Glass fiber - Market size and forecast 2024-2029 ($ million)
        • Data Table on Glass fiber - Market size and forecast 2024-2029 ($ million)
        • Chart on Glass fiber - Year-over-year growth 2024-2029 (%)
        • Data Table on Glass fiber - Year-over-year growth 2024-2029 (%)
      • 8.4 Carbon fiber - Market size and forecast 2024-2029
        • Chart on Carbon fiber - Market size and forecast 2024-2029 ($ million)
        • Data Table on Carbon fiber - Market size and forecast 2024-2029 ($ million)
        • Chart on Carbon fiber - Year-over-year growth 2024-2029 (%)
        • Data Table on Carbon fiber - Year-over-year growth 2024-2029 (%)
      • 8.5 Aramid Fiber - Market size and forecast 2024-2029
        • Chart on Aramid Fiber - Market size and forecast 2024-2029 ($ million)
        • Data Table on Aramid Fiber - Market size and forecast 2024-2029 ($ million)
        • Chart on Aramid Fiber - Year-over-year growth 2024-2029 (%)
        • Data Table on Aramid Fiber - Year-over-year growth 2024-2029 (%)
      • 8.6 Others - Market size and forecast 2024-2029
        • Chart on Others - Market size and forecast 2024-2029 ($ million)
        • Data Table on Others - Market size and forecast 2024-2029 ($ million)
        • Chart on Others - Year-over-year growth 2024-2029 (%)
        • Data Table on Others - Year-over-year growth 2024-2029 (%)
      • 8.7 Market opportunity by Type
        • Market opportunity by Type ($ million)
        • Data Table on Market opportunity by Type ($ million)

      9 Market Segmentation by End-user

      • 9.1 Market segments
        • Chart on End-user - Market share 2024-2029 (%)
        • Data Table on End-user - Market share 2024-2029 (%)
      • 9.2 Comparison by End-user
        • Chart on Comparison by End-user
        • Data Table on Comparison by End-user
      • 9.3 Electricals and electronics - Market size and forecast 2024-2029
        • Chart on Electricals and electronics - Market size and forecast 2024-2029 ($ million)
        • Data Table on Electricals and electronics - Market size and forecast 2024-2029 ($ million)
        • Chart on Electricals and electronics - Year-over-year growth 2024-2029 (%)
        • Data Table on Electricals and electronics - Year-over-year growth 2024-2029 (%)
      • 9.4 Construction - Market size and forecast 2024-2029
        • Chart on Construction - Market size and forecast 2024-2029 ($ million)
        • Data Table on Construction - Market size and forecast 2024-2029 ($ million)
        • Chart on Construction - Year-over-year growth 2024-2029 (%)
        • Data Table on Construction - Year-over-year growth 2024-2029 (%)
      • 9.5 Aerospace and defense - Market size and forecast 2024-2029
        • Chart on Aerospace and defense - Market size and forecast 2024-2029 ($ million)
        • Data Table on Aerospace and defense - Market size and forecast 2024-2029 ($ million)
        • Chart on Aerospace and defense - Year-over-year growth 2024-2029 (%)
        • Data Table on Aerospace and defense - Year-over-year growth 2024-2029 (%)
      • 9.6 Others - Market size and forecast 2024-2029
        • Chart on Others - Market size and forecast 2024-2029 ($ million)
        • Data Table on Others - Market size and forecast 2024-2029 ($ million)
        • Chart on Others - Year-over-year growth 2024-2029 (%)
        • Data Table on Others - Year-over-year growth 2024-2029 (%)
      • 9.7 Market opportunity by End-user
        • Market opportunity by End-user ($ million)
        • Data Table on Market opportunity by End-user ($ million)

      10 Market Segmentation by Material

      • 10.1 Market segments
        • Chart on Material - Market share 2024-2029 (%)
        • Data Table on Material - Market share 2024-2029 (%)
      • 10.2 Comparison by Material
        • Chart on Comparison by Material
        • Data Table on Comparison by Material
      • 10.3 Polymer Matrix Composites - Market size and forecast 2024-2029
        • Chart on Polymer Matrix Composites - Market size and forecast 2024-2029 ($ million)
        • Data Table on Polymer Matrix Composites - Market size and forecast 2024-2029 ($ million)
        • Chart on Polymer Matrix Composites - Year-over-year growth 2024-2029 (%)
        • Data Table on Polymer Matrix Composites - Year-over-year growth 2024-2029 (%)
      • 10.4 Ceramic and carbon matrix composites - Market size and forecast 2024-2029
        • Chart on Ceramic and carbon matrix composites - Market size and forecast 2024-2029 ($ million)
        • Data Table on Ceramic and carbon matrix composites - Market size and forecast 2024-2029 ($ million)
        • Chart on Ceramic and carbon matrix composites - Year-over-year growth 2024-2029 (%)
        • Data Table on Ceramic and carbon matrix composites - Year-over-year growth 2024-2029 (%)
      • 10.5 Metal matrix composites - Market size and forecast 2024-2029
        • Chart on Metal matrix composites - Market size and forecast 2024-2029 ($ million)
        • Data Table on Metal matrix composites - Market size and forecast 2024-2029 ($ million)
        • Chart on Metal matrix composites - Year-over-year growth 2024-2029 (%)
        • Data Table on Metal matrix composites - Year-over-year growth 2024-2029 (%)
      • 10.6 Market opportunity by Material
        • Market opportunity by Material ($ million)
        • Data Table on Market opportunity by Material ($ million)

      11 Customer Landscape

      • 11.1 Customer landscape overview
        • Analysis of price sensitivity, lifecycle, customer purchase basket, adoption rates, and purchase criteria

      12 Geographic Landscape

      • 12.1 Geographic segmentation
        • Chart on Market share by geography 2024-2029 (%)
        • Data Table on Market share by geography 2024-2029 (%)
      • 12.2 Geographic comparison
        • Chart on Geographic comparison
        • Data Table on Geographic comparison
      • 12.3 North America - Market size and forecast 2024-2029
        • Chart on North America - Market size and forecast 2024-2029 ($ million)
        • Data Table on North America - Market size and forecast 2024-2029 ($ million)
        • Chart on North America - Year-over-year growth 2024-2029 (%)
        • Data Table on North America - Year-over-year growth 2024-2029 (%)
      • 12.4 Europe - Market size and forecast 2024-2029
        • Chart on Europe - Market size and forecast 2024-2029 ($ million)
        • Data Table on Europe - Market size and forecast 2024-2029 ($ million)
        • Chart on Europe - Year-over-year growth 2024-2029 (%)
        • Data Table on Europe - Year-over-year growth 2024-2029 (%)
      • 12.5 APAC - Market size and forecast 2024-2029
        • Chart on APAC - Market size and forecast 2024-2029 ($ million)
        • Data Table on APAC - Market size and forecast 2024-2029 ($ million)
        • Chart on APAC - Year-over-year growth 2024-2029 (%)
        • Data Table on APAC - Year-over-year growth 2024-2029 (%)
      • 12.6 South America - Market size and forecast 2024-2029
        • Chart on South America - Market size and forecast 2024-2029 ($ million)
        • Data Table on South America - Market size and forecast 2024-2029 ($ million)
        • Chart on South America - Year-over-year growth 2024-2029 (%)
        • Data Table on South America - Year-over-year growth 2024-2029 (%)
      • 12.7 Middle East and Africa - Market size and forecast 2024-2029
        • Chart on Middle East and Africa - Market size and forecast 2024-2029 ($ million)
        • Data Table on Middle East and Africa - Market size and forecast 2024-2029 ($ million)
        • Chart on Middle East and Africa - Year-over-year growth 2024-2029 (%)
        • Data Table on Middle East and Africa - Year-over-year growth 2024-2029 (%)
      • 12.8 US - Market size and forecast 2024-2029
        • Chart on US - Market size and forecast 2024-2029 ($ million)
        • Data Table on US - Market size and forecast 2024-2029 ($ million)
        • Chart on US - Year-over-year growth 2024-2029 (%)
        • Data Table on US - Year-over-year growth 2024-2029 (%)
      • 12.9 China - Market size and forecast 2024-2029
        • Chart on China - Market size and forecast 2024-2029 ($ million)
        • Data Table on China - Market size and forecast 2024-2029 ($ million)
        • Chart on China - Year-over-year growth 2024-2029 (%)
        • Data Table on China - Year-over-year growth 2024-2029 (%)
      • 12.10 Germany - Market size and forecast 2024-2029
        • Chart on Germany - Market size and forecast 2024-2029 ($ million)
        • Data Table on Germany - Market size and forecast 2024-2029 ($ million)
        • Chart on Germany - Year-over-year growth 2024-2029 (%)
        • Data Table on Germany - Year-over-year growth 2024-2029 (%)
      • 12.11 UK - Market size and forecast 2024-2029
        • Chart on UK - Market size and forecast 2024-2029 ($ million)
        • Data Table on UK - Market size and forecast 2024-2029 ($ million)
        • Chart on UK - Year-over-year growth 2024-2029 (%)
        • Data Table on UK - Year-over-year growth 2024-2029 (%)
      • 12.12 Japan - Market size and forecast 2024-2029
        • Chart on Japan - Market size and forecast 2024-2029 ($ million)
        • Data Table on Japan - Market size and forecast 2024-2029 ($ million)
        • Chart on Japan - Year-over-year growth 2024-2029 (%)
        • Data Table on Japan - Year-over-year growth 2024-2029 (%)
      • 12.13 France - Market size and forecast 2024-2029
        • Chart on France - Market size and forecast 2024-2029 ($ million)
        • Data Table on France - Market size and forecast 2024-2029 ($ million)
        • Chart on France - Year-over-year growth 2024-2029 (%)
        • Data Table on France - Year-over-year growth 2024-2029 (%)
      • 12.14 Brazil - Market size and forecast 2024-2029
        • Chart on Brazil - Market size and forecast 2024-2029 ($ million)
        • Data Table on Brazil - Market size and forecast 2024-2029 ($ million)
        • Chart on Brazil - Year-over-year growth 2024-2029 (%)
        • Data Table on Brazil - Year-over-year growth 2024-2029 (%)
      • 12.15 Canada - Market size and forecast 2024-2029
        • Chart on Canada - Market size and forecast 2024-2029 ($ million)
        • Data Table on Canada - Market size and forecast 2024-2029 ($ million)
        • Chart on Canada - Year-over-year growth 2024-2029 (%)
        • Data Table on Canada - Year-over-year growth 2024-2029 (%)
      • 12.16 India - Market size and forecast 2024-2029
        • Chart on India - Market size and forecast 2024-2029 ($ million)
        • Data Table on India - Market size and forecast 2024-2029 ($ million)
        • Chart on India - Year-over-year growth 2024-2029 (%)
        • Data Table on India - Year-over-year growth 2024-2029 (%)
      • 12.17 Italy - Market size and forecast 2024-2029
        • Chart on Italy - Market size and forecast 2024-2029 ($ million)
        • Data Table on Italy - Market size and forecast 2024-2029 ($ million)
        • Chart on Italy - Year-over-year growth 2024-2029 (%)
        • Data Table on Italy - Year-over-year growth 2024-2029 (%)
      • 12.18 Market opportunity by geography
        • Market opportunity by geography ($ million)
        • Data Tables on Market opportunity by geography ($ million)

      13 Drivers, Challenges, and Opportunity/Restraints

      • 13.1 Market drivers
        • 13.2 Market challenges
          • 13.3 Impact of drivers and challenges
            • Impact of drivers and challenges in 2024 and 2029
          • 13.4 Market opportunities/restraints

            14 Competitive Landscape

            • 14.1 Overview
              • 14.2 Competitive Landscape
                • Overview on criticality of inputs and factors of differentiation
              • 14.3 Landscape disruption
                • Overview on factors of disruption
              • 14.4 Industry risks
                • Impact of key risks on business

              15 Competitive Analysis

              • 15.1 Companies profiled
                • Companies covered
              • 15.2 Company ranking index
                • Company ranking index
              • 15.3 Market positioning of companies
                • Matrix on companies position and classification
              • 15.4 China Jushi Co. Ltd.
                • China Jushi Co. Ltd. - Overview
                • China Jushi Co. Ltd. - Product / Service
                • China Jushi Co. Ltd. - Key offerings
                • SWOT
              • 15.5 Compagnie de Saint Gobain SA
                • Compagnie de Saint Gobain SA - Overview
                • Compagnie de Saint Gobain SA - Business segments
                • Compagnie de Saint Gobain SA - Key news
                • Compagnie de Saint Gobain SA - Key offerings
                • Compagnie de Saint Gobain SA - Segment focus
                • SWOT
              • 15.6 DuPont de Nemours Inc.
                • DuPont de Nemours Inc. - Overview
                • DuPont de Nemours Inc. - Business segments
                • DuPont de Nemours Inc. - Key news
                • DuPont de Nemours Inc. - Key offerings
                • DuPont de Nemours Inc. - Segment focus
                • SWOT
              • 15.7 Gurit Holding AG
                • Gurit Holding AG - Overview
                • Gurit Holding AG - Business segments
                • Gurit Holding AG - Key offerings
                • Gurit Holding AG - Segment focus
                • SWOT
              • 15.8 Hexcel Corp.
                • Hexcel Corp. - Overview
                • Hexcel Corp. - Business segments
                • Hexcel Corp. - Key news
                • Hexcel Corp. - Key offerings
                • Hexcel Corp. - Segment focus
                • SWOT
              • 15.9 Huntsman Corp.
                • Huntsman Corp. - Overview
                • Huntsman Corp. - Business segments
                • Huntsman Corp. - Key news
                • Huntsman Corp. - Key offerings
                • Huntsman Corp. - Segment focus
                • SWOT
              • 15.10 Mitsubishi Chemical Corp.
                • Mitsubishi Chemical Corp. - Overview
                • Mitsubishi Chemical Corp. - Business segments
                • Mitsubishi Chemical Corp. - Key offerings
                • Mitsubishi Chemical Corp. - Segment focus
                • SWOT
              • 15.11 Momentive Performance Materials
                • Momentive Performance Materials - Overview
                • Momentive Performance Materials - Product / Service
                • Momentive Performance Materials - Key offerings
                • SWOT
              • 15.12 Nippon Electric Glass Co. Ltd.
                • Nippon Electric Glass Co. Ltd. - Overview
                • Nippon Electric Glass Co. Ltd. - Product / Service
                • Nippon Electric Glass Co. Ltd. - Key offerings
                • SWOT
              • 15.13 Owens Corning
                • Owens Corning - Overview
                • Owens Corning - Business segments
                • Owens Corning - Key news
                • Owens Corning - Key offerings
                • Owens Corning - Segment focus
                • SWOT
              • 15.14 SGL Carbon SE
                • SGL Carbon SE - Overview
                • SGL Carbon SE - Business segments
                • SGL Carbon SE - Key news
                • SGL Carbon SE - Key offerings
                • SGL Carbon SE - Segment focus
                • SWOT
              • 15.15 Solvay SA
                • Solvay SA - Overview
                • Solvay SA - Business segments
                • Solvay SA - Key news
                • Solvay SA - Key offerings
                • Solvay SA - Segment focus
                • SWOT
              • 15.16 Teijin Ltd.
                • Teijin Ltd. - Overview
                • Teijin Ltd. - Business segments
                • Teijin Ltd. - Key news
                • Teijin Ltd. - Key offerings
                • Teijin Ltd. - Segment focus
                • SWOT
              • 15.17 Toray Industries Inc.
                • Toray Industries Inc. - Overview
                • Toray Industries Inc. - Business segments
                • Toray Industries Inc. - Key news
                • Toray Industries Inc. - Key offerings
                • Toray Industries Inc. - Segment focus
                • SWOT
              • 15.18 Veplas dd
                • Veplas dd - Overview
                • Veplas dd - Product / Service
                • Veplas dd - Key offerings
                • SWOT

              16 Appendix

              • 16.1 Scope of the report
                • 16.2 Inclusions and exclusions checklist
                  • Inclusions checklist
                  • Exclusions checklist
                • 16.3 Currency conversion rates for US$
                  • Currency conversion rates for US$
                • 16.4 Research methodology
                  • Research methodology
                • 16.5 Data procurement
                  • Information sources
                • 16.6 Data validation
                  • Data validation
                • 16.7 Validation techniques employed for market sizing
                  • Validation techniques employed for market sizing
                • 16.8 Data synthesis
                  • Data synthesis
                • 16.9 360 degree market analysis
                  • 360 degree market analysis
                • 16.10 List of abbreviations
                  • List of abbreviations

                Research Methodology

                Technavio presents a detailed picture of the market by way of study, synthesis, and summation of data from multiple sources. The analysts have presented the various facets of the market with a particular focus on identifying the key industry influencers. The data thus presented is comprehensive, reliable, and the result of extensive research, both primary and secondary.

                INFORMATION SOURCES

                Primary sources

                • Manufacturers and suppliers
                • Channel partners
                • Industry experts
                • Strategic decision makers

                Secondary sources

                • Industry journals and periodicals
                • Government data
                • Financial reports of key industry players
                • Historical data
                • Press releases

                DATA ANALYSIS

                Data Synthesis

                • Collation of data
                • Estimation of key figures
                • Analysis of derived insights

                Data Validation

                • Triangulation with data models
                • Reference against proprietary databases
                • Corroboration with industry experts

                REPORT WRITING

                Qualitative

                • Market drivers
                • Market challenges
                • Market trends
                • Five forces analysis

                Quantitative

                • Market size and forecast
                • Market segmentation
                • Geographical insights
                • Competitive landscape

                Interested in this report?

                Get your sample now to see our research methodology and insights!

                Download Now

                Frequently Asked Questions

                Composite Materials market growth will increase by $ 37237.4 mn during 2025-2029 .

                The Composite Materials market is expected to grow at a CAGR of 11.3% during 2025-2029 .

                Composite Materials market is segmented by Type( Glass fiber, Carbon fiber, Aramid Fiber, Others) End-user( Electricals and electronics, Construction, Aerospace and defense, Others, MEA) Material( Polymer Matrix Composites, Ceramic and carbon matrix composites, Metal matrix composites, South America, Middle East and Africa)

                3M Co., Cabot Corp., China Jushi Co. Ltd., Compagnie de Saint Gobain SA, COMPOSITES UNIVERSAL GROUP, DuPont de Nemours Inc., Gurit Holding AG, Hexcel Corp., Huntsman Corp., Kineco Ltd., Mitsubishi Chemical Corp., Momentive Performance Materials, Nippon Electric Glass Co. Ltd., Owens Corning, Scott Bader Co. Ltd., SGL Carbon SE, Solvay SA, Teijin Ltd., Toray Industries Inc., Veplas dd are a few of the key vendors in the Composite Materials market.

                APAC will register the highest growth rate of 30% among the other regions. Therefore, the Composite Materials market in APAC is expected to garner significant business opportunities for the vendors during the forecast period.

                US, China, Germany, UK, Japan, France, Canada, Brazil, India, Italy

                • Rising demand for composite materials in transportation industryThe automotive segment is becoming increasingly obsessed with the consumption of carbon fibers is the driving factor this market.
                • which has increased significantly over the past years. This is attributed to benefits relating to the reduction of CO2 emissions is the driving factor this market.
                • lightweight construction is the driving factor this market.
                • and e-mobility. In the automotive industry is the driving factor this market.
                • composite materials have been highly preferred; their use has grown in recent years with the rapidly involving automotive sector and the demand to reduce vehicle weight to meet mileage standards with more safety. Currently is the driving factor this market.
                • composite materials are used for more than just body panels is the driving factor this market.
                • including car frames to rims is the driving factor this market.
                • springs is the driving factor this market.
                • and truck bed liners. In addition is the driving factor this market.
                • composite materials are damage-resistant is the driving factor this market.
                • thus providing more safety to the vehicle owner. These materials are corrosion-resistant is the driving factor this market.
                • thus offering longer durability to vehicles.Compared to thermoset-based materials is the driving factor this market.
                • composite materials offer the automotive industry key advantages such as zero-solvent emissions is the driving factor this market.
                • reduced material scrap is the driving factor this market.
                • improved work safety conditions is the driving factor this market.
                • elimination of painting steps (through the use of high-molecular-weight polymer surface films) is the driving factor this market.
                • elimination of tedious production steps via automation is the driving factor this market.
                • and finally improved recyclability. Furthermore is the driving factor this market.
                • thermoplastic composite materials offer excellent crash test performance compared with traditional steels.  While steel typically absorbs only 35J/kg of energy is the driving factor this market.
                • thermoset composites can absorb about twice this value is the driving factor this market.
                • and thermoplastics can absorb 7-8 times the energy of steel (C-PEEK = 230J/kg).In addition is the driving factor this market.
                • based on European directives and standards (2000/53/EC-End Life of Vehicles) is the driving factor this market.
                • the automotive industry is supposed to address many issues is the driving factor this market.
                • including:Environmentally friendly dismantling and recycling of vehiclesIncreased reuse is the driving factor this market.
                • recycling is the driving factor this market.
                • and recovery of vehicles and their componentsManufacture of new vehicles with enhanced recyclabilityThe need to comply with such regulations increases the potential of composite material application in automotive markets. This will drive the growth of the global composite materials market during the forecast period. is the driving factor this market.

                The Composite Materials market vendors should focus on grabbing business opportunities from the Glass fiber segment as it accounted for the largest market share in the base year.