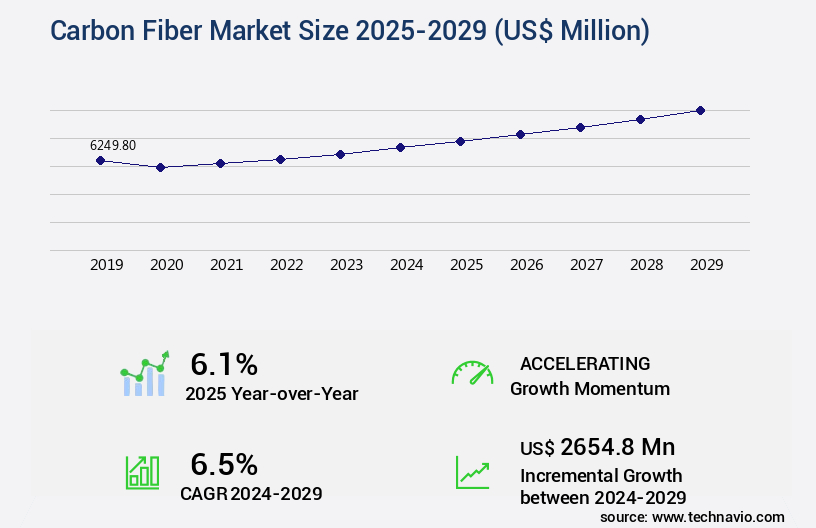
Carbon Fiber Market Size 2025-2029
The carbon fiber market size is valued to increase USD 2.65 billion, at a CAGR of 6.5% from 2024 to 2029. Increasing use of carbon fibers in aerospace and defense sector will drive the carbon fiber market.
Major Market Trends & Insights
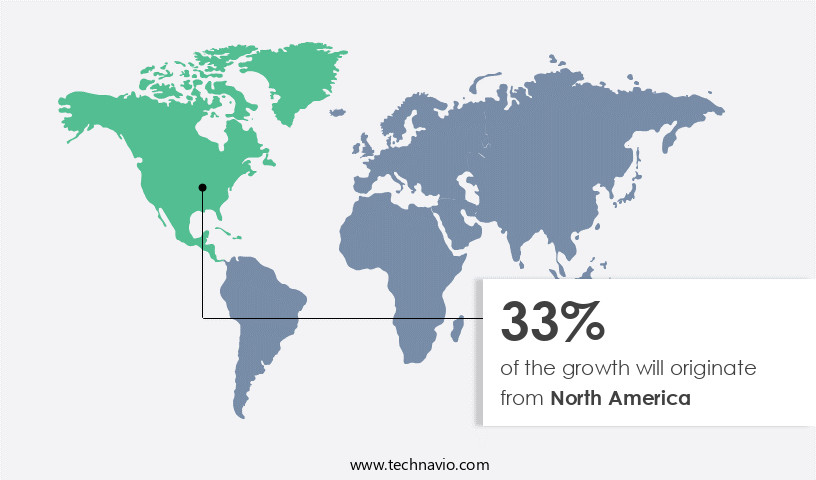
- North America dominated the market and accounted for a 33% growth during the forecast period.
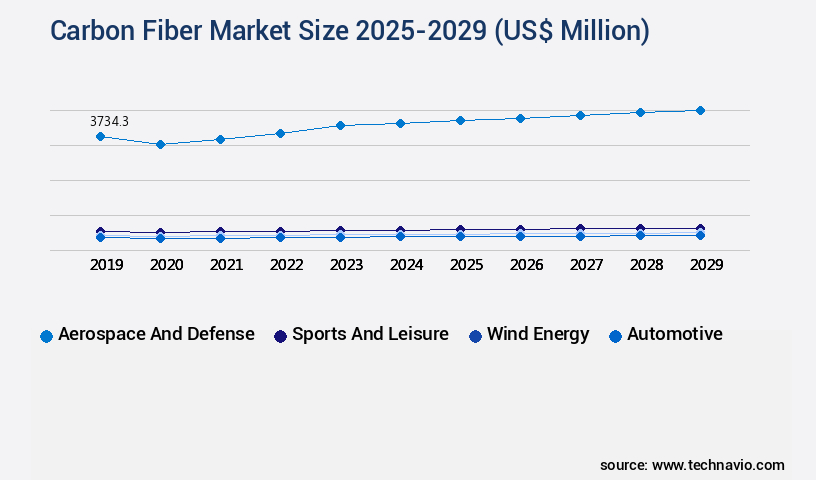
- By End-user - Aerospace and defense segment was valued at USD 3.73 billion in 2023
- By Raw Material - PAN-based segment accounted for the largest market revenue share in 2023
Market Size & Forecast
- Market Opportunities: USD 56.81 million
- Market Future Opportunities: USD 2654.80 million
- CAGR : 6.5%
- North America: Largest market in 2023
Market Summary
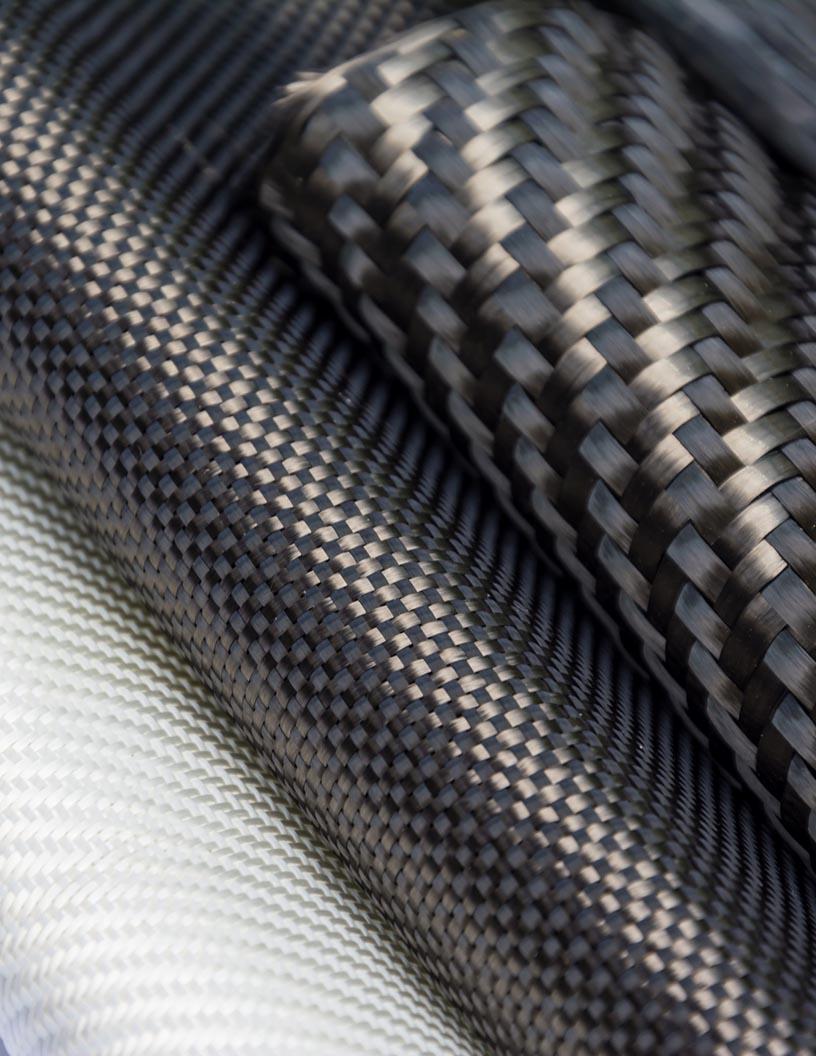
- The market represents a dynamic and continually evolving industry, characterized by advancements in core technologies and applications. With a growing focus on lightweight and strong materials, carbon fibers have gained significant traction, particularly in the aerospace and defense sector, which currently holds over 40% market share. This trend is driven by the increasing demand for fuel efficiency and improved performance in these industries.
- However, the market faces challenges from substitutes, such as aluminum and titanium. Moreover, the adoption of carbon fiber recycling technologies is gaining momentum, presenting opportunities for market growth. According to recent studies, the carbon fiber recycling market is projected to reach a value of 1.5 billion USD by 2026, reflecting the industry's ongoing evolution.
What will be the Size of the Carbon Fiber Market during the forecast period?
Get Key Insights on Market Forecast (PDF) Request Free Sample
How is the Carbon Fiber Market Segmented and what are the key trends of market segmentation?
The carbon fiber industry research report provides comprehensive data (region-wise segment analysis), with forecasts and estimates in "USD million" for the period 2025-2029, as well as historical data from 2019-2023 for the following segments.
- End-user
- Aerospace and defense
- Sports and leisure
- Wind energy
- Automotive
- Others
- Raw Material
- PAN-based
- Pitch-based
- Rayon-based
- Type
- Virgin Fiber (VCF)
- Recycled Carbon Fiber (RCF)
- Application
- Composite Materials
- Textiles
- Microelectrodes
- Catalysis
- Tow Size
- Small Tow
- Large Tow
- Geography
- North America
- US
- Canada
- Europe
- France
- Germany
- Italy
- UK
- Middle East and Africa
- Egypt
- KSA
- Oman
- UAE
- APAC
- China
- India
- Japan
- South America
- Argentina
- Brazil
- Rest of World (ROW)
- North America
By End-user Insights
The aerospace and defense segment is estimated to witness significant growth during the forecast period.
Carbon fiber's adoption in various industries, particularly in aerospace and defense, continues to expand due to its desirable properties. These include lightweight design principles, superior tensile strength, and exceptional corrosion and fatigue resistance. The high strength-to-weight ratio of carbon fiber makes it a preferred choice over metals like aluminum and titanium alloys. In the aerospace sector, carbon fiber significantly contributes to reducing the overall weight of aircraft, enhancing fuel efficiency and improving overall performance. Moreover, carbon fiber's thermal properties evaluation and fatigue life prediction are crucial for its application in high-performance structures. Reinforcement fiber types, such as carbon and glass, are subjected to rigorous testing, including surface treatment methods, fiber volume fraction, and composite material properties assessment.
Epoxy resin systems and microstructure characterization play a vital role in the manufacturing process. The industry anticipates a significant increase in demand for carbon fiber, with an estimated 20% growth in the automotive sector and a 15% surge in the wind energy market. Furthermore, the development of advanced composite structures, such as carbon nanotube composites and graphene-enhanced composites, is expected to revolutionize the market. Manufacturing processes, including the pultrusion process design, lamination process control, and stress-strain relationships analysis, are continually evolving to optimize production efficiency and enhance product quality. Mechanical testing standards, cure cycle optimization, and damage tolerance analysis are crucial in ensuring the durability and reliability of carbon fiber products.
Carbon fiber's versatility extends to various applications, from automotive components to sports equipment, and its demand is expected to grow steadily in the coming years. The industry's continuous innovation and evolution reflect the market's dynamic nature, making it an exciting and promising field for businesses and investors alike.
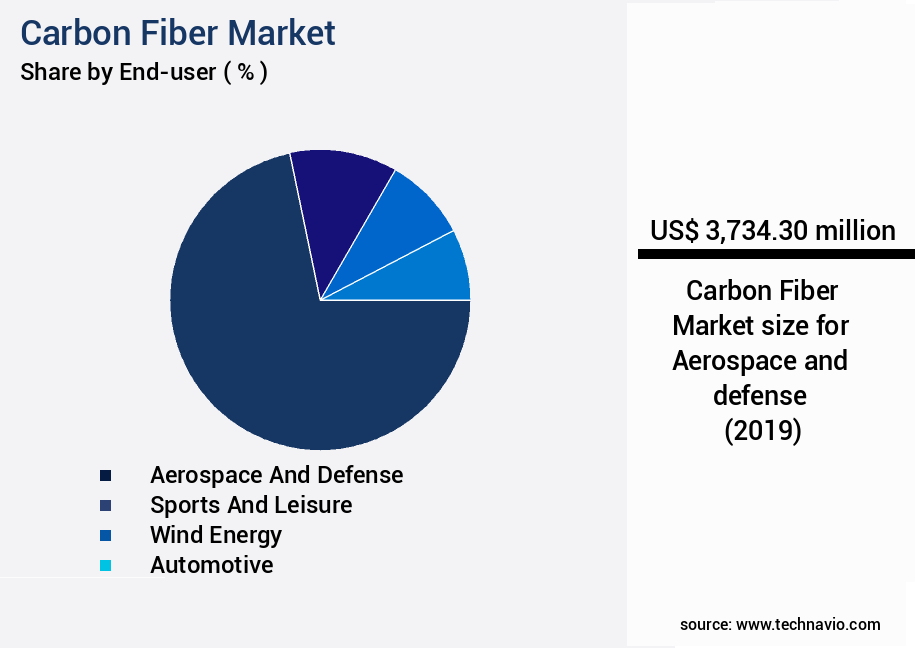
The Aerospace and defense segment was valued at USD 3.73 billion in 2019 and showed a gradual increase during the forecast period.
Regional Analysis
North America is estimated to contribute 33% to the growth of the global market during the forecast period.Technavio's analysts have elaborately explained the regional trends and drivers that shape the market during the forecast period.
See How Carbon Fiber Market Demand is Rising in North America Request Free Sample
The market in North America is driven by the high consumption of carbon fiber in industries such as aerospace, automotive, wind energy, and construction. With major players like Airbus and Boeing headquartered in the region, the aerospace sector is a significant contributor. The US and Canada lead the regional market, with the US government mandating lightweight vehicles to achieve Corporate Average Fuel Efficiency (CAFE) of 37 mpg by 2025. The automotive industry is adopting carbon fiber for weight reduction and improved fuel efficiency. Wind energy is another growing sector, with the increasing demand for lightweight and durable wind turbine blades.
The construction industry is also embracing carbon fiber for its strength and durability. According to recent studies, the North American the market is expected to reach 110,000 metric tons by 2025, growing at a rate of 6.5% per year. Additionally, the market for carbon fiber in the wind energy sector is projected to reach USD1.2 billion by 2026.
Market Dynamics
Our researchers analyzed the data with 2024 as the base year, along with the key drivers, trends, and challenges. A holistic analysis of drivers will help companies refine their marketing strategies to gain a competitive advantage.
The market encompasses the production and application of carbon fiber reinforced polymers (CFRP), a high-performance composite material. This market witnesses significant growth due to the superior properties of carbon fiber, including high strength-to-weight ratio, excellent thermal and electrical conductivity, and resistance to corrosion. Key factors driving market expansion include advancements in epoxy resin cure kinetics modeling, which optimize curing cycles for various carbon fiber tow architectures. These improvements enhance the fatigue crack growth rate prediction capabilities, ensuring the durability and reliability of carbon fiber components. Non-destructive inspection techniques play a crucial role in assessing composite material health, while composite material design software facilitates efficient pultrusion process optimization methods.
Autoclave curing cycle parameters and resin transfer molding simulation optimize manufacturing processes, reducing costs and increasing production efficiency. Filament winding tension control and braiding process geometric optimization further expand the application scope of carbon fiber in various industries. High temperature and cryogenic temperature composite behavior studies cater to the demands of diverse sectors, such as aerospace and automotive. Moisture absorption effects and UV degradation of composite materials are critical challenges addressed through innovative solutions. Composite material joining techniques, including advanced fiber reinforced polymers and nanomaterial reinforced composites, are gaining traction in the market. Structural health monitoring systems enable damage detection and localization, ensuring the safety and reliability of carbon fiber components.
Life cycle assessment of composites is a growing area of focus, as businesses seek to minimize environmental impact and maximize cost savings. In the market, the aerospace segment accounts for a significantly larger share compared to the automotive sector, with adoption rates nearly double. This trend is attributed to the high strength-to-weight ratio and durability of carbon fiber, making it an ideal choice for aircraft manufacturing. However, the automotive industry is rapidly catching up, with more than 30% of new vehicle models incorporating carbon fiber components.
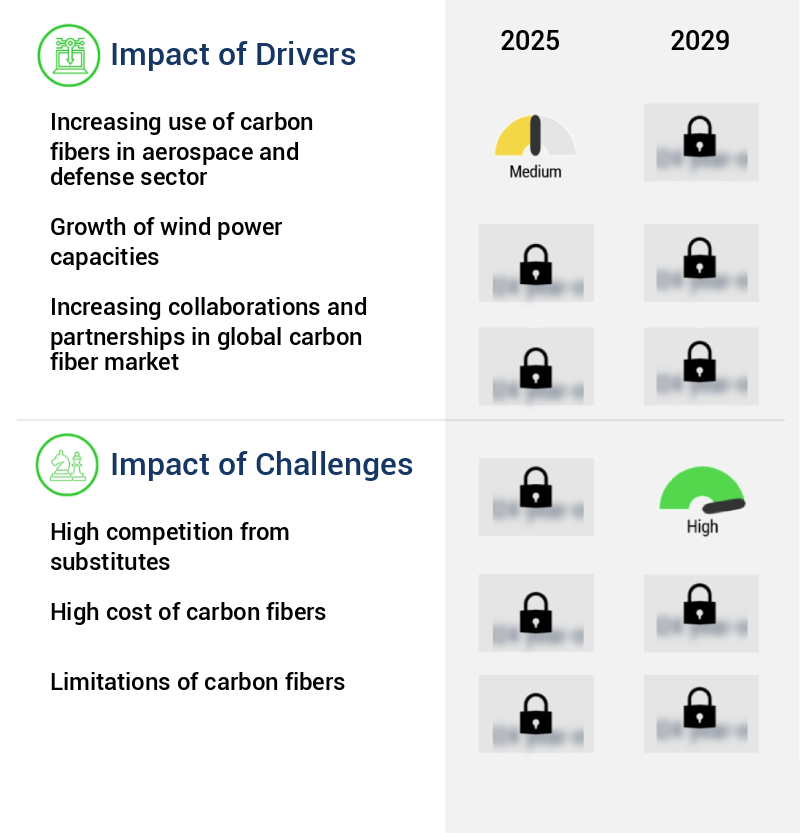
What are the key market drivers leading to the rise in the adoption of Carbon Fiber Industry?
- The aerospace and defense industry's growing reliance on carbon fibers serves as the primary market driver.
- Carbon fibers have become a significant component in the aerospace industry due to their exceptional properties, including high strength-to-weight ratio and excellent resistance to fatigue, abrasion, and corrosion. Major aircraft manufacturers, such as Boeing and Airbus, incorporate carbon fiber reinforced polymers (CFRP) into various aircraft components, including wings, rudders, fuselage, interior parts, doors, tail, and landing gears. The use of carbon fibers reduces the overall weight of aircraft by approximately 50%, contributing to increased fuel efficiency and reduced maintenance costs.
- Aircraft engineers focus on producing lightweight yet robust structures, making carbon fibers an indispensable material in the aerospace sector. The shift towards carbon fiber usage signifies a continuous evolution in aircraft manufacturing, with manufacturers striving to enhance aircraft performance and reduce operational expenses.
What are the market trends shaping the Carbon Fiber Industry?
- Advancements in carbon fiber recycling technologies are becoming a significant market trend. This innovation is set to revolutionize the industry.
- Carbon fiber recycling technologies are revolutionizing The market, as environmental concerns and regulatory pressures drive the need for increased sustainability and resource efficiency. Traditional carbon fiber manufacturing processes are energy-intensive and generate substantial waste. In response, innovative recycling methods, such as mechanical, thermal, and chemical processes, are gaining prominence. Among these, pyrolysis and solvolysis have emerged as effective solutions for recovering carbon fibers from end-of-life products and manufacturing scrap. Pyrolysis and solvolysis enable the breaking down of composite materials while retaining the structural integrity of recycled carbon fibers (RCF). RCF offers significant cost savings while maintaining suitable performance properties for non-structural and semi-structural applications in various industries, including automotive, consumer goods, and electronics.
- The automotive sector, in particular, is expected to lead the adoption of recycled carbon fibers due to the increasing demand for lightweight materials and the regulatory push towards reducing carbon emissions. Moreover, the recycling of carbon fibers not only addresses environmental concerns but also contributes to the circular economy by reducing waste and conserving resources. The ongoing advancements in carbon fiber recycling technologies are expected to create new opportunities and transform the market landscape.
What challenges does the Carbon Fiber Industry face during its growth?
- The intense competition posed by substitutes is a significant challenge impeding the industry's growth.
- Carbon fibers have a significant presence in various industries, including automotive, aerospace and defense, construction, and wind energy. However, substitutes like glass fiber, aluminum, copper, basalt fiber, and aramid fibers pose challenges to the market's expansion. Basalt fiber, derived from naturally occurring volcanic rocks, offers advantages such as superior thermal stability, high-temperature filtration, excellent acid and UV resistance, and high energy-electromagnetic radiation resistance. These properties make basalt fiber a preferred reinforcing material in construction and automotive industries. In contrast, natural fiber, another substitute, also finds applications in automotive and construction sectors.
- Despite the challenges, the market continues to evolve, with ongoing research and development efforts aimed at improving production efficiency and reducing costs. The market's dynamics remain influenced by factors such as technological advancements, regulatory frameworks, and economic conditions.
Exclusive Customer Landscape
The carbon fiber market forecasting report includes the adoption lifecycle of the market, covering from the innovator's stage to the laggard's stage. It focuses on adoption rates in different regions based on penetration. Furthermore, the carbon fiber market report also includes key purchase criteria and drivers of price sensitivity to help companies evaluate and develop their market growth analysis strategies.
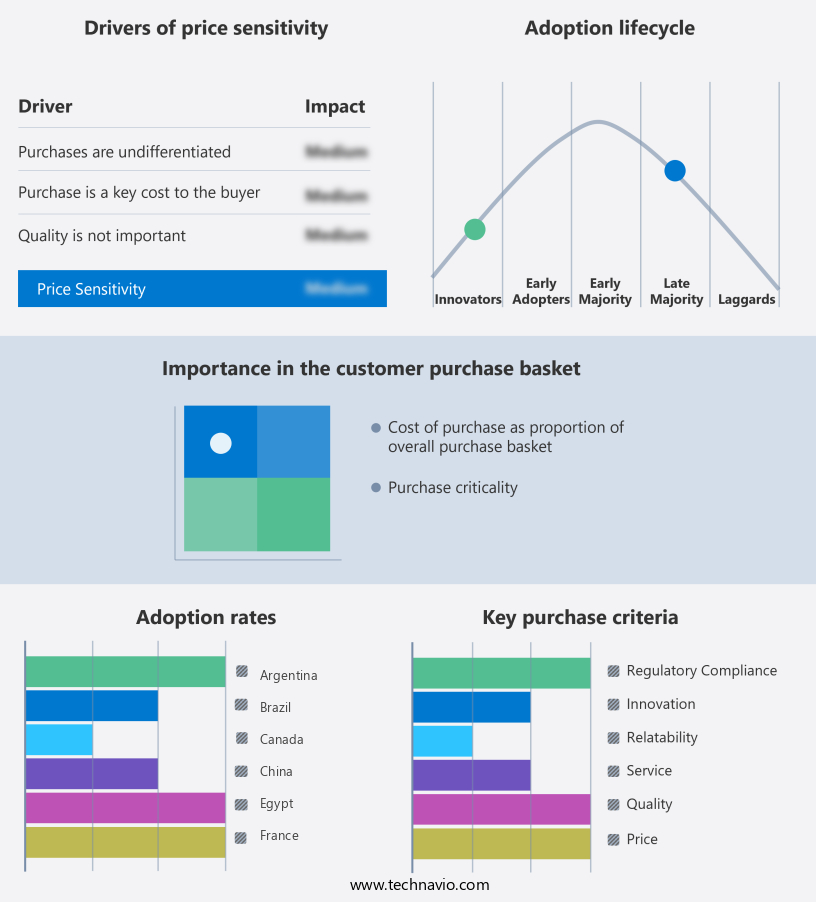
Customer Landscape of Carbon Fiber Industry
Competitive Landscape & Market Insights
Companies are implementing various strategies, such as strategic alliances, carbon fiber market forecast, partnerships, mergers and acquisitions, geographical expansion, and product/service launches, to enhance their presence in the industry.
DowAksa - This company specializes in the production and supply of high-performance carbon fiber materials, including SYT45-3K, SYT45S-12K, SYT49S-12K, SYT55-12K, and SYT49S-24K. These carbon fiber variants offer superior strength and lightweight properties, making them ideal for various industries requiring enhanced durability and efficiency. As a research analyst, I have observed the growing demand for such advanced materials in sectors like aerospace, automotive, and construction. The company's commitment to innovation and quality sets it apart in the competitive the market.
The industry research and growth report includes detailed analyses of the competitive landscape of the market and information about key companies, including:
- DowAksa
- Formosa Plastics
- Hexcel Corporation
- Hyosung Advanced Materials
- Jiangsu Hengshen
- Kureha Corporation
- Mitsubishi Chemical
- Nippon Graphite Fiber
- SGL Carbon
- Solvay
- Taekwang Industrial
- Teijin Limited
- Toho Tenax
- Toray Industries
- UHT Unitech
- Umatex
- Weihai Guangwei Composites
- Zhongfu Shenying
- Zoltek Companies
- Zyvex Technologies
Qualitative and quantitative analysis of companies has been conducted to help clients understand the wider business environment as well as the strengths and weaknesses of key industry players. Data is qualitatively analyzed to categorize companies as pure play, category-focused, industry-focused, and diversified; it is quantitatively analyzed to categorize companies as dominant, leading, strong, tentative, and weak.
Recent Development and News in Carbon Fiber Market
- In January 2024, Hexcel Corporation, a leading advanced composites company, announced the expansion of its carbon fiber production capacity by 50% at its facility in Wichita, Kansas. This strategic move aimed to meet the growing demand for lightweight and strong carbon fiber composites in various industries, including aerospace and automotive (Hexcel Corporation Press Release).
- In March 2024, Toray Industries, Inc., a major carbon fiber producer, formed a strategic partnership with Airbus to develop and supply carbon fiber reinforced plastic (CFRP) for the wings of the new Airbus A350 XWB aircraft. This collaboration marked a significant milestone in the aviation industry, as CFRP was increasingly being adopted for its fuel efficiency and weight reduction benefits (Airbus Press Release).
- In May 2024, Teijin Limited, a global chemical and fiber company, completed the acquisition of Tenax, a leading European carbon fiber manufacturer. This acquisition strengthened Teijin's position in the market, expanding its product portfolio and enhancing its presence in Europe (Teijin Limited Press Release).
- In April 2025, the European Union announced the approval of a €1.5 billion (USD1.7 billion) investment in the European Battery Alliance, which includes the development of carbon fiber batteries. This initiative aimed to reduce Europe's dependence on lithium-ion batteries and promote the use of carbon fiber batteries, which offer higher energy density and are more environmentally friendly (European Commission Press Release).
Dive into Technavio's robust research methodology, blending expert interviews, extensive data synthesis, and validated models for unparalleled Carbon Fiber Market insights. See full methodology.
|
Market Scope |
|
|
Report Coverage |
Details |
|
Page number |
214 |
|
Base year |
2024 |
|
Historic period |
2019-2023 |
|
Forecast period |
2025-2029 |
|
Growth momentum & CAGR |
Accelerate at a CAGR of 6.5% |
|
Market growth 2025-2029 |
USD 2654.8 million |
|
Market structure |
Fragmented |
|
YoY growth 2024-2025(%) |
6.1 |
|
Key countries |
US, Canada, Germany, UK, Italy, France, China, India, Japan, Brazil, Egypt, UAE, Oman, Argentina, KSA, UAE, Brazil, and Rest of World (ROW) |
|
Competitive landscape |
Leading Companies, Market Positioning of Companies, Competitive Strategies, and Industry Risks |
Research Analyst Overview
- Carbon fiber, a high-performance material renowned for its exceptional strength-to-weight ratio, continues to gain traction in various industries due to its versatility and advanced properties. This evolving market is characterized by ongoing research and development in several key areas. One significant focus is on non-destructive testing and fatigue life prediction, ensuring the durability and reliability of carbon fiber structures. Thermal properties evaluation is another crucial aspect, as understanding how carbon fiber behaves under different temperatures is essential for various applications. The market encompasses various reinforcement fiber types, each with unique characteristics. Lightweight design principles are a driving force behind the adoption of carbon fiber in industries such as aerospace and automotive.
- Surface treatment methods are also under exploration to enhance the performance of carbon fiber composites. Carbon fiber prepreg and the design of processes like pultrusion and filament winding are critical in optimizing composite material properties. Epoxy resin systems and microstructure characterization are integral to understanding the behavior of carbon fiber composites. Chemical resistance testing, creep behavior analysis, and damage tolerance analysis are essential to evaluating the performance of polymer matrix composites. Advanced composite structures, such as those incorporating carbon nanotubes and graphene, are also gaining attention for their enhanced properties. Mechanical testing standards and cure cycle optimization are crucial in ensuring consistent manufacturing processes.
- Braiding process parameters and lamination process control are other areas of ongoing research to improve the efficiency and quality of carbon fiber production. Stress-strain relationships and impact resistance testing are essential in understanding the performance of high-performance composites. Fiber orientation optimization and manufacturing defect detection are also vital in producing superior carbon fiber products. In summary, the market is a dynamic and evolving landscape, with ongoing research and development focusing on various aspects such as non-destructive testing, thermal properties evaluation, reinforcement fiber types, and manufacturing processes.
What are the Key Data Covered in this Carbon Fiber Market Research and Growth Report?
-
What is the expected growth of the Carbon Fiber Market between 2025 and 2029?
-
USD 2.65 billion, at a CAGR of 6.5%
-
-
What segmentation does the market report cover?
-
The report segmented by End-user (Aerospace and defense, Sports and leisure, Wind energy, Automotive, and Others), Raw Material (PAN-based, Pitch-based, and Rayon-based), Geography (North America, Europe, APAC, South America, and Middle East and Africa), Type (Virgin Fiber (VCF) and Recycled Carbon Fiber (RCF)), Application (Composite Materials, Textiles, Microelectrodes, and Catalysis), and Tow Size (Small Tow and Large Tow)
-
-
Which regions are analyzed in the report?
-
North America, Europe, APAC, South America, and Middle East and Africa
-
-
What are the key growth drivers and market challenges?
-
Increasing use of carbon fibers in aerospace and defense sector, High competition from substitutes
-
-
Who are the major players in the Carbon Fiber Market?
-
Key Companies DowAksa, Formosa Plastics, Hexcel Corporation, Hyosung Advanced Materials, Jiangsu Hengshen, Kureha Corporation, Mitsubishi Chemical, Nippon Graphite Fiber, SGL Carbon, Solvay, Taekwang Industrial, Teijin Limited, Toho Tenax, Toray Industries, UHT Unitech, Umatex, Weihai Guangwei Composites, Zhongfu Shenying, Zoltek Companies, and Zyvex Technologies
-
Market Research Insights
- The market encompasses the production and application of carbon fiber reinforced polymers (CFRPs), a high-performance material class known for its exceptional strength-to-weight ratio and versatility. The market is projected to reach a value of USD15.6 billion by 2025, representing a compound annual growth rate (CAGR) of 11.1% between 2020 and 2025. This growth is driven by the increasing adoption of carbon fiber in various industries, including aerospace, automotive, and wind energy. Carbon fiber's superior mechanical properties, such as its high modulus of elasticity (720 GPa) and low Poisson's ratio (0.33), make it an attractive alternative to traditional materials like steel and aluminum.
- For instance, a car made with carbon fiber weighs approximately 750 kg less than its steel counterpart, reducing fuel consumption and increasing overall performance. In the aerospace sector, the use of carbon fiber has led to a 20% reduction in fuel consumption per passenger kilometer. These advancements are attributed to continuous process optimization strategies, such as finite element analysis, and performance enhancement methods like stiffness optimization and compressive strength testing. The market's focus on durability and reliability, cost-effective manufacturing, and design for manufacturing further propels its growth.
We can help! Our analysts can customize this carbon fiber market research report to meet your requirements.
 RIA -
RIA - 
