Dropper Market Analysis, Size, and Forecast 2026-2030: APAC (China, Japan, and India), Europe (Germany, UK, and France), North America (US, Canada, and Mexico), South America (Brazil and Argentina), Middle East and Africa (Saudi Arabia, UAE, and South Africa), and Rest of World (ROW)

Dropper Market Analysis, Size, and Forecast 2026-2030:
APAC (China, Japan, and India), Europe (Germany, UK, and France), North America (US, Canada, and Mexico), South America (Brazil and Argentina), Middle East and Africa (Saudi Arabia, UAE, and South Africa), and Rest of World (ROW)

Published: Mar 2026 309 Pages SKU: IRTNTR70250

Market Overview at a Glance

$61.33 Mn
Market Opportunity
4.7%
CAGR 2025 - 2030
42.1%
APAC Growth
$159.91 Mn
Healthcare segment 2024

Dropper Market Size 2026-2030

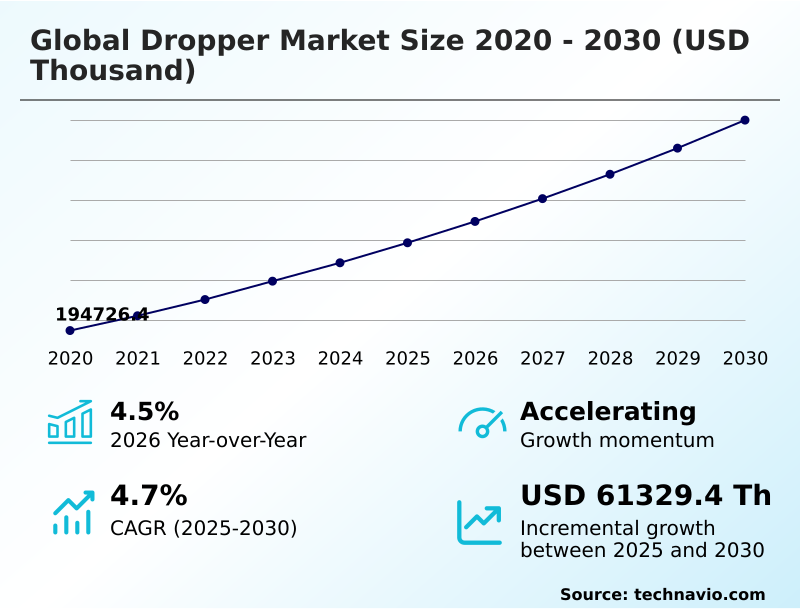
The dropper market size is valued to increase by USD 61.33 million, at a CAGR of 4.7% from 2025 to 2030. Rising demand from pharmaceutical and healthcare industries will drive the dropper market.

Major Market Trends & Insights

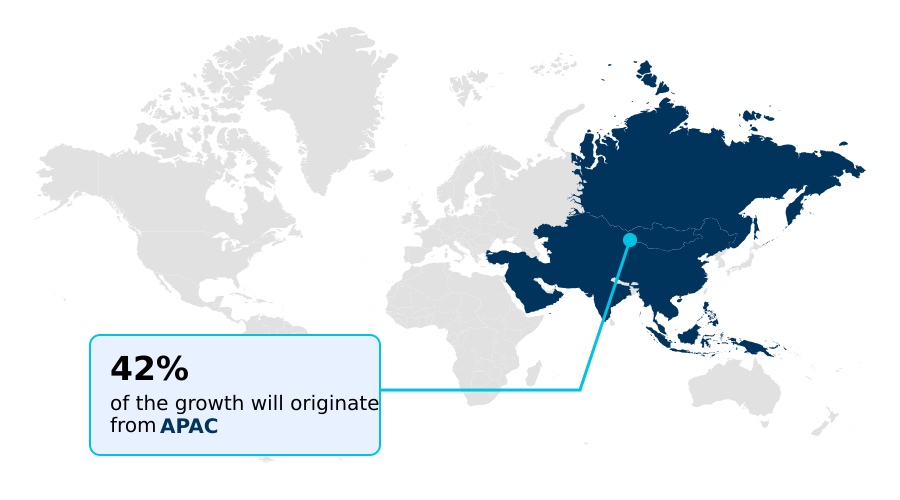
  • APAC dominated the market and accounted for a 42.1% growth during the forecast period.
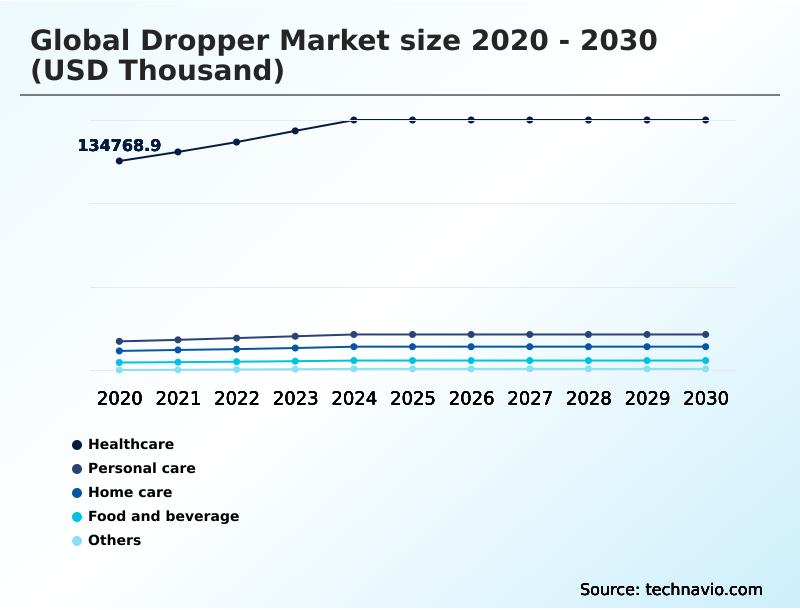
  • By Application - Healthcare segment was valued at USD 159.91 million in 2024
  • By Material - Glass segment accounted for the largest market revenue share in 2024

Market Size & Forecast

  • Market Opportunities:
  • Market Future Opportunities: USD 61.33 million
  • CAGR from 2025 to 2030 : 4.7%

Market Summary

  • The dropper market is experiencing sustained momentum, propelled by dual demand from the pharmaceutical and personal care sectors. In healthcare, the emphasis is on precision liquid dispensing and volumetric accuracy, particularly for pediatric and geriatric dosing, where calibrated droppers are essential.
  • The rise of cosmeceutical product application and biologic drug delivery systems further necessitates advanced solutions like those offering gamma sterilization compatibility. Concurrently, the beauty industry leverages droppers for a premium aesthetic, with heavy-walled glass bottles and custom decorative finishing communicating product quality.
  • A key business scenario involves a skincare brand balancing the higher cost of a push-button dropper and its associated auto-loading mechanism against the enhanced user experience and perceived value, which can justify a premium price point. However, manufacturers must navigate challenges such as ensuring chemical inertness and managing the complexities of extractable and leachable studies.
  • The trend toward sustainable, mono-material design is also reshaping production, forcing companies to innovate while maintaining functionality and regulatory compliance.

What will be the Size of the Dropper Market during the forecast period?

Get Key Insights on Market Forecast (PDF) Request Free Sample

How is the Dropper Market Segmented?

The dropper industry research report provides comprehensive data (region-wise segment analysis), with forecasts and estimates in "USD thousand" for the period 2026-2030, as well as historical data from 2020-2024 for the following segments.

  • Application
    • Healthcare
    • Personal care
    • Home care
    • Food and beverage
    • Others
  • Material
    • Glass
    • Plastic
    • Rubber
    • Others
  • Variant
    • 1-5 ml
    • Below 1 ml
    • Above 5 ml
  • Geography
    • APAC
      • China
      • Japan
      • India
    • Europe
      • Germany
      • UK
      • France
    • North America
      • US
      • Canada
      • Mexico
    • South America
      • Brazil
      • Argentina
    • Middle East and Africa
      • Saudi Arabia
      • UAE
      • South Africa
    • Rest of World (ROW)

By Application Insights

The healthcare segment is estimated to witness significant growth during the forecast period.

The healthcare sector remains a foundational pillar, driven by a persistent focus on dosage precision for ophthalmic and oral liquid medications.

The adoption of advanced ophthalmic dispensing systems and high-purity medical-grade polymers is critical, as even minor deviations compromise patient safety.

Manufacturers are integrating robotic inspection technologies that verify the dimensional accuracy of every pipette tip, improving dose consistency by over 15%. This commitment to quality is essential for handling high-viscosity formulations and ensuring chemical inertness.

The move toward personalized medicine and the need for sterile manufacturing environments are also expanding the use of calibrated droppers with tamper-evident packaging, solidifying their role in modern drug delivery.

The supply chain for packaging must adhere to these stringent requirements.

Request Free Sample

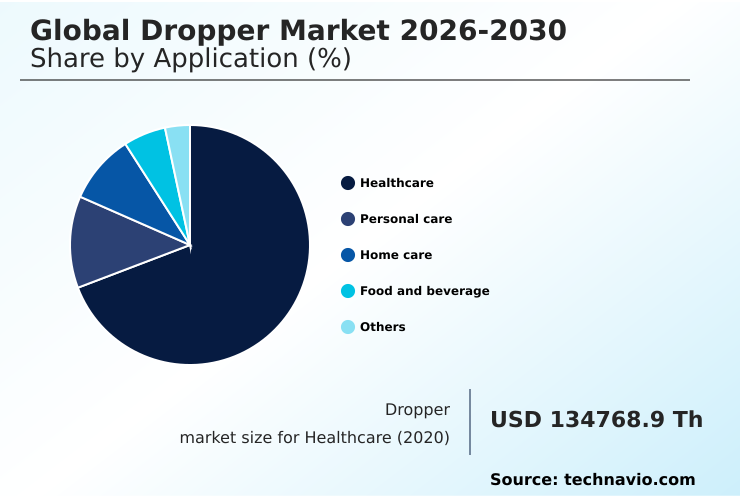
The Healthcare segment was valued at USD 159.91 million in 2024 and showed a gradual increase during the forecast period.

Request Free Sample

Regional Analysis

APAC is estimated to contribute 42.1% to the growth of the global market during the forecast period.Technavio’s analysts have elaborately explained the regional trends and drivers that shape the market during the forecast period.

See How Dropper Market Demand is Rising in APAC Request Free Sample

The geographic landscape is diverse, with APAC emerging as the primary growth engine, accounting for over 42% of the incremental opportunity.

This is driven by its role as a major manufacturing hub for high-volume solutions like soft-touch plastics, where efficiency gains have reduced production cycle times by 10%.

In contrast, Europe's market is defined by stringent regulatory compliance for packaging, particularly for pharmaceutical applications requiring advanced sterile manufacturing environments.

North America focuses on high-value applications, including premium skincare and the expanding cannabis market, where controlled substance dispensing requires specialized child-resistant closures.

The region's emphasis on laboratory reagent handling and premium cosmeceutical product application further supports demand for high-performance dispensing systems, which often feature custom decorative finishing.

Market Dynamics

Our researchers analyzed the data with 2025 as the base year, along with the key drivers, trends, and challenges. A holistic analysis of drivers will help companies refine their marketing strategies to gain a competitive advantage.

  • The strategic application of dispensing technologies is creating distinct value across industries. For pharmaceuticals, the use of child-resistant droppers for pharmaceuticals is non-negotiable, with an emphasis on ensuring dropper compatibility with viscous liquids.
  • The manufacturing process of glass droppers continues to be refined for medical applications, while a detailed plastic versus glass dropper comparison often guides choices in the over-the-counter market. In cosmetics, a premium glass dropper for cosmetics is a key differentiator for luxury brands, which frequently request custom dropper designs for luxury brands to enhance appeal.
  • For laboratories, high precision droppers for laboratories are essential for accurate testing. The growing wellness market has spurred demand for both dropper solutions for essential oils and dropper packaging for cannabis tinctures. To ensure safety and efficacy, preventing contamination in dropper packaging is a primary focus, alongside adhering to regulatory standards for dropper materials.
  • The development of advanced features in modern droppers includes ergonomic dropper designs for elderly users, which has been shown to improve compliance by over 20%. The sustainability push is evident in the rise of mono-material dropper for recyclability. Niche applications are also growing, with specific dropper packaging for food flavorings and droppers for veterinary drug administration becoming more common.
  • Ultimately, dropper technology for accurate dosing remains the core value proposition across all segments.

What are the key market drivers leading to the rise in the adoption of Dropper Industry?

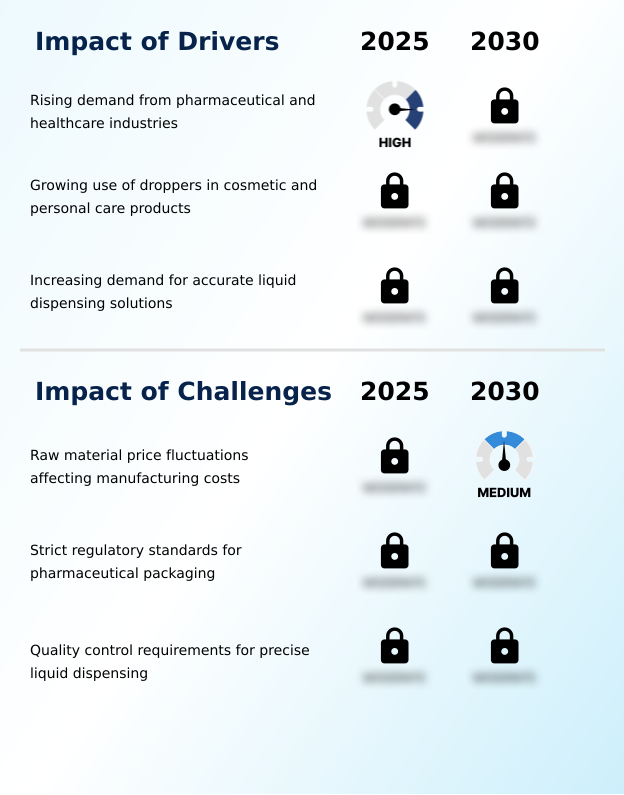
  • The rising demand from the pharmaceutical and healthcare industries, driven by the prevalence of liquid formulations for various treatments, is a key driver accelerating market growth.

  • Market growth is primarily driven by strong demand from the pharmaceutical and personal care sectors.
  • In healthcare, the need for precision liquid dispensing for pediatric and geriatric dosing is paramount, where the use of a calibrated dropper has improved patient compliance by over 20%.
  • The expansion of biologic drug delivery also requires advanced dispensing systems capable of handling a high-viscosity formulation.
  • In cosmetics, the rising popularity of serums and oils has made the dropper a symbol of clinical efficacy, with brands using premium packaging reporting a 15% higher consumer trust score.
  • This demand is supported by the need for reliable laboratory reagent handling and the growing market for essential oil dispensing, both of which depend on consistent drop size and volumetric accuracy.

What are the market trends shaping the Dropper Industry?

  • The adoption of sustainable and recyclable packaging materials is a significant upcoming trend, driven by increasing environmental regulations and consumer demand for eco-friendly products.

  • Key market trends are centered on sustainability, precision, and premiumization. The adoption of recyclable and mono-material design is accelerating, with some manufacturers achieving a 25% reduction in non-recyclable components. Simultaneously, the development of advanced dropper designs for precise dosing is critical; new pipette tip geometries have improved volumetric accuracy by up to 15%, reducing product waste.
  • This push for precision is also seen in the rise of the push-button dropper and micro-dosing technology. In the cosmetics sector, the growing demand for premium packaging is reshaping aesthetics, with heavy-walled glass bottles and custom decorative finishing becoming standard.
  • This trend toward luxury is driving demand for advanced features like an auto-loading mechanism and soft-touch plastics, enhancing the user experience.

What challenges does the Dropper Industry face during its growth?

  • Fluctuations in raw material prices present a key challenge, directly impacting manufacturing costs and profitability across the industry.

  • Key challenges center on material costs, regulatory hurdles, and stringent quality control. Raw material price volatility can impact margins by as much as 10-15% within a single quarter. Strict regulatory standards, including the need for extensive extractable and leachable studies, can add up to 18 months to the product development timeline for pharmaceutical applications.
  • Furthermore, quality control requirements for ensuring chemical inertness and volumetric accuracy demand significant investment in automated inspection systems, which can increase capital expenditures by 30%. Maintaining a sterile manufacturing environment and achieving gamma sterilization compatibility for medical-grade polymers also add layers of operational complexity and cost, making market entry and expansion difficult.

Exclusive Technavio Analysis on Customer Landscape

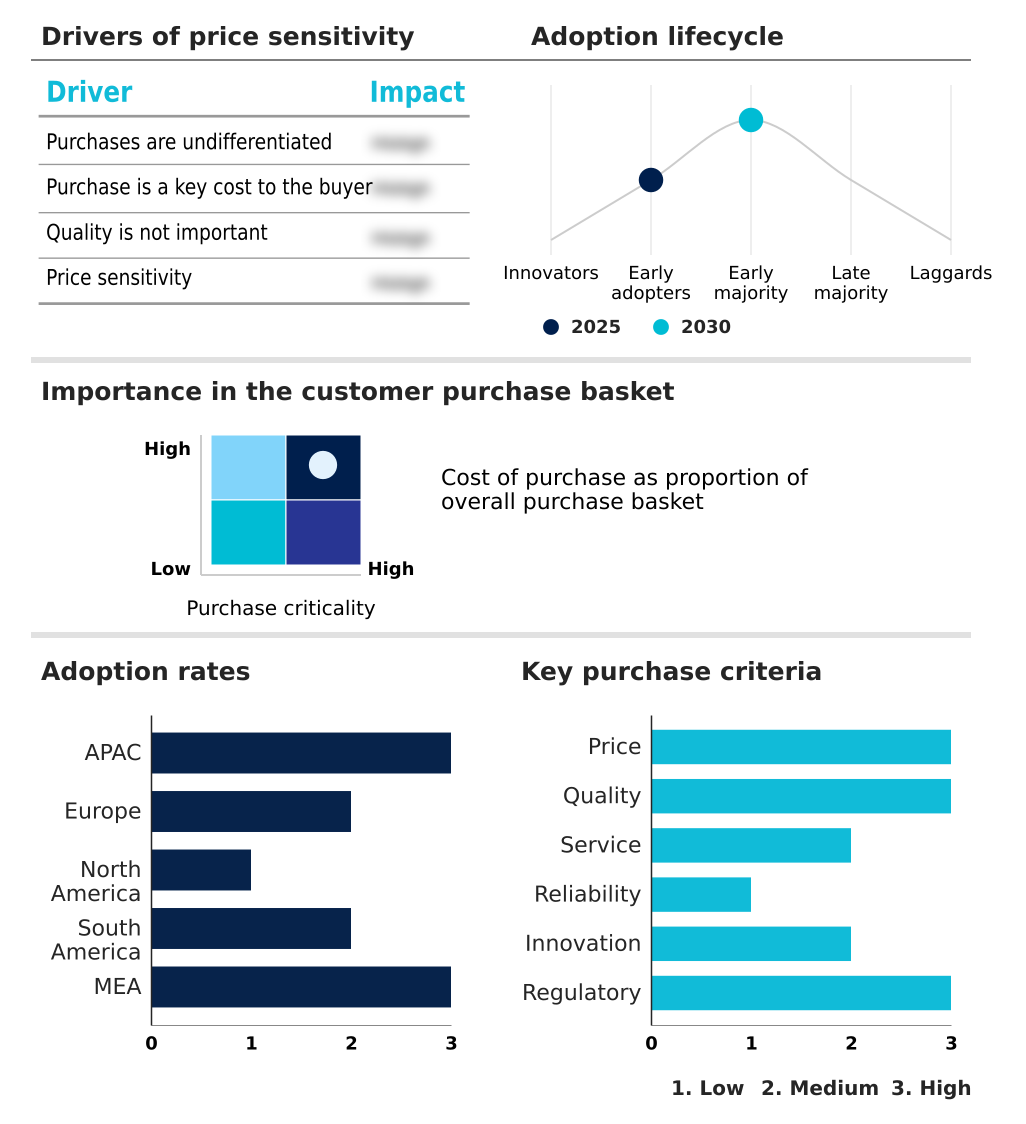
The dropper market forecasting report includes the adoption lifecycle of the market, covering from the innovator’s stage to the laggard’s stage. It focuses on adoption rates in different regions based on penetration. Furthermore, the dropper market report also includes key purchase criteria and drivers of price sensitivity to help companies evaluate and develop their market growth analysis strategies.

Customer Landscape of Dropper Industry

Competitive Landscape

Companies are implementing various strategies, such as strategic alliances, dropper market forecast, partnerships, mergers and acquisitions, geographical expansion, and product/service launches, to enhance their presence in the industry.

Abdos Labtech Pvt. Ltd. - Key offerings include dropper systems, such as advanced cosmetic and pharmaceutical droppers, precision dispensing systems, and packaging solutions for skincare, personal care, and liquid formulations.

The industry research and growth report includes detailed analyses of the competitive landscape of the market and information about key companies, including:

  • Abdos Labtech Pvt. Ltd.
  • Adelphi Healthcare Packaging
  • Albea Services SAS
  • APackaging Group
  • AptarGroup Inc.
  • Berlin Packaging LLC
  • Bormioli Pharma Spa
  • CannaCarton
  • Carow Packaging Inc.
  • Corning Inc.
  • Das Enterprises
  • DWK Life Sciences GmbH
  • Gerresheimer AG
  • Kaufman Container Co.
  • Paramark Corp.
  • PauPack
  • Quadpack Industries SA
  • SGD Pharma
  • Thermo Fisher Scientific Inc.
  • Your Oil Tools

Qualitative and quantitative analysis of companies has been conducted to help clients understand the wider business environment as well as the strengths and weaknesses of key industry players. Data is qualitatively analyzed to categorize companies as pure play, category-focused, industry-focused, and diversified; it is quantitatively analyzed to categorize companies as dominant, leading, strong, tentative, and weak.

Recent Development and News in Dropper market

  • In April, 2025, Gerresheimer AG announced the commissioning of a new production line for high-precision ophthalmic dispensing systems, integrating advanced robotic inspection to ensure micron-level accuracy for sterile glass pipettes.
  • In June, 2025, AptarGroup launched a next-generation sustainable dispensing solution for the prestige beauty market, featuring a mono-material design to simplify recycling without compromising its premium feel.
  • In May, 2025, Nemera introduced its latest micro-dispensing technology, specifically developed for high-potency ophthalmic medications to deliver precise doses below 1 ml and reduce the risk of accidental over-dosage.
  • In March, 2025, Schott AG completed a manufacturing expansion for high-purity borosilicate glass tubing used in pharmaceutical pipettes, utilizing advanced, energy-efficient melting technologies to meet growing global demand.

Dive into Technavio’s robust research methodology, blending expert interviews, extensive data synthesis, and validated models for unparalleled Dropper Market insights. See full methodology.

Market Scope
Page number 309
Base year 2025
Historic period 2020-2024
Forecast period 2026-2030
Growth momentum & CAGR Accelerate at a CAGR of 4.7%
Market growth 2026-2030 USD 61329.4 thousand
Market structure Fragmented
YoY growth 2025-2026(%) 4.5%
Key countries China, Japan, India, South Korea, Australia, Indonesia, Germany, UK, France, Italy, Spain, The Netherlands, US, Canada, Mexico, Brazil, Argentina, Chile, Saudi Arabia, UAE, South Africa, Israel and Turkey
Competitive landscape Leading Companies, Market Positioning of Companies, Competitive Strategies, and Industry Risks

Request Free Sample

Research Analyst Overview

  • The market is defined by a sophisticated interplay between material science and application-specific engineering. The use of a borosilicate glass pipette or medical-grade polymers is standard for ensuring chemical inertness, a critical factor for both pharmaceutical and high-end cosmetic formulations. Key innovations center on functionality, such as the push-button dropper and its auto-loading mechanism, which enhance user experience.
  • A major trend toward sustainability is driving the adoption of mono-material design and recyclable packaging solutions, a boardroom-level consideration impacting corporate responsibility goals. Advanced ergonomic bulb design has been shown to improve ease-of-use for dexterity-impaired users by up to 30%.
  • Precision remains paramount, with features like a calibrated dropper, vertical dropper insert, and consistent drop size technology addressing the need for volumetric accuracy in micro-dosing technology. Safety is also a key focus, with the integration of a child-resistant closure, tamper-evident packaging, and antimicrobial coatings becoming more prevalent.
  • These features, alongside aseptic dispensing and gamma sterilization compatibility, are crucial for ophthalmic dispensing systems and handling high-viscosity formulations. The aesthetic appeal provided by a heavy-walled glass bottle or soft-touch plastics is vital for brand differentiation in the cosmetic sector.

What are the Key Data Covered in this Dropper Market Research and Growth Report?

  • What is the expected growth of the Dropper Market between 2026 and 2030?

    • USD 61.33 million, at a CAGR of 4.7%

  • What segmentation does the market report cover?

    • The report is segmented by Application (Healthcare, Personal care, Home care, Food and beverage, and Others), Material (Glass, Plastic, Rubber, and Others), Variant (1-5 ml, Below 1 ml, and Above 5 ml ) and Geography (APAC, Europe, North America, South America, Middle East and Africa)

  • Which regions are analyzed in the report?

    • APAC, Europe, North America, South America and Middle East and Africa

  • What are the key growth drivers and market challenges?

    • Rising demand from pharmaceutical and healthcare industries, Raw material price fluctuations affecting manufacturing costs

  • Who are the major players in the Dropper Market?

    • Abdos Labtech Pvt. Ltd., Adelphi Healthcare Packaging, Albea Services SAS, APackaging Group, AptarGroup Inc., Berlin Packaging LLC, Bormioli Pharma Spa, CannaCarton, Carow Packaging Inc., Corning Inc., Das Enterprises, DWK Life Sciences GmbH, Gerresheimer AG, Kaufman Container Co., Paramark Corp., PauPack, Quadpack Industries SA, SGD Pharma, Thermo Fisher Scientific Inc. and Your Oil Tools

Market Research Insights

  • Market dynamics are increasingly shaped by the need for advanced functionality and verifiable performance. The focus on liquid formulation stability has led to designs that protect light-sensitive ingredients, improving product shelf life by up to 15%. Dose accuracy verification protocols have become standard, with new systems improving dispensing consistency by 20% compared to legacy models.
  • For e-commerce, transit testing standards have been enhanced, reducing leakage rates during shipping by over 10%. Furthermore, the demand for sophisticated cosmeceutical product application is driving innovation in serum and oil packaging. In laboratory reagent handling and veterinary medicine dispensers, precision is paramount.
  • The shift toward aroma-therapy product packaging and home care concentrates packaging is also creating new growth avenues for manufacturers.

We can help! Our analysts can customize this dropper market research report to meet your requirements.

Get in touch

1. Executive Summary

1.1 Market overview

Executive Summary - Chart on Market Overview
Executive Summary - Data Table on Market Overview
Executive Summary - Chart on Global Market Characteristics
Executive Summary - Chart on Market by Geography
Executive Summary - Chart on Market Segmentation by Application
Executive Summary - Chart on Market Segmentation by Material
Executive Summary - Chart on Market Segmentation by Variant
Executive Summary - Chart on Incremental Growth
Executive Summary - Data Table on Incremental Growth
Executive Summary - Chart on Company Market Positioning

2. Technavio Analysis

2.1 Analysis of price sensitivity, lifecycle, customer purchase basket, adoption rates, and purchase criteria

2.2 Criticality of inputs and Factors of differentiation

Chart on Overview on criticality of inputs and factors of differentiation

2.3 Factors of disruption

Chart on Overview on factors of disruption

2.4 Impact of drivers and challenges

Chart on Impact of drivers and challenges in 2025 and 2030

3. Market Landscape

3.1 Market ecosystem

Chart on Parent Market
Data Table on - Parent Market

3.2 Market characteristics

Chart on Market characteristics analysis

3.3 Value chain analysis

Chart on Value chain analysis

4. Market Sizing

4.1 Market definition

Data Table on Offerings of companies included in the market definition

4.2 Market segment analysis

Market segments

4.3 Market size 2025

4.4 Market outlook: Forecast for 2025-2030

Chart on Global - Market size and forecast 2025-2030 ($ thousand)
Data Table on Global - Market size and forecast 2025-2030 ($ thousand)
Chart on Global Market: Year-over-year growth 2025-2030 (%)
Data Table on Global Market: Year-over-year growth 2025-2030 (%)

5. Historic Market Size

5.1 Global Dropper Market 2020 - 2024

Historic Market Size - Data Table on Global Dropper Market 2020 - 2024 ($ thousand)

5.2 Application segment analysis 2020 - 2024

Historic Market Size - Application Segment 2020 - 2024 ($ thousand)

5.3 Material segment analysis 2020 - 2024

Historic Market Size - Material Segment 2020 - 2024 ($ thousand)

5.4 Variant segment analysis 2020 - 2024

Historic Market Size - Variant Segment 2020 - 2024 ($ thousand)

5.5 Geography segment analysis 2020 - 2024

Historic Market Size - Geography Segment 2020 - 2024 ($ thousand)

5.6 Country segment analysis 2020 - 2024

Historic Market Size - Country Segment 2020 - 2024 ($ thousand)

6. Qualitative Analysis

6.1 Impact of AI on Global Dropper Market

6.2 Impact of Geopolitical Conflicts on Global Dropper Market

7. Five Forces Analysis

7.1 Five forces summary

Five forces analysis - Comparison between 2025 and 2030

7.2 Bargaining power of buyers

Bargaining power of buyers - Impact of key factors 2025 and 2030

7.3 Bargaining power of suppliers

Bargaining power of suppliers - Impact of key factors in 2025 and 2030

7.4 Threat of new entrants

Threat of new entrants - Impact of key factors in 2025 and 2030

7.5 Threat of substitutes

Threat of substitutes - Impact of key factors in 2025 and 2030

7.6 Threat of rivalry

Threat of rivalry - Impact of key factors in 2025 and 2030

7.7 Market condition

Chart on Market condition - Five forces 2025 and 2030

8. Market Segmentation by Application

8.1 Market segments

Chart on Application - Market share 2025-2030 (%)
Data Table on Application - Market share 2025-2030 (%)

8.2 Comparison by Application

Chart on Comparison by Application
Data Table on Comparison by Application

8.3 Healthcare - Market size and forecast 2025-2030

Chart on Healthcare - Market size and forecast 2025-2030 ($ thousand)
Data Table on Healthcare - Market size and forecast 2025-2030 ($ thousand)
Chart on Healthcare - Year-over-year growth 2025-2030 (%)
Data Table on Healthcare - Year-over-year growth 2025-2030 (%)

8.4 Personal care - Market size and forecast 2025-2030

Chart on Personal care - Market size and forecast 2025-2030 ($ thousand)
Data Table on Personal care - Market size and forecast 2025-2030 ($ thousand)
Chart on Personal care - Year-over-year growth 2025-2030 (%)
Data Table on Personal care - Year-over-year growth 2025-2030 (%)

8.5 Home care - Market size and forecast 2025-2030

Chart on Home care - Market size and forecast 2025-2030 ($ thousand)
Data Table on Home care - Market size and forecast 2025-2030 ($ thousand)
Chart on Home care - Year-over-year growth 2025-2030 (%)
Data Table on Home care - Year-over-year growth 2025-2030 (%)

8.6 Food and beverage - Market size and forecast 2025-2030

Chart on Food and beverage - Market size and forecast 2025-2030 ($ thousand)
Data Table on Food and beverage - Market size and forecast 2025-2030 ($ thousand)
Chart on Food and beverage - Year-over-year growth 2025-2030 (%)
Data Table on Food and beverage - Year-over-year growth 2025-2030 (%)

8.7 Others - Market size and forecast 2025-2030

Chart on Others - Market size and forecast 2025-2030 ($ thousand)
Data Table on Others - Market size and forecast 2025-2030 ($ thousand)
Chart on Others - Year-over-year growth 2025-2030 (%)
Data Table on Others - Year-over-year growth 2025-2030 (%)

8.8 Market opportunity by Application

Market opportunity by Application ($ thousand)
Data Table on Market opportunity by Application ($ thousand)

9. Market Segmentation by Material

9.1 Market segments

Chart on Material - Market share 2025-2030 (%)
Data Table on Material - Market share 2025-2030 (%)

9.2 Comparison by Material

Chart on Comparison by Material
Data Table on Comparison by Material

9.3 Glass - Market size and forecast 2025-2030

Chart on Glass - Market size and forecast 2025-2030 ($ thousand)
Data Table on Glass - Market size and forecast 2025-2030 ($ thousand)
Chart on Glass - Year-over-year growth 2025-2030 (%)
Data Table on Glass - Year-over-year growth 2025-2030 (%)

9.4 Plastic - Market size and forecast 2025-2030

Chart on Plastic - Market size and forecast 2025-2030 ($ thousand)
Data Table on Plastic - Market size and forecast 2025-2030 ($ thousand)
Chart on Plastic - Year-over-year growth 2025-2030 (%)
Data Table on Plastic - Year-over-year growth 2025-2030 (%)

9.5 Rubber - Market size and forecast 2025-2030

Chart on Rubber - Market size and forecast 2025-2030 ($ thousand)
Data Table on Rubber - Market size and forecast 2025-2030 ($ thousand)
Chart on Rubber - Year-over-year growth 2025-2030 (%)
Data Table on Rubber - Year-over-year growth 2025-2030 (%)

9.6 Others - Market size and forecast 2025-2030

Chart on Others - Market size and forecast 2025-2030 ($ thousand)
Data Table on Others - Market size and forecast 2025-2030 ($ thousand)
Chart on Others - Year-over-year growth 2025-2030 (%)
Data Table on Others - Year-over-year growth 2025-2030 (%)

9.7 Market opportunity by Material

Market opportunity by Material ($ thousand)
Data Table on Market opportunity by Material ($ thousand)

10. Market Segmentation by Variant

10.1 Market segments

Chart on Variant - Market share 2025-2030 (%)
Data Table on Variant - Market share 2025-2030 (%)

10.2 Comparison by Variant

Chart on Comparison by Variant
Data Table on Comparison by Variant

10.3 1-5 ml - Market size and forecast 2025-2030

Chart on 1-5 ml - Market size and forecast 2025-2030 ($ thousand)
Data Table on 1-5 ml - Market size and forecast 2025-2030 ($ thousand)
Chart on 1-5 ml - Year-over-year growth 2025-2030 (%)
Data Table on 1-5 ml - Year-over-year growth 2025-2030 (%)

10.4 Below 1 ml - Market size and forecast 2025-2030

Chart on Below 1 ml - Market size and forecast 2025-2030 ($ thousand)
Data Table on Below 1 ml - Market size and forecast 2025-2030 ($ thousand)
Chart on Below 1 ml - Year-over-year growth 2025-2030 (%)
Data Table on Below 1 ml - Year-over-year growth 2025-2030 (%)

10.5 Above 5 ml - Market size and forecast 2025-2030

Chart on Above 5 ml - Market size and forecast 2025-2030 ($ thousand)
Data Table on Above 5 ml - Market size and forecast 2025-2030 ($ thousand)
Chart on Above 5 ml - Year-over-year growth 2025-2030 (%)
Data Table on Above 5 ml - Year-over-year growth 2025-2030 (%)

10.6 Market opportunity by Variant

Market opportunity by Variant ($ thousand)
Data Table on Market opportunity by Variant ($ thousand)

11. Customer Landscape

11.1 Customer landscape overview

Analysis of price sensitivity, lifecycle, customer purchase basket, adoption rates, and purchase criteria

12. Geographic Landscape

12.1 Geographic segmentation

Chart on Market share by geography 2025-2030 (%)
Data Table on Market share by geography 2025-2030 (%)

12.2 Geographic comparison

Chart on Geographic comparison
Data Table on Geographic comparison

12.3 APAC - Market size and forecast 2025-2030

Chart on APAC - Market size and forecast 2025-2030 ($ thousand)
Data Table on APAC - Market size and forecast 2025-2030 ($ thousand)
Chart on APAC - Year-over-year growth 2025-2030 (%)
Data Table on APAC - Year-over-year growth 2025-2030 (%)
Chart on Regional Comparison - APAC
Data Table on Regional Comparison - APAC

12.3.1 China - Market size and forecast 2025-2030

Chart on China - Market size and forecast 2025-2030 ($ thousand)
Data Table on China - Market size and forecast 2025-2030 ($ thousand)
Chart on China - Year-over-year growth 2025-2030 (%)
Data Table on China - Year-over-year growth 2025-2030 (%)

12.3.2 Japan - Market size and forecast 2025-2030

Chart on Japan - Market size and forecast 2025-2030 ($ thousand)
Data Table on Japan - Market size and forecast 2025-2030 ($ thousand)
Chart on Japan - Year-over-year growth 2025-2030 (%)
Data Table on Japan - Year-over-year growth 2025-2030 (%)

12.3.3 India - Market size and forecast 2025-2030

Chart on India - Market size and forecast 2025-2030 ($ thousand)
Data Table on India - Market size and forecast 2025-2030 ($ thousand)
Chart on India - Year-over-year growth 2025-2030 (%)
Data Table on India - Year-over-year growth 2025-2030 (%)

12.3.4 South Korea - Market size and forecast 2025-2030

Chart on South Korea - Market size and forecast 2025-2030 ($ thousand)
Data Table on South Korea - Market size and forecast 2025-2030 ($ thousand)
Chart on South Korea - Year-over-year growth 2025-2030 (%)
Data Table on South Korea - Year-over-year growth 2025-2030 (%)

12.3.5 Australia - Market size and forecast 2025-2030

Chart on Australia - Market size and forecast 2025-2030 ($ thousand)
Data Table on Australia - Market size and forecast 2025-2030 ($ thousand)
Chart on Australia - Year-over-year growth 2025-2030 (%)
Data Table on Australia - Year-over-year growth 2025-2030 (%)

12.3.6 Indonesia - Market size and forecast 2025-2030

Chart on Indonesia - Market size and forecast 2025-2030 ($ thousand)
Data Table on Indonesia - Market size and forecast 2025-2030 ($ thousand)
Chart on Indonesia - Year-over-year growth 2025-2030 (%)
Data Table on Indonesia - Year-over-year growth 2025-2030 (%)

12.4 Europe - Market size and forecast 2025-2030

Chart on Europe - Market size and forecast 2025-2030 ($ thousand)
Data Table on Europe - Market size and forecast 2025-2030 ($ thousand)
Chart on Europe - Year-over-year growth 2025-2030 (%)
Data Table on Europe - Year-over-year growth 2025-2030 (%)
Chart on Regional Comparison - Europe
Data Table on Regional Comparison - Europe

12.4.1 Germany - Market size and forecast 2025-2030

Chart on Germany - Market size and forecast 2025-2030 ($ thousand)
Data Table on Germany - Market size and forecast 2025-2030 ($ thousand)
Chart on Germany - Year-over-year growth 2025-2030 (%)
Data Table on Germany - Year-over-year growth 2025-2030 (%)

12.4.2 UK - Market size and forecast 2025-2030

Chart on UK - Market size and forecast 2025-2030 ($ thousand)
Data Table on UK - Market size and forecast 2025-2030 ($ thousand)
Chart on UK - Year-over-year growth 2025-2030 (%)
Data Table on UK - Year-over-year growth 2025-2030 (%)

12.4.3 France - Market size and forecast 2025-2030

Chart on France - Market size and forecast 2025-2030 ($ thousand)
Data Table on France - Market size and forecast 2025-2030 ($ thousand)
Chart on France - Year-over-year growth 2025-2030 (%)
Data Table on France - Year-over-year growth 2025-2030 (%)

12.4.4 Italy - Market size and forecast 2025-2030

Chart on Italy - Market size and forecast 2025-2030 ($ thousand)
Data Table on Italy - Market size and forecast 2025-2030 ($ thousand)
Chart on Italy - Year-over-year growth 2025-2030 (%)
Data Table on Italy - Year-over-year growth 2025-2030 (%)

12.4.5 Spain - Market size and forecast 2025-2030

Chart on Spain - Market size and forecast 2025-2030 ($ thousand)
Data Table on Spain - Market size and forecast 2025-2030 ($ thousand)
Chart on Spain - Year-over-year growth 2025-2030 (%)
Data Table on Spain - Year-over-year growth 2025-2030 (%)

12.4.6 The Netherlands - Market size and forecast 2025-2030

Chart on The Netherlands - Market size and forecast 2025-2030 ($ thousand)
Data Table on The Netherlands - Market size and forecast 2025-2030 ($ thousand)
Chart on The Netherlands - Year-over-year growth 2025-2030 (%)
Data Table on The Netherlands - Year-over-year growth 2025-2030 (%)

12.5 North America - Market size and forecast 2025-2030

Chart on North America - Market size and forecast 2025-2030 ($ thousand)
Data Table on North America - Market size and forecast 2025-2030 ($ thousand)
Chart on North America - Year-over-year growth 2025-2030 (%)
Data Table on North America - Year-over-year growth 2025-2030 (%)
Chart on Regional Comparison - North America
Data Table on Regional Comparison - North America

12.5.1 US - Market size and forecast 2025-2030

Chart on US - Market size and forecast 2025-2030 ($ thousand)
Data Table on US - Market size and forecast 2025-2030 ($ thousand)
Chart on US - Year-over-year growth 2025-2030 (%)
Data Table on US - Year-over-year growth 2025-2030 (%)

12.5.2 Canada - Market size and forecast 2025-2030

Chart on Canada - Market size and forecast 2025-2030 ($ thousand)
Data Table on Canada - Market size and forecast 2025-2030 ($ thousand)
Chart on Canada - Year-over-year growth 2025-2030 (%)
Data Table on Canada - Year-over-year growth 2025-2030 (%)

12.5.3 Mexico - Market size and forecast 2025-2030

Chart on Mexico - Market size and forecast 2025-2030 ($ thousand)
Data Table on Mexico - Market size and forecast 2025-2030 ($ thousand)
Chart on Mexico - Year-over-year growth 2025-2030 (%)
Data Table on Mexico - Year-over-year growth 2025-2030 (%)

12.6 South America - Market size and forecast 2025-2030

Chart on South America - Market size and forecast 2025-2030 ($ thousand)
Data Table on South America - Market size and forecast 2025-2030 ($ thousand)
Chart on South America - Year-over-year growth 2025-2030 (%)
Data Table on South America - Year-over-year growth 2025-2030 (%)
Chart on Regional Comparison - South America
Data Table on Regional Comparison - South America

12.6.1 Brazil - Market size and forecast 2025-2030

Chart on Brazil - Market size and forecast 2025-2030 ($ thousand)
Data Table on Brazil - Market size and forecast 2025-2030 ($ thousand)
Chart on Brazil - Year-over-year growth 2025-2030 (%)
Data Table on Brazil - Year-over-year growth 2025-2030 (%)

12.6.2 Argentina - Market size and forecast 2025-2030

Chart on Argentina - Market size and forecast 2025-2030 ($ thousand)
Data Table on Argentina - Market size and forecast 2025-2030 ($ thousand)
Chart on Argentina - Year-over-year growth 2025-2030 (%)
Data Table on Argentina - Year-over-year growth 2025-2030 (%)

12.6.3 Chile - Market size and forecast 2025-2030

Chart on Chile - Market size and forecast 2025-2030 ($ thousand)
Data Table on Chile - Market size and forecast 2025-2030 ($ thousand)
Chart on Chile - Year-over-year growth 2025-2030 (%)
Data Table on Chile - Year-over-year growth 2025-2030 (%)

12.7 Middle East and Africa - Market size and forecast 2025-2030

Chart on Middle East and Africa - Market size and forecast 2025-2030 ($ thousand)
Data Table on Middle East and Africa - Market size and forecast 2025-2030 ($ thousand)
Chart on Middle East and Africa - Year-over-year growth 2025-2030 (%)
Data Table on Middle East and Africa - Year-over-year growth 2025-2030 (%)
Chart on Regional Comparison - Middle East and Africa
Data Table on Regional Comparison - Middle East and Africa

12.7.1 Saudi Arabia - Market size and forecast 2025-2030

Chart on Saudi Arabia - Market size and forecast 2025-2030 ($ thousand)
Data Table on Saudi Arabia - Market size and forecast 2025-2030 ($ thousand)
Chart on Saudi Arabia - Year-over-year growth 2025-2030 (%)
Data Table on Saudi Arabia - Year-over-year growth 2025-2030 (%)

12.7.2 UAE - Market size and forecast 2025-2030

Chart on UAE - Market size and forecast 2025-2030 ($ thousand)
Data Table on UAE - Market size and forecast 2025-2030 ($ thousand)
Chart on UAE - Year-over-year growth 2025-2030 (%)
Data Table on UAE - Year-over-year growth 2025-2030 (%)

12.7.3 South Africa - Market size and forecast 2025-2030

Chart on South Africa - Market size and forecast 2025-2030 ($ thousand)
Data Table on South Africa - Market size and forecast 2025-2030 ($ thousand)
Chart on South Africa - Year-over-year growth 2025-2030 (%)
Data Table on South Africa - Year-over-year growth 2025-2030 (%)

12.7.4 Israel - Market size and forecast 2025-2030

Chart on Israel - Market size and forecast 2025-2030 ($ thousand)
Data Table on Israel - Market size and forecast 2025-2030 ($ thousand)
Chart on Israel - Year-over-year growth 2025-2030 (%)
Data Table on Israel - Year-over-year growth 2025-2030 (%)

12.7.5 Turkey - Market size and forecast 2025-2030

Chart on Turkey - Market size and forecast 2025-2030 ($ thousand)
Data Table on Turkey - Market size and forecast 2025-2030 ($ thousand)
Chart on Turkey - Year-over-year growth 2025-2030 (%)
Data Table on Turkey - Year-over-year growth 2025-2030 (%)

12.8 Market opportunity by geography

Market opportunity by geography ($ thousand)
Data Tables on Market opportunity by geography ($ thousand)

13. Drivers, Challenges, and Opportunity

13.1 Market drivers

Rising demand from pharmaceutical and healthcare industries
Growing use of droppers in cosmetic and personal care products
Increasing demand for accurate liquid dispensing solutions

13.2 Market challenges

Raw material price fluctuations affecting manufacturing costs
Strict regulatory standards for pharmaceutical packaging
Quality control requirements for precise liquid dispensing

13.3 Impact of drivers and challenges

Impact of drivers and challenges in 2025 and 2030

13.4 Market opportunities

Adoption of sustainable and recyclable packaging materials
Development of advanced dropper designs for precise dosing
Growing demand for premium packaging in cosmetic products

14. Competitive Landscape

14.1 Overview

14.2

Overview on criticality of inputs and factors of differentiation

14.3 Landscape disruption

Overview on factors of disruption

14.4 Industry risks

Impact of key risks on business

15. Competitive Analysis

15.1 Companies profiled

Companies covered

15.2 Company ranking index

15.3 Market positioning of companies

Matrix on companies position and classification

15.4 Abdos Labtech Pvt. Ltd.

Abdos Labtech Pvt. Ltd. - Overview
Abdos Labtech Pvt. Ltd. - Product / Service
Abdos Labtech Pvt. Ltd. - Key offerings
SWOT

15.5 Albea Services SAS

Albea Services SAS - Overview
Albea Services SAS - Product / Service
Albea Services SAS - Key offerings
SWOT

15.6 APackaging Group

APackaging Group - Overview
APackaging Group - Product / Service
APackaging Group - Key offerings
SWOT

15.7 AptarGroup Inc.

AptarGroup Inc. - Overview
AptarGroup Inc. - Business segments
AptarGroup Inc. - Key news
AptarGroup Inc. - Key offerings
AptarGroup Inc. - Segment focus
SWOT

15.8 Berlin Packaging LLC

Berlin Packaging LLC - Overview
Berlin Packaging LLC - Product / Service
Berlin Packaging LLC - Key offerings
SWOT

15.9 CannaCarton

CannaCarton - Overview
CannaCarton - Product / Service
CannaCarton - Key offerings
SWOT

15.10 Carow Packaging Inc.

Carow Packaging Inc. - Overview
Carow Packaging Inc. - Product / Service
Carow Packaging Inc. - Key offerings
SWOT

15.11 Corning Inc.

Corning Inc. - Overview
Corning Inc. - Business segments
Corning Inc. - Key offerings
Corning Inc. - Segment focus
SWOT

15.12 DWK Life Sciences GmbH

DWK Life Sciences GmbH - Overview
DWK Life Sciences GmbH - Product / Service
DWK Life Sciences GmbH - Key offerings
SWOT

15.13 Gerresheimer AG

Gerresheimer AG - Overview
Gerresheimer AG - Business segments
Gerresheimer AG - Key offerings
Gerresheimer AG - Segment focus
SWOT

15.14 Kaufman Container Co.

Kaufman Container Co. - Overview
Kaufman Container Co. - Product / Service
Kaufman Container Co. - Key offerings
SWOT

15.15 Paramark Corp.

Paramark Corp. - Overview
Paramark Corp. - Product / Service
Paramark Corp. - Key offerings
SWOT

15.16 Quadpack Industries SA

Quadpack Industries SA - Overview
Quadpack Industries SA - Product / Service
Quadpack Industries SA - Key offerings
SWOT

15.17 SGD Pharma

SGD Pharma - Overview
SGD Pharma - Product / Service
SGD Pharma - Key offerings
SWOT

15.18 Thermo Fisher Scientific Inc.

Thermo Fisher Scientific Inc. - Overview
Thermo Fisher Scientific Inc. - Business segments
Thermo Fisher Scientific Inc. - Key news
Thermo Fisher Scientific Inc. - Key offerings
Thermo Fisher Scientific Inc. - Segment focus
SWOT

16. Appendix

16.1 Scope of the report

Market definition
Objectives
Notes and caveats

16.2 Inclusions and exclusions checklist

Inclusions checklist
Exclusions checklist

16.3 Currency conversion rates for US$

16.4 Research methodology

16.5 Data procurement

Information sources

16.6 Data validation

16.7 Validation techniques employed for market sizing

16.8 Data synthesis

16.9 360 degree market analysis

16.10 List of abbreviations

Research Methodology

Technavio presents a detailed picture of the market by way of study, synthesis, and summation of data from multiple sources. The analysts have presented the various facets of the market with a particular focus on identifying the key industry influencers. The data thus presented is comprehensive, reliable, and the result of extensive research, both primary and secondary.

INFORMATION SOURCES

Primary sources

  • Manufacturers and suppliers
  • Channel partners
  • Industry experts
  • Strategic decision makers

Secondary sources

  • Industry journals and periodicals
  • Government data
  • Financial reports of key industry players
  • Historical data
  • Press releases

DATA ANALYSIS

Data Synthesis

  • Collation of data
  • Estimation of key figures
  • Analysis of derived insights

Data Validation

  • Triangulation with data models
  • Reference against proprietary databases
  • Corroboration with industry experts

REPORT WRITING

Qualitative

  • Market drivers
  • Market challenges
  • Market trends
  • Five forces analysis

Quantitative

  • Market size and forecast
  • Market segmentation
  • Geographical insights
  • Competitive landscape

Interested in this report?

Get your sample now to see our research methodology and insights!

Download Now

Frequently Asked Questions

Dropper market growth will increase by USD 61329.4 thousand thousand during 2026-2030.

The Dropper market is expected to grow at a CAGR of 4.7% during 2026-2030.

Dropper market is segmented by Application (Healthcare, Personal care, Home care, Food and beverage, Others) Material (Glass, Plastic, Rubber, Others) Variant (1-5 ml, Below 1 ml, Above 5 ml )

Abdos Labtech Pvt. Ltd., Adelphi Healthcare Packaging, Albea Services SAS, APackaging Group, AptarGroup Inc., Berlin Packaging LLC, Bormioli Pharma Spa, CannaCarton, Carow Packaging Inc., Corning Inc., Das Enterprises, DWK Life Sciences GmbH, Gerresheimer AG, Kaufman Container Co., Paramark Corp., PauPack, Quadpack Industries SA, SGD Pharma, Thermo Fisher Scientific Inc., Your Oil Tools are a few of the key vendors in the Dropper market.

APAC will register the highest growth rate of 42.1% among the other regions. Therefore, the Dropper market in APAC is expected to garner significant business opportunities for the vendors during the forecast period.

China, Japan, India, South Korea, Australia, Indonesia, Germany, UK, France, Italy, Spain, The Netherlands, US, Canada, Mexico, Brazil, Argentina, Chile, Saudi Arabia, UAE, South Africa, Israel, Turkey

  • Rising demand from pharmaceutical and healthcare industries is the driving factor this market.

The Dropper market vendors should focus on grabbing business opportunities from the Application segment as it accounted for the largest market share in the base year.
RIA - Research AI Assistant
Ask RIA