Higher Education Testing And Assessment Market Analysis, Size, and Forecast 2026-2030: North America (US, Canada, and Mexico), Europe (Germany, UK, and France), APAC (China, Japan, and India), Middle East and Africa (Saudi Arabia, UAE, and South Africa), South America (Brazil and Argentina), and Rest of World (ROW)

Higher Education Testing And Assessment Market Analysis, Size, and Forecast 2026-2030:
North America (US, Canada, and Mexico), Europe (Germany, UK, and France), APAC (China, Japan, and India), Middle East and Africa (Saudi Arabia, UAE, and South Africa), South America (Brazil and Argentina), and Rest of World (ROW)

Published: Mar 2026 293 Pages SKU: IRTNTR44572

Market Overview at a Glance

$8.15 B
Market Opportunity
6.7%
CAGR 2025 - 2030
28.7%
Europe Growth
$10.41 B
Academic segment 2024

Higher Education Testing And Assessment Market Size 2026-2030

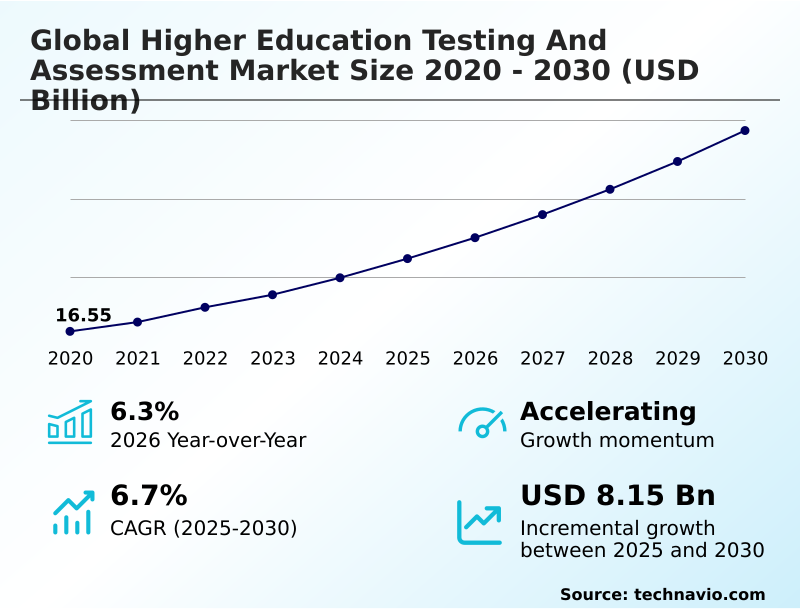
The higher education testing and assessment market size is valued to increase by USD 8.15 billion, at a CAGR of 6.7% from 2025 to 2030. Integration of AI agent and ML in assessment frameworks will drive the higher education testing and assessment market.

Major Market Trends & Insights

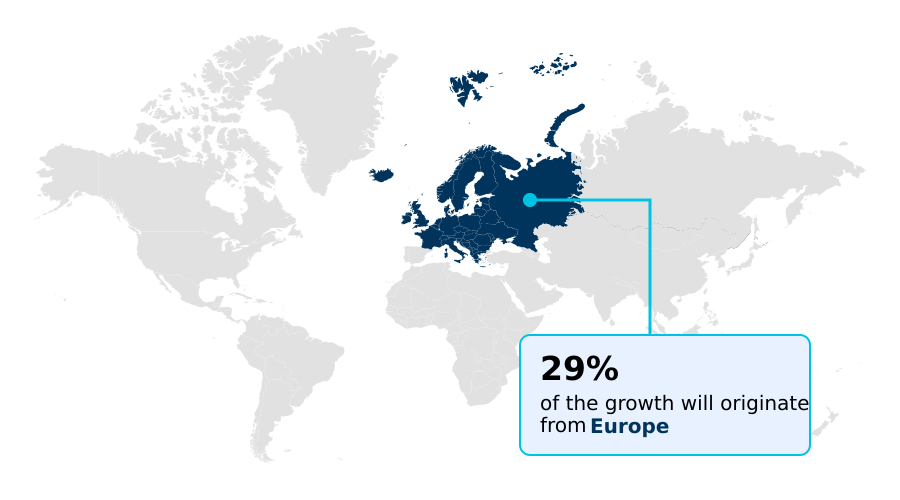
  • Europe dominated the market and accounted for a 28.7% growth during the forecast period.
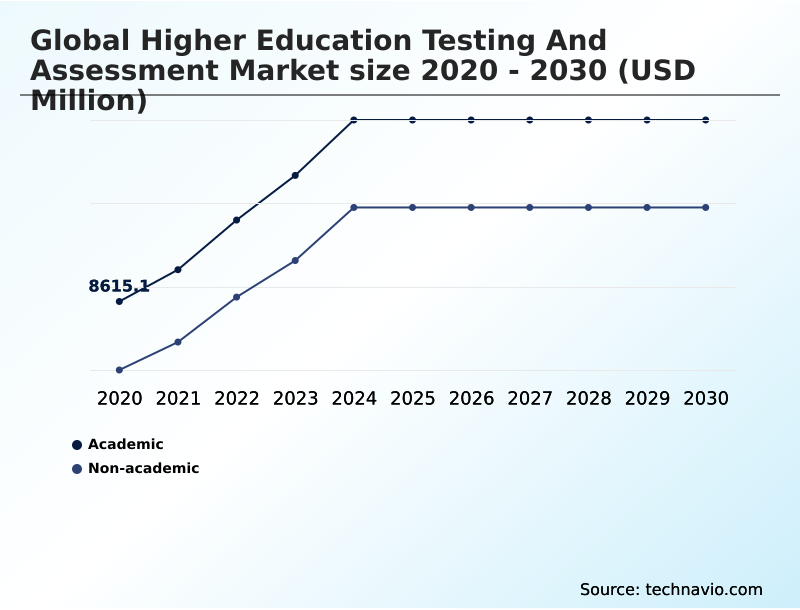
  • By Product - Academic segment was valued at USD 10.41 billion in 2024
  • By End-user - Educational institutions segment accounted for the largest market revenue share in 2024

Market Size & Forecast

  • Market Opportunities: USD 12.78 billion
  • Market Future Opportunities: USD 8.15 billion
  • CAGR from 2025 to 2030 : 6.7%

Market Summary

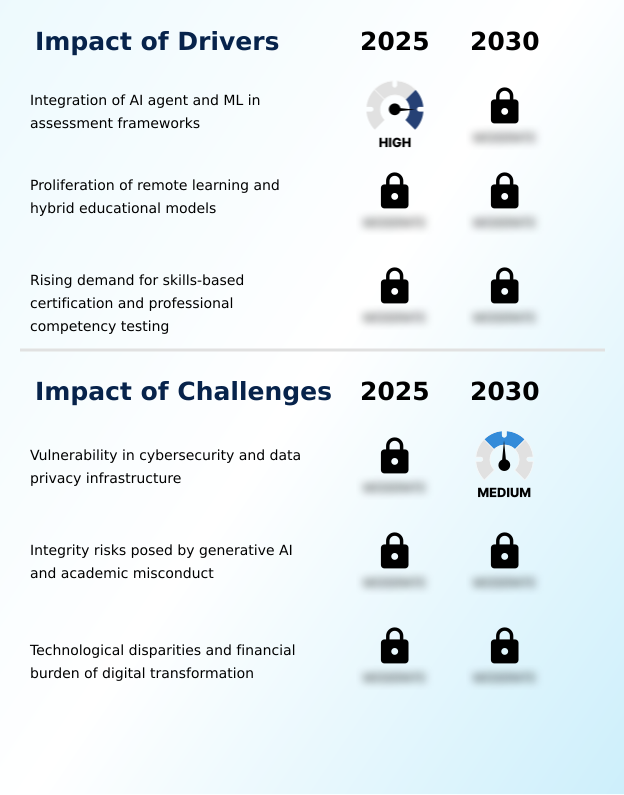
  • The higher education testing and assessment market is undergoing a profound transformation, moving beyond traditional evaluation methods to embrace a sophisticated digital ecosystem. This evolution is driven by the proliferation of remote learning and a growing demand for verifiable skills-based certification.
  • Institutions are increasingly adopting online assessment platforms that leverage adaptive testing algorithms and AI in educational assessment to deliver personalized and efficient evaluations. A key trend involves the use of gamified assessment environments and virtual lab simulations to measure practical skills in a more engaging manner.
  • For instance, a university system might deploy a unified digital examination platform to standardize course-level evaluation and ensure remote assessment validity across all its campuses. This requires robust assessment software integration and secure browser lockdown technology.
  • However, this transition is not without its challenges, including the need to ensure academic integrity through AI text detection tools and address the digital divide with low-bandwidth assessment tools. The focus remains on creating a secure testing environment that is both effective and equitable, using learning analytics dashboards to drive continuous improvement in educational outcomes and maintain institutional credibility.

What will be the Size of the Higher Education Testing And Assessment Market during the forecast period?

Get Key Insights on Market Forecast (PDF) Request Free Sample

How is the Higher Education Testing And Assessment Market Segmented?

The higher education testing and assessment industry research report provides comprehensive data (region-wise segment analysis), with forecasts and estimates in "USD million" for the period 2026-2030, as well as historical data from 2020-2024 for the following segments.

  • Product
    • Academic
    • Non-academic
  • End-user
    • Educational institutions
    • Universities
    • Training organizations
    • Others
  • Delivery mode
    • Online
    • Offline
  • Geography
    • North America
      • US
      • Canada
      • Mexico
    • Europe
      • Germany
      • UK
      • France
    • APAC
      • China
      • Japan
      • India
    • Middle East and Africa
      • Saudi Arabia
      • UAE
      • South Africa
    • South America
      • Brazil
      • Argentina
    • Rest of World (ROW)

By Product Insights

The academic segment is estimated to witness significant growth during the forecast period.

The academic segment is driven by the adoption of sophisticated online assessment platforms that use adaptive testing algorithms and psychometric modeling for personalized evaluation. To ensure integrity, institutions are deploying remote proctoring solutions with biometric verification systems.

This technology enables computer-adaptive testing at scale, with automated scoring engines improving efficiency. This shift supports the creation of tamper-proof academic records using distributed ledger technology in education, enhancing the credibility of vocational skills testing and language proficiency assessment.

The move toward digital badge frameworks and a comprehensive learner record is redefining how achievements are documented, with some platforms reporting a 90% reduction in credential verification times.

Request Free Sample

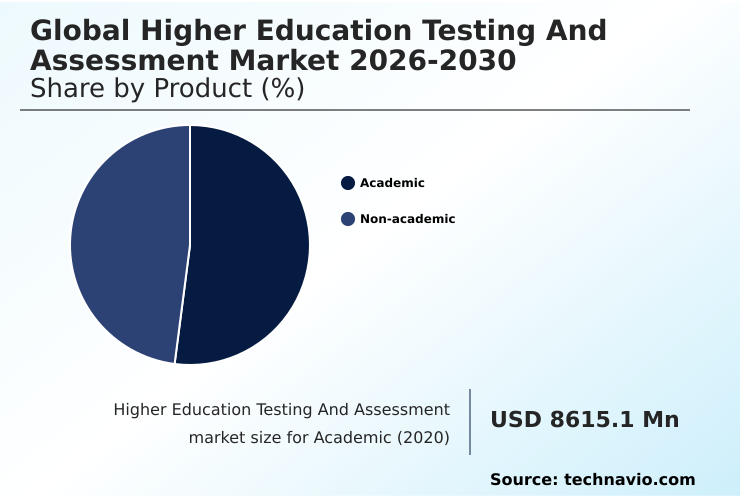
The Academic segment was valued at USD 10.41 billion in 2024 and showed a gradual increase during the forecast period.

Request Free Sample

Regional Analysis

Europe is estimated to contribute 28.7% to the growth of the global market during the forecast period.Technavio’s analysts have elaborately explained the regional trends and drivers that shape the market during the forecast period.

See How Higher Education Testing And Assessment Market Demand is Rising in Europe Request Free Sample

The geographic landscape is defined by varying priorities in digital transformation. Mature markets focus on high-stakes examination security, utilizing advanced assessment data analytics and learning analytics dashboards for deep course-level evaluation.

In contrast, developing regions prioritize digital assessment accessibility through scalable cloud-based evaluation tools and low-bandwidth solutions. The use of formative assessment tools for continuous feedback is growing globally, improving learning outcomes alignment by over 20%.

The adoption of secure browser lockdown technology has become a standard for standardized test development, reducing cheating incidents by more than 70%. These regional strategies influence summative assessment design and the framework for micro-credential verification and pre-employment aptitude testing.

Market Dynamics

Our researchers analyzed the data with 2025 as the base year, along with the key drivers, trends, and challenges. A holistic analysis of drivers will help companies refine their marketing strategies to gain a competitive advantage.

  • The global higher education testing and assessment market 2026-2030 navigates complex challenges, centering on the impact of AI on assessment integrity and the critical role of biometrics in remote proctoring. As institutions grapple with securing high-stakes exams in online environments, the focus shifts to AI-powered grading versus traditional methods, prompting the need for clear best practices for AI plagiarism detection.
  • This dynamic is complicated by data privacy concerns in online testing, which demands robust multimodal analytics for remote test security. Pedagogically, there is a move toward adaptive testing for personalized learning paths and exploring the benefits of gamification in student testing to foster engagement.
  • A primary goal is achieving competency-based assessment for workforce readiness by measuring soft skills through simulation assessments. However, realizing this vision faces challenges in digital assessment equity, requiring the implementation of low-bandwidth assessment solutions and reliable offline testing solutions for remote regions.
  • Institutions that are integrating assessments with learning management systems report a workflow efficiency improvement nearly double that of those using siloed solutions, demonstrating a clear cost-benefit analysis of digital proctoring. Successfully validating skills with digital micro-credentials and using predictive analytics to improve student retention will depend on resolving these interconnected issues.

What are the key market drivers leading to the rise in the adoption of Higher Education Testing And Assessment Industry?

  • The integration of artificial intelligence and machine learning within assessment frameworks is a primary driver for the market, enabling more adaptive and personalized testing experiences.

  • Key market drivers include the push for efficiency and the growing demand for workforce-aligned skills. The integration of an AI-powered grading assistant and machine learning driven proctoring is critical, with some institutions reducing evaluation workloads by up to 50%.
  • This allows educators to focus on pedagogy rather than administrative tasks. There is also a strong drive toward competency-based evaluation, supported by digital credentialing platforms that enhance higher education credentialing.
  • The use of predictive analytics for student performance helps institutions improve retention by identifying at-risk students with over 20% greater accuracy.
  • To support these innovations, a secure digital assessment infrastructure is paramount, incorporating AI text detection tools and advanced e-learning assessment tools to ensure remote assessment validity and build a secure testing environment through seamless assessment software integration and the broader use of AI in educational assessment.

What are the market trends shaping the Higher Education Testing And Assessment Industry?

  • A key market trend is the shift toward gamified and immersive assessment environments. These interactive formats are designed to increase student engagement and provide more accurate measurements of practical skills.

  • Market trends are pushing toward more dynamic and secure evaluation methods. The adoption of gamified assessment environments and simulation based testing is on the rise, with some studies showing these methods can boost student engagement by over 35%. To address integrity concerns in remote settings, companies are implementing multimodal biometrics, behavioral analytics, and keystroke dynamics within digital proctoring services.
  • The use of blockchain for academic verification is another significant trend, offering a way to create tamper-proof records for skills-based certification and reducing credential fraud by over 90%. These innovations in online exam administration and educational testing security are creating sophisticated academic integrity solutions, such as virtual lab simulations, while also providing richer data on student performance metrics.

What challenges does the Higher Education Testing And Assessment Industry face during its growth?

  • Significant vulnerabilities in cybersecurity and data privacy infrastructure present a key challenge, posing risks to student data and institutional trust.

  • The primary market challenges revolve around equity, cost, and technological complexity. While advanced tools like eye tracking technology are used in automated proctoring systems, their high bandwidth requirements create a digital divide.
  • Institutions in underserved areas report that over 50% of students struggle with connectivity, hindering access to digital examination platforms and necessitating low-bandwidth assessment tools and robust offline testing capabilities. The high cost of developing assessments based on item response theory can be prohibitive. Furthermore, reliance on these advanced tools for performance-based assessment raises questions about fairness.
  • Effective deployment of personalized learning assessment through various test delivery platforms and talent assessment platforms, along with robust plagiarism detection software, student authentication methods, and accreditation management software, requires significant investment and training, posing a logistical hurdle.

Exclusive Technavio Analysis on Customer Landscape

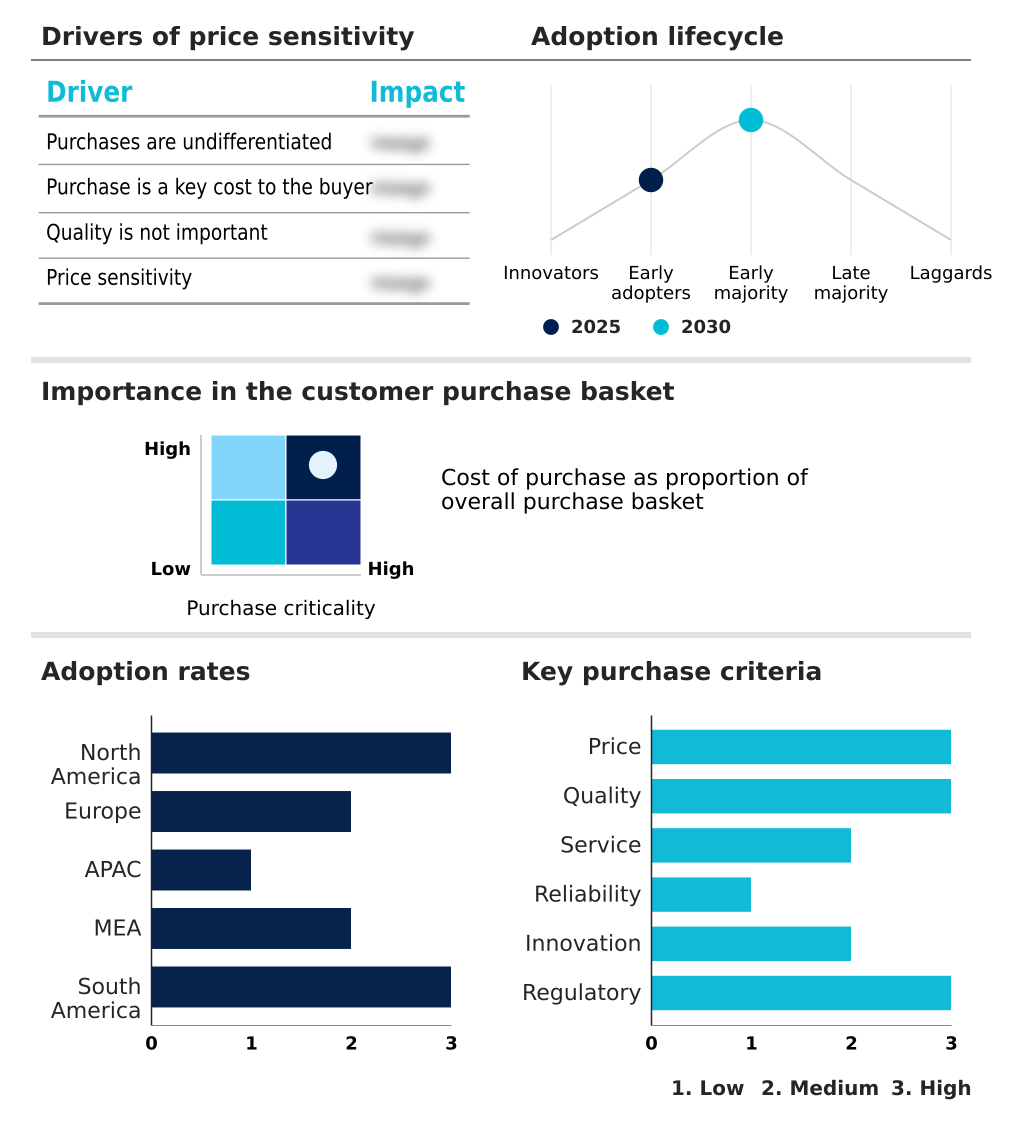
The higher education testing and assessment market forecasting report includes the adoption lifecycle of the market, covering from the innovator’s stage to the laggard’s stage. It focuses on adoption rates in different regions based on penetration. Furthermore, the higher education testing and assessment market report also includes key purchase criteria and drivers of price sensitivity to help companies evaluate and develop their market growth analysis strategies.

Customer Landscape of Higher Education Testing And Assessment Industry

Competitive Landscape

Companies are implementing various strategies, such as strategic alliances, higher education testing and assessment market forecast, partnerships, mergers and acquisitions, geographical expansion, and product/service launches, to enhance their presence in the industry.

Acadecraft Inc. - Specializes in interactive and performance-based assessment development, offering summative testing programs to evaluate academic and professional competency within higher education.

The industry research and growth report includes detailed analyses of the competitive landscape of the market and information about key companies, including:

  • Acadecraft Inc.
  • Apperson Inc.
  • Aptech Ltd.
  • Assessment Systems
  • Coursera Inc.
  • Ellucian Co.
  • ETS Global
  • Harver B.V.
  • Janison Education Group Ltd
  • Kaplan Inc.
  • L and T EduTech.
  • McGraw Hill LLC
  • Mercer LLC
  • Mindlogicx
  • Oxford Learning Centers Inc.
  • Pearson Plc
  • ProctorU
  • Prometric Inc.
  • QA Higher Education
  • Scantron Inc.

Qualitative and quantitative analysis of companies has been conducted to help clients understand the wider business environment as well as the strengths and weaknesses of key industry players. Data is qualitatively analyzed to categorize companies as pure play, category-focused, industry-focused, and diversified; it is quantitatively analyzed to categorize companies as dominant, leading, strong, tentative, and weak.

Recent Development and News in Higher education testing and assessment market

  • In August, 2024, LinkedIn Learning collaborated with academic testing companies to create assessments that directly link test results to job opportunities on its platform.
  • In November, 2024, Duolingo expanded its English Test portfolio to include industry-specific language proficiency assessments for higher education graduates entering the global workforce.
  • In January, 2025, ExamSoft updated its assessment software to include predictive analytics that help academic institutions forecast student performance based on historical data.
  • In March, 2025, Pearson acquired a specialized game design studio to integrate more sophisticated gamified mechanics into its global testing portfolio for modern learners.

Dive into Technavio’s robust research methodology, blending expert interviews, extensive data synthesis, and validated models for unparalleled Higher Education Testing And Assessment Market insights. See full methodology.

Market Scope
Page number 293
Base year 2025
Historic period 2020-2024
Forecast period 2026-2030
Growth momentum & CAGR Accelerate at a CAGR of 6.7%
Market growth 2026-2030 USD 8147.5 million
Market structure Fragmented
YoY growth 2025-2026(%) 6.3%
Key countries US, Canada, Mexico, Germany, UK, France, Italy, Spain, The Netherlands, China, Japan, India, South Korea, Australia, Indonesia, Saudi Arabia, UAE, South Africa, Israel, Turkey, Brazil, Argentina and Chile
Competitive landscape Leading Companies, Market Positioning of Companies, Competitive Strategies, and Industry Risks

Request Free Sample

Research Analyst Overview

  • The higher education testing and assessment market is defined by a rapid technological shift, where biometric verification systems and remote proctoring solutions are becoming standard for ensuring high-stakes examination security. A key boardroom decision involves budgeting for the migration to a unified digital ecosystem featuring secure digital assessment infrastructure and robust plagiarism detection software.
  • This transition incorporates advanced psychometric modeling and student authentication methods to validate results. Platforms integrating predictive analytics for student performance have demonstrated an ability to identify at-risk students with 40% greater accuracy than traditional methods. The evolution toward gamified assessment environments and simulation based testing reflects a move to competency-based evaluation, supported by AI-powered grading assistants and computer-adaptive testing.
  • This requires effective assessment data analytics, learning outcomes alignment, and the use of formative assessment tools, machine learning driven proctoring, digital credentialing platforms, and AI text detection tools. Ultimately, the goal is to create a holistic system using online assessment platforms and accreditation management software for both summative assessment design and standardized test development.

What are the Key Data Covered in this Higher Education Testing And Assessment Market Research and Growth Report?

  • What is the expected growth of the Higher Education Testing And Assessment Market between 2026 and 2030?

    • USD 8.15 billion, at a CAGR of 6.7%

  • What segmentation does the market report cover?

    • The report is segmented by Product (Academic, and Non-academic), End-user (Educational institutions, Universities, Training organizations, and Others), Delivery Mode (Online, and Offline) and Geography (North America, Europe, APAC, Middle East and Africa, South America)

  • Which regions are analyzed in the report?

    • North America, Europe, APAC, Middle East and Africa and South America

  • What are the key growth drivers and market challenges?

    • Integration of AI agent and ML in assessment frameworks, Vulnerability in cybersecurity and data privacy infrastructure

  • Who are the major players in the Higher Education Testing And Assessment Market?

    • Acadecraft Inc., Apperson Inc., Aptech Ltd., Assessment Systems, Coursera Inc., Ellucian Co., ETS Global, Harver B.V., Janison Education Group Ltd, Kaplan Inc., L and T EduTech., McGraw Hill LLC, Mercer LLC, Mindlogicx, Oxford Learning Centers Inc., Pearson Plc, ProctorU, Prometric Inc., QA Higher Education and Scantron Inc.

Market Research Insights

  • The market is driven by a focus on enhancing academic integrity solutions and providing verifiable skills-based certification. The adoption of digital proctoring services has proven effective, with some institutions reporting a reduction in academic misconduct incidents by over 60% compared to unproctored exams.
  • AI in educational assessment is another key dynamic, reducing grading time for educators by up to 30% and enabling a shift toward performance-based assessment. Furthermore, the integration of personalized learning assessment pathways correlates with a nearly 15% improvement in student retention rates.
  • As institutions demand more robust e-learning assessment tools and online exam administration capabilities, the emphasis is on creating a balanced ecosystem that ensures remote assessment validity without compromising the student experience.

We can help! Our analysts can customize this higher education testing and assessment market research report to meet your requirements.

Get in touch

1. Executive Summary

1.1 Market overview

Executive Summary - Chart on Market Overview
Executive Summary - Data Table on Market Overview
Executive Summary - Chart on Global Market Characteristics
Executive Summary - Chart on Market by Geography
Executive Summary - Chart on Market Segmentation by Product
Executive Summary - Chart on Market Segmentation by End-user
Executive Summary - Chart on Market Segmentation by Delivery Mode
Executive Summary - Chart on Incremental Growth
Executive Summary - Data Table on Incremental Growth
Executive Summary - Chart on Company Market Positioning

2. Technavio Analysis

2.1 Analysis of price sensitivity, lifecycle, customer purchase basket, adoption rates, and purchase criteria

2.2 Criticality of inputs and Factors of differentiation

Chart on Overview on criticality of inputs and factors of differentiation

2.3 Factors of disruption

Chart on Overview on factors of disruption

2.4 Impact of drivers and challenges

Chart on Impact of drivers and challenges in 2025 and 2030

3. Market Landscape

3.1 Market ecosystem

Chart on Parent Market
Data Table on - Parent Market

3.2 Market characteristics

Chart on Market characteristics analysis

3.3 Value chain analysis

Chart on Value chain analysis

4. Market Sizing

4.1 Market definition

Data Table on Offerings of companies included in the market definition

4.2 Market segment analysis

Market segments

4.3 Market size 2025

4.4 Market outlook: Forecast for 2025-2030

Chart on Global - Market size and forecast 2025-2030 ($ million)
Data Table on Global - Market size and forecast 2025-2030 ($ million)
Chart on Global Market: Year-over-year growth 2025-2030 (%)
Data Table on Global Market: Year-over-year growth 2025-2030 (%)

5. Historic Market Size

5.1 Global Higher Education Testing And Assessment Market 2020 - 2024

Historic Market Size - Data Table on Global Higher Education Testing And Assessment Market 2020 - 2024 ($ million)

5.2 Product segment analysis 2020 - 2024

Historic Market Size - Product Segment 2020 - 2024 ($ million)

5.3 End-user segment analysis 2020 - 2024

Historic Market Size - End-user Segment 2020 - 2024 ($ million)

5.4 Delivery Mode segment analysis 2020 - 2024

Historic Market Size - Delivery Mode Segment 2020 - 2024 ($ million)

5.5 Geography segment analysis 2020 - 2024

Historic Market Size - Geography Segment 2020 - 2024 ($ million)

5.6 Country segment analysis 2020 - 2024

Historic Market Size - Country Segment 2020 - 2024 ($ million)

6. Qualitative Analysis

6.1 Impact of AI on Global Higher Education Testing and Assessment Market

7. Five Forces Analysis

7.1 Five forces summary

Five forces analysis - Comparison between 2025 and 2030

7.2 Bargaining power of buyers

Bargaining power of buyers - Impact of key factors 2025 and 2030

7.3 Bargaining power of suppliers

Bargaining power of suppliers - Impact of key factors in 2025 and 2030

7.4 Threat of new entrants

Threat of new entrants - Impact of key factors in 2025 and 2030

7.5 Threat of substitutes

Threat of substitutes - Impact of key factors in 2025 and 2030

7.6 Threat of rivalry

Threat of rivalry - Impact of key factors in 2025 and 2030

7.7 Market condition

Chart on Market condition - Five forces 2025 and 2030

8. Market Segmentation by Product

8.1 Market segments

Chart on Product - Market share 2025-2030 (%)
Data Table on Product - Market share 2025-2030 (%)

8.2 Comparison by Product

Chart on Comparison by Product
Data Table on Comparison by Product

8.3 Academic - Market size and forecast 2025-2030

Chart on Academic - Market size and forecast 2025-2030 ($ million)
Data Table on Academic - Market size and forecast 2025-2030 ($ million)
Chart on Academic - Year-over-year growth 2025-2030 (%)
Data Table on Academic - Year-over-year growth 2025-2030 (%)

8.4 Non-academic - Market size and forecast 2025-2030

Chart on Non-academic - Market size and forecast 2025-2030 ($ million)
Data Table on Non-academic - Market size and forecast 2025-2030 ($ million)
Chart on Non-academic - Year-over-year growth 2025-2030 (%)
Data Table on Non-academic - Year-over-year growth 2025-2030 (%)

8.5 Market opportunity by Product

Market opportunity by Product ($ million)
Data Table on Market opportunity by Product ($ million)

9. Market Segmentation by End-user

9.1 Market segments

Chart on End-user - Market share 2025-2030 (%)
Data Table on End-user - Market share 2025-2030 (%)

9.2 Comparison by End-user

Chart on Comparison by End-user
Data Table on Comparison by End-user

9.3 Educational institutions - Market size and forecast 2025-2030

Chart on Educational institutions - Market size and forecast 2025-2030 ($ million)
Data Table on Educational institutions - Market size and forecast 2025-2030 ($ million)
Chart on Educational institutions - Year-over-year growth 2025-2030 (%)
Data Table on Educational institutions - Year-over-year growth 2025-2030 (%)

9.4 Universities - Market size and forecast 2025-2030

Chart on Universities - Market size and forecast 2025-2030 ($ million)
Data Table on Universities - Market size and forecast 2025-2030 ($ million)
Chart on Universities - Year-over-year growth 2025-2030 (%)
Data Table on Universities - Year-over-year growth 2025-2030 (%)

9.5 Training organizations - Market size and forecast 2025-2030

Chart on Training organizations - Market size and forecast 2025-2030 ($ million)
Data Table on Training organizations - Market size and forecast 2025-2030 ($ million)
Chart on Training organizations - Year-over-year growth 2025-2030 (%)
Data Table on Training organizations - Year-over-year growth 2025-2030 (%)

9.6 Others - Market size and forecast 2025-2030

Chart on Others - Market size and forecast 2025-2030 ($ million)
Data Table on Others - Market size and forecast 2025-2030 ($ million)
Chart on Others - Year-over-year growth 2025-2030 (%)
Data Table on Others - Year-over-year growth 2025-2030 (%)

9.7 Market opportunity by End-user

Market opportunity by End-user ($ million)
Data Table on Market opportunity by End-user ($ million)

10. Market Segmentation by Delivery Mode

10.1 Market segments

Chart on Delivery Mode - Market share 2025-2030 (%)
Data Table on Delivery Mode - Market share 2025-2030 (%)

10.2 Comparison by Delivery Mode

Chart on Comparison by Delivery Mode
Data Table on Comparison by Delivery Mode

10.3 Online - Market size and forecast 2025-2030

Chart on Online - Market size and forecast 2025-2030 ($ million)
Data Table on Online - Market size and forecast 2025-2030 ($ million)
Chart on Online - Year-over-year growth 2025-2030 (%)
Data Table on Online - Year-over-year growth 2025-2030 (%)

10.4 Offline - Market size and forecast 2025-2030

Chart on Offline - Market size and forecast 2025-2030 ($ million)
Data Table on Offline - Market size and forecast 2025-2030 ($ million)
Chart on Offline - Year-over-year growth 2025-2030 (%)
Data Table on Offline - Year-over-year growth 2025-2030 (%)

10.5 Market opportunity by Delivery Mode

Market opportunity by Delivery Mode ($ million)
Data Table on Market opportunity by Delivery Mode ($ million)

11. Customer Landscape

11.1 Customer landscape overview

Analysis of price sensitivity, lifecycle, customer purchase basket, adoption rates, and purchase criteria

12. Geographic Landscape

12.1 Geographic segmentation

Chart on Market share by geography 2025-2030 (%)
Data Table on Market share by geography 2025-2030 (%)

12.2 Geographic comparison

Chart on Geographic comparison
Data Table on Geographic comparison

12.3 North America - Market size and forecast 2025-2030

Chart on North America - Market size and forecast 2025-2030 ($ million)
Data Table on North America - Market size and forecast 2025-2030 ($ million)
Chart on North America - Year-over-year growth 2025-2030 (%)
Data Table on North America - Year-over-year growth 2025-2030 (%)
Chart on Regional Comparison - North America
Data Table on Regional Comparison - North America

12.3.1 US - Market size and forecast 2025-2030

Chart on US - Market size and forecast 2025-2030 ($ million)
Data Table on US - Market size and forecast 2025-2030 ($ million)
Chart on US - Year-over-year growth 2025-2030 (%)
Data Table on US - Year-over-year growth 2025-2030 (%)

12.3.2 Canada - Market size and forecast 2025-2030

Chart on Canada - Market size and forecast 2025-2030 ($ million)
Data Table on Canada - Market size and forecast 2025-2030 ($ million)
Chart on Canada - Year-over-year growth 2025-2030 (%)
Data Table on Canada - Year-over-year growth 2025-2030 (%)

12.3.3 Mexico - Market size and forecast 2025-2030

Chart on Mexico - Market size and forecast 2025-2030 ($ million)
Data Table on Mexico - Market size and forecast 2025-2030 ($ million)
Chart on Mexico - Year-over-year growth 2025-2030 (%)
Data Table on Mexico - Year-over-year growth 2025-2030 (%)

12.4 Europe - Market size and forecast 2025-2030

Chart on Europe - Market size and forecast 2025-2030 ($ million)
Data Table on Europe - Market size and forecast 2025-2030 ($ million)
Chart on Europe - Year-over-year growth 2025-2030 (%)
Data Table on Europe - Year-over-year growth 2025-2030 (%)
Chart on Regional Comparison - Europe
Data Table on Regional Comparison - Europe

12.4.1 Germany - Market size and forecast 2025-2030

Chart on Germany - Market size and forecast 2025-2030 ($ million)
Data Table on Germany - Market size and forecast 2025-2030 ($ million)
Chart on Germany - Year-over-year growth 2025-2030 (%)
Data Table on Germany - Year-over-year growth 2025-2030 (%)

12.4.2 UK - Market size and forecast 2025-2030

Chart on UK - Market size and forecast 2025-2030 ($ million)
Data Table on UK - Market size and forecast 2025-2030 ($ million)
Chart on UK - Year-over-year growth 2025-2030 (%)
Data Table on UK - Year-over-year growth 2025-2030 (%)

12.4.3 France - Market size and forecast 2025-2030

Chart on France - Market size and forecast 2025-2030 ($ million)
Data Table on France - Market size and forecast 2025-2030 ($ million)
Chart on France - Year-over-year growth 2025-2030 (%)
Data Table on France - Year-over-year growth 2025-2030 (%)

12.4.4 Italy - Market size and forecast 2025-2030

Chart on Italy - Market size and forecast 2025-2030 ($ million)
Data Table on Italy - Market size and forecast 2025-2030 ($ million)
Chart on Italy - Year-over-year growth 2025-2030 (%)
Data Table on Italy - Year-over-year growth 2025-2030 (%)

12.4.5 Spain - Market size and forecast 2025-2030

Chart on Spain - Market size and forecast 2025-2030 ($ million)
Data Table on Spain - Market size and forecast 2025-2030 ($ million)
Chart on Spain - Year-over-year growth 2025-2030 (%)
Data Table on Spain - Year-over-year growth 2025-2030 (%)

12.4.6 The Netherlands - Market size and forecast 2025-2030

Chart on The Netherlands - Market size and forecast 2025-2030 ($ million)
Data Table on The Netherlands - Market size and forecast 2025-2030 ($ million)
Chart on The Netherlands - Year-over-year growth 2025-2030 (%)
Data Table on The Netherlands - Year-over-year growth 2025-2030 (%)

12.5 APAC - Market size and forecast 2025-2030

Chart on APAC - Market size and forecast 2025-2030 ($ million)
Data Table on APAC - Market size and forecast 2025-2030 ($ million)
Chart on APAC - Year-over-year growth 2025-2030 (%)
Data Table on APAC - Year-over-year growth 2025-2030 (%)
Chart on Regional Comparison - APAC
Data Table on Regional Comparison - APAC

12.5.1 China - Market size and forecast 2025-2030

Chart on China - Market size and forecast 2025-2030 ($ million)
Data Table on China - Market size and forecast 2025-2030 ($ million)
Chart on China - Year-over-year growth 2025-2030 (%)
Data Table on China - Year-over-year growth 2025-2030 (%)

12.5.2 Japan - Market size and forecast 2025-2030

Chart on Japan - Market size and forecast 2025-2030 ($ million)
Data Table on Japan - Market size and forecast 2025-2030 ($ million)
Chart on Japan - Year-over-year growth 2025-2030 (%)
Data Table on Japan - Year-over-year growth 2025-2030 (%)

12.5.3 India - Market size and forecast 2025-2030

Chart on India - Market size and forecast 2025-2030 ($ million)
Data Table on India - Market size and forecast 2025-2030 ($ million)
Chart on India - Year-over-year growth 2025-2030 (%)
Data Table on India - Year-over-year growth 2025-2030 (%)

12.5.4 South Korea - Market size and forecast 2025-2030

Chart on South Korea - Market size and forecast 2025-2030 ($ million)
Data Table on South Korea - Market size and forecast 2025-2030 ($ million)
Chart on South Korea - Year-over-year growth 2025-2030 (%)
Data Table on South Korea - Year-over-year growth 2025-2030 (%)

12.5.5 Australia - Market size and forecast 2025-2030

Chart on Australia - Market size and forecast 2025-2030 ($ million)
Data Table on Australia - Market size and forecast 2025-2030 ($ million)
Chart on Australia - Year-over-year growth 2025-2030 (%)
Data Table on Australia - Year-over-year growth 2025-2030 (%)

12.5.6 Indonesia - Market size and forecast 2025-2030

Chart on Indonesia - Market size and forecast 2025-2030 ($ million)
Data Table on Indonesia - Market size and forecast 2025-2030 ($ million)
Chart on Indonesia - Year-over-year growth 2025-2030 (%)
Data Table on Indonesia - Year-over-year growth 2025-2030 (%)

12.6 Middle East and Africa - Market size and forecast 2025-2030

Chart on Middle East and Africa - Market size and forecast 2025-2030 ($ million)
Data Table on Middle East and Africa - Market size and forecast 2025-2030 ($ million)
Chart on Middle East and Africa - Year-over-year growth 2025-2030 (%)
Data Table on Middle East and Africa - Year-over-year growth 2025-2030 (%)
Chart on Regional Comparison - Middle East and Africa
Data Table on Regional Comparison - Middle East and Africa

12.6.1 Saudi Arabia - Market size and forecast 2025-2030

Chart on Saudi Arabia - Market size and forecast 2025-2030 ($ million)
Data Table on Saudi Arabia - Market size and forecast 2025-2030 ($ million)
Chart on Saudi Arabia - Year-over-year growth 2025-2030 (%)
Data Table on Saudi Arabia - Year-over-year growth 2025-2030 (%)

12.6.2 UAE - Market size and forecast 2025-2030

Chart on UAE - Market size and forecast 2025-2030 ($ million)
Data Table on UAE - Market size and forecast 2025-2030 ($ million)
Chart on UAE - Year-over-year growth 2025-2030 (%)
Data Table on UAE - Year-over-year growth 2025-2030 (%)

12.6.3 South Africa - Market size and forecast 2025-2030

Chart on South Africa - Market size and forecast 2025-2030 ($ million)
Data Table on South Africa - Market size and forecast 2025-2030 ($ million)
Chart on South Africa - Year-over-year growth 2025-2030 (%)
Data Table on South Africa - Year-over-year growth 2025-2030 (%)

12.6.4 Israel - Market size and forecast 2025-2030

Chart on Israel - Market size and forecast 2025-2030 ($ million)
Data Table on Israel - Market size and forecast 2025-2030 ($ million)
Chart on Israel - Year-over-year growth 2025-2030 (%)
Data Table on Israel - Year-over-year growth 2025-2030 (%)

12.6.5 Turkey - Market size and forecast 2025-2030

Chart on Turkey - Market size and forecast 2025-2030 ($ million)
Data Table on Turkey - Market size and forecast 2025-2030 ($ million)
Chart on Turkey - Year-over-year growth 2025-2030 (%)
Data Table on Turkey - Year-over-year growth 2025-2030 (%)

12.7 South America - Market size and forecast 2025-2030

Chart on South America - Market size and forecast 2025-2030 ($ million)
Data Table on South America - Market size and forecast 2025-2030 ($ million)
Chart on South America - Year-over-year growth 2025-2030 (%)
Data Table on South America - Year-over-year growth 2025-2030 (%)
Chart on Regional Comparison - South America
Data Table on Regional Comparison - South America

12.7.1 Brazil - Market size and forecast 2025-2030

Chart on Brazil - Market size and forecast 2025-2030 ($ million)
Data Table on Brazil - Market size and forecast 2025-2030 ($ million)
Chart on Brazil - Year-over-year growth 2025-2030 (%)
Data Table on Brazil - Year-over-year growth 2025-2030 (%)

12.7.2 Argentina - Market size and forecast 2025-2030

Chart on Argentina - Market size and forecast 2025-2030 ($ million)
Data Table on Argentina - Market size and forecast 2025-2030 ($ million)
Chart on Argentina - Year-over-year growth 2025-2030 (%)
Data Table on Argentina - Year-over-year growth 2025-2030 (%)

12.7.3 Chile - Market size and forecast 2025-2030

Chart on Chile - Market size and forecast 2025-2030 ($ million)
Data Table on Chile - Market size and forecast 2025-2030 ($ million)
Chart on Chile - Year-over-year growth 2025-2030 (%)
Data Table on Chile - Year-over-year growth 2025-2030 (%)

12.8 Market opportunity by geography

Market opportunity by geography ($ million)
Data Tables on Market opportunity by geography ($ million)

13. Drivers, Challenges, and Opportunity

13.1 Market drivers

Integration of AI agent and ML in assessment frameworks
Proliferation of remote learning and hybrid educational models
Rising demand for skills-based certification and professional competency testing

13.2 Market challenges

Vulnerability in cybersecurity and data privacy infrastructure
Integrity risks posed by generative AI and academic misconduct
Technological disparities and financial burden of digital transformation

13.3 Impact of drivers and challenges

Impact of drivers and challenges in 2025 and 2030

13.4 Market opportunities

Shift toward gamified and immersive assessment environments
Growth of blockchain technology for secure and transparent academic verification
Implementation of multimodal biometrics and behavioral analytics in remote testing

14. Competitive Landscape

14.1 Overview

14.2

Overview on criticality of inputs and factors of differentiation

14.3 Landscape disruption

Overview on factors of disruption

14.4 Industry risks

Impact of key risks on business

15. Competitive Analysis

15.1 Companies profiled

Companies covered

15.2 Company ranking index

15.3 Market positioning of companies

Matrix on companies position and classification

15.4 Acadecraft Inc.

Acadecraft Inc. - Overview
Acadecraft Inc. - Product / Service
Acadecraft Inc. - Key offerings
SWOT

15.5 Apperson Inc.

Apperson Inc. - Overview
Apperson Inc. - Product / Service
Apperson Inc. - Key offerings
SWOT

15.6 Aptech Ltd.

Aptech Ltd. - Overview
Aptech Ltd. - Product / Service
Aptech Ltd. - Key offerings
SWOT

15.7 Assessment Systems

Assessment Systems - Overview
Assessment Systems - Product / Service
Assessment Systems - Key offerings
SWOT

15.8 Coursera Inc.

Coursera Inc. - Overview
Coursera Inc. - Business segments
Coursera Inc. - Key news
Coursera Inc. - Key offerings
Coursera Inc. - Segment focus
SWOT

15.9 ETS Global

ETS Global - Overview
ETS Global - Product / Service
ETS Global - Key offerings
SWOT

15.10 Harver B.V.

Harver B.V. - Overview
Harver B.V. - Product / Service
Harver B.V. - Key offerings
SWOT

15.11 Janison Education Group Ltd

Janison Education Group Ltd - Overview
Janison Education Group Ltd - Business segments
Janison Education Group Ltd - Key offerings
Janison Education Group Ltd - Segment focus
SWOT

15.12 Kaplan Inc.

Kaplan Inc. - Overview
Kaplan Inc. - Product / Service
Kaplan Inc. - Key offerings
SWOT

15.13 L and T EduTech.

L and T EduTech. - Overview
L and T EduTech. - Product / Service
L and T EduTech. - Key offerings
SWOT

15.14 McGraw Hill LLC

McGraw Hill LLC - Overview
McGraw Hill LLC - Product / Service
McGraw Hill LLC - Key news
McGraw Hill LLC - Key offerings
SWOT

15.15 Oxford Learning Centers Inc.

Oxford Learning Centers Inc. - Overview
Oxford Learning Centers Inc. - Product / Service
Oxford Learning Centers Inc. - Key offerings
SWOT

15.16 Pearson Plc

Pearson Plc - Overview
Pearson Plc - Business segments
Pearson Plc - Key news
Pearson Plc - Key offerings
Pearson Plc - Segment focus
SWOT

15.17 Prometric Inc.

Prometric Inc. - Overview
Prometric Inc. - Product / Service
Prometric Inc. - Key offerings
SWOT

15.18 Scantron Inc.

Scantron Inc. - Overview
Scantron Inc. - Product / Service
Scantron Inc. - Key offerings
SWOT

16. Appendix

16.1 Scope of the report

Market definition
Objectives
Notes and caveats

16.2 Inclusions and exclusions checklist

Inclusions checklist
Exclusions checklist

16.3 Currency conversion rates for US$

16.4 Research methodology

16.5 Data procurement

Information sources

16.6 Data validation

16.7 Validation techniques employed for market sizing

16.8 Data synthesis

16.9 360 degree market analysis

16.10 List of abbreviations

Research Methodology

Technavio presents a detailed picture of the market by way of study, synthesis, and summation of data from multiple sources. The analysts have presented the various facets of the market with a particular focus on identifying the key industry influencers. The data thus presented is comprehensive, reliable, and the result of extensive research, both primary and secondary.

INFORMATION SOURCES

Primary sources

  • Manufacturers and suppliers
  • Channel partners
  • Industry experts
  • Strategic decision makers

Secondary sources

  • Industry journals and periodicals
  • Government data
  • Financial reports of key industry players
  • Historical data
  • Press releases

DATA ANALYSIS

Data Synthesis

  • Collation of data
  • Estimation of key figures
  • Analysis of derived insights

Data Validation

  • Triangulation with data models
  • Reference against proprietary databases
  • Corroboration with industry experts

REPORT WRITING

Qualitative

  • Market drivers
  • Market challenges
  • Market trends
  • Five forces analysis

Quantitative

  • Market size and forecast
  • Market segmentation
  • Geographical insights
  • Competitive landscape

Interested in this report?

Get your sample now to see our research methodology and insights!

Download Now

Frequently Asked Questions

Higher Education Testing And Assessment market growth will increase by USD 8147.5 million during 2026-2030.

The Higher Education Testing And Assessment market is expected to grow at a CAGR of 6.7% during 2026-2030.

Higher Education Testing And Assessment market is segmented by Product (Academic, Non-academic) End-user (Educational institutions, Universities, Training organizations, Others) Delivery mode (Online, Offline)

Acadecraft Inc., Apperson Inc., Aptech Ltd., Assessment Systems, Coursera Inc., Ellucian Co., ETS Global, Harver B.V., Janison Education Group Ltd, Kaplan Inc., L and T EduTech., McGraw Hill LLC, Mercer LLC, Mindlogicx, Oxford Learning Centers Inc., Pearson Plc, ProctorU, Prometric Inc., QA Higher Education, Scantron Inc. are a few of the key vendors in the Higher Education Testing And Assessment market.

Europe will register the highest growth rate of 28.7% among the other regions. Therefore, the Higher Education Testing And Assessment market in Europe is expected to garner significant business opportunities for the vendors during the forecast period.

US, Canada, Mexico, Germany, UK, France, Italy, Spain, The Netherlands, China, Japan, India, South Korea, Australia, Indonesia, Saudi Arabia, UAE, South Africa, Israel, Turkey, Brazil, Argentina, Chile

  • Integration of AI agent and ML in assessment frameworks is the driving factor this market.

The Higher Education Testing And Assessment market vendors should focus on grabbing business opportunities from the Product segment as it accounted for the largest market share in the base year.
RIA - Research AI Assistant
Ask RIA