E-learning Market Analysis, Size, and Forecast 2026-2030: North America (US, Canada, and Mexico), Europe (Germany, UK, and France), APAC (China, Japan, and India), South America (Brazil, Argentina, and Colombia), Middle East and Africa (Saudi Arabia, UAE, and South Africa), and Rest of World (ROW)

E-learning Market Analysis, Size, and Forecast 2026-2030:
North America (US, Canada, and Mexico), Europe (Germany, UK, and France), APAC (China, Japan, and India), South America (Brazil, Argentina, and Colombia), Middle East and Africa (Saudi Arabia, UAE, and South Africa), and Rest of World (ROW)

Published: Mar 2026 290 Pages SKU: IRTNTR40436

Market Overview at a Glance

$549.00 B
Market Opportunity
24.2%
CAGR 2025 - 2030
37.8%
North America Growth
$135.51 B
Higher education segment 2024

E-learning Market Size 2026-2030

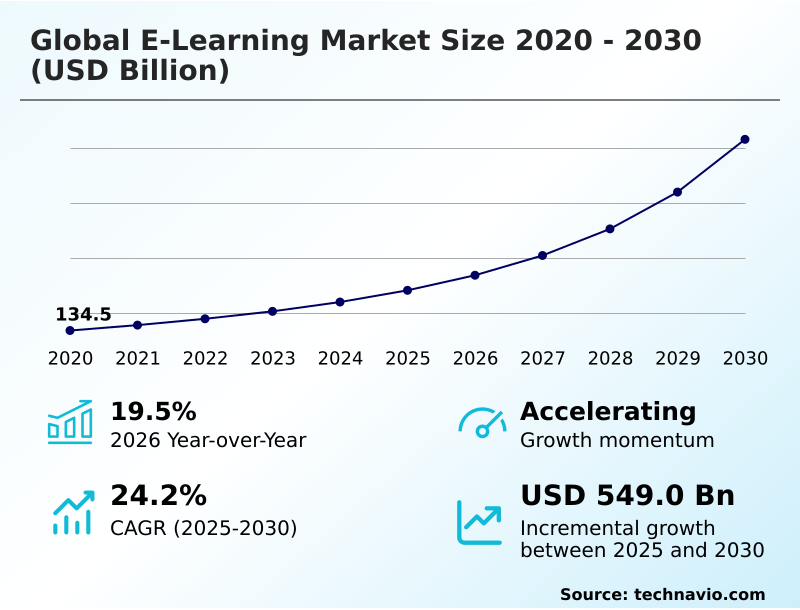
The e-learning market size is valued to increase by USD 549.00 billion, at a CAGR of 24.2% from 2025 to 2030. Enhanced learning outcomes through academic digital transformation will drive the e-learning market.

Major Market Trends & Insights

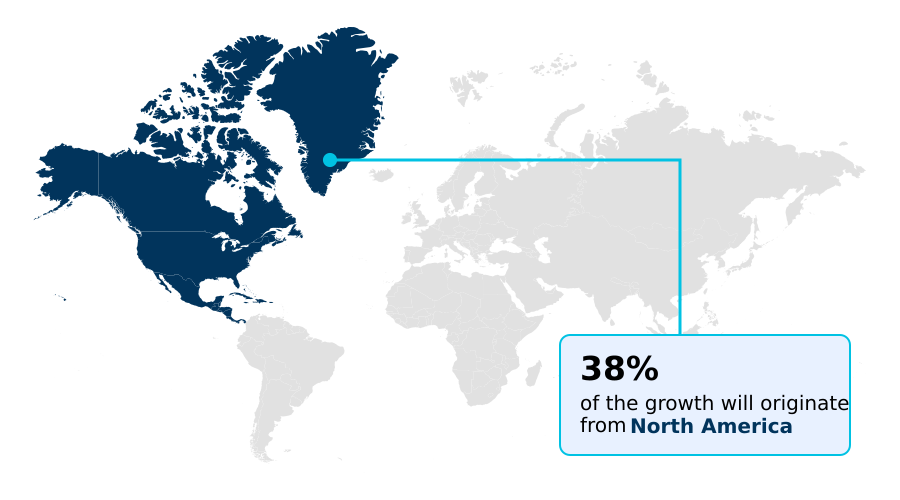
  • North America dominated the market and accounted for a 37.8% growth during the forecast period.
  • By End-user - Higher education segment was valued at USD 135.51 billion in 2024
  • By Deployment - On-premises segment accounted for the largest market revenue share in 2024

Market Size & Forecast

  • Market Opportunities: USD 695.16 billion
  • Market Future Opportunities: USD 549.00 billion
  • CAGR from 2025 to 2030 : 24.2%

Market Summary

  • The e-learning market is undergoing significant evolution, driven by technological advancements and shifting educational paradigms. Key drivers include the demand for cost-effective, scalable training and the continuous enhancement of learning outcomes through digital transformation. The integration of AI-powered personalization and adaptive learning technology in cloud-based e-learning platforms allows for customized educational experiences that cater to individual learner needs.
  • A prominent trend is the rise of microlearning modules, which provide short, focused content aligning with modern attention spans and the need for just-in-time knowledge. However, the market faces challenges from the growing adoption of open-source platforms and the expansion of in-house content development by institutions, which limits opportunities for commercial providers.
  • For instance, a global manufacturing firm can leverage a learning management system (LMS) with simulation-based training modules for corporate compliance training, ensuring consistent skill development across its geographically dispersed workforce while tracking completion rates to meet regulatory requirements.
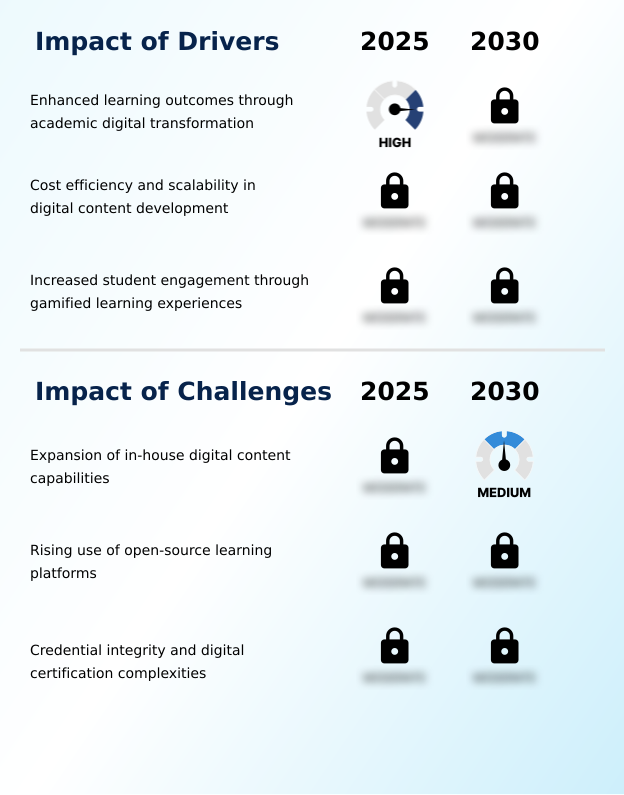
  • The move toward digital credentialing and gamified learning further enhances engagement, making online course platforms essential tools for both higher education online programs and corporate workforce reskilling.

What will be the Size of the E-learning Market during the forecast period?

Get Key Insights on Market Forecast (PDF) Request Free Sample

How is the E-learning Market Segmented?

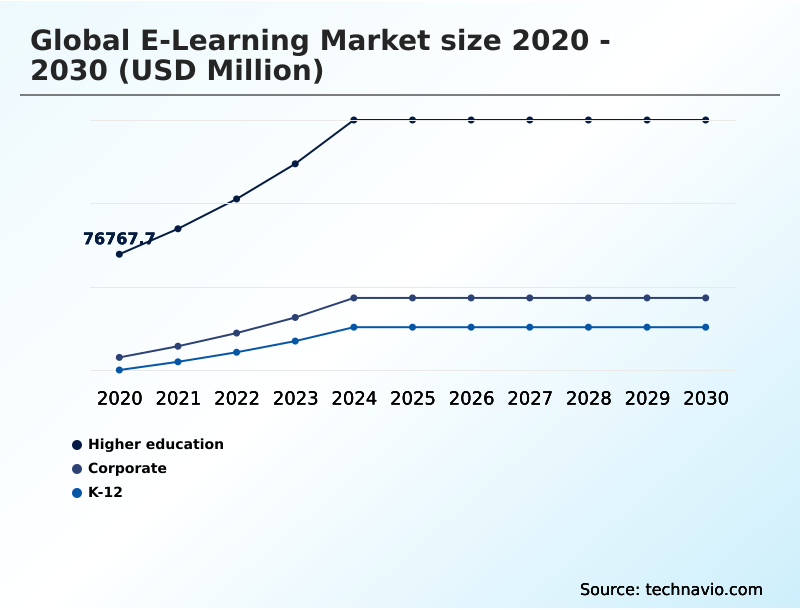
The e-learning industry research report provides comprehensive data (region-wise segment analysis), with forecasts and estimates in "USD million" for the period 2026-2030, as well as historical data from 2020-2024 for the following segments.

  • End-user
    • Higher education
    • Corporate
    • K-12
  • Deployment
    • On-premises
    • Cloud
  • Technology
    • Online e-learning
    • LMS
    • Others
  • Geography
    • North America
      • US
      • Canada
      • Mexico
    • Europe
      • Germany
      • UK
      • France
    • APAC
      • China
      • Japan
      • India
    • South America
      • Brazil
      • Argentina
      • Colombia
    • Middle East and Africa
      • Saudi Arabia
      • UAE
      • South Africa
    • Rest of World (ROW)

By End-user Insights

The higher education segment is estimated to witness significant growth during the forecast period.

The higher education segment is at the forefront of digital transformation, rapidly adopting higher education technology to deliver higher education online programs. Institutions are implementing blended learning models and creating personalized learning paths by leveraging effective instructional design.

The market is shifting towards microlearning modules and verifiable digital credentialing to meet student and employer demands. This involves integrating online learning tools and digital assessment tools with core student information systems (sis).

The use of ai-powered personalization to curate content from the e-learning content library is now critical, with some universities reporting a 15% improvement in student engagement metrics after implementation, extending these principles to enhance k-12 digital curriculum.

Request Free Sample

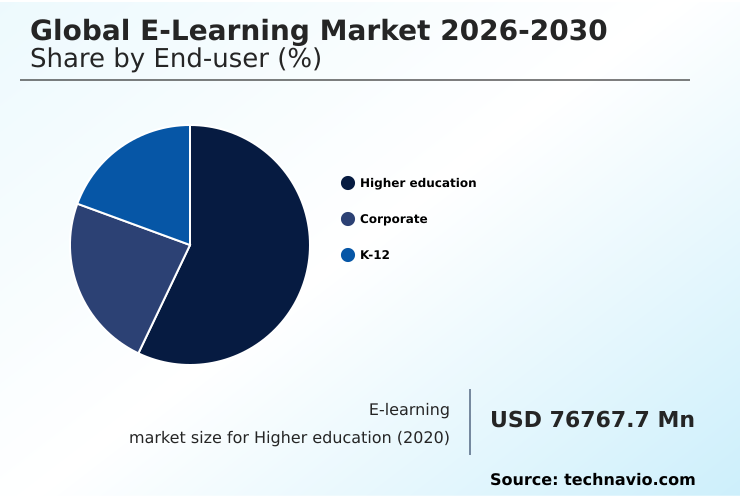
The Higher education segment was valued at USD 135.51 billion in 2024 and showed a gradual increase during the forecast period.

Request Free Sample

Regional Analysis

North America is estimated to contribute 37.8% to the growth of the global market during the forecast period.Technavio’s analysts have elaborately explained the regional trends and drivers that shape the market during the forecast period.

See How E-learning Market Demand is Rising in North America Request Free Sample

The geographic landscape is led by North America, which accounts for 37.8% of the market's incremental growth due to its mature infrastructure for cloud-based e-learning platforms and digital education solutions.

APAC is the fastest-growing region, driven by widespread adoption of mobile learning (m-learning) and remote learning platforms. In Europe, the focus is on quality and compliance, with strict e-learning accessibility standards.

Globally, online course platforms like Massive Open Online Courses (MOOCs) are democratizing education. The use of virtual classrooms and virtual training software is universal for both corporate and academic sectors.

The adoption of a Learning Experience Platform (LXP) is enhancing continuing professional development (cpd), while emerging technologies like augmented reality (ar) in education are creating new learning paradigms, especially within k-12 e-learning resources.

Market Dynamics

Our researchers analyzed the data with 2025 as the base year, along with the key drivers, trends, and challenges. A holistic analysis of drivers will help companies refine their marketing strategies to gain a competitive advantage.

  • Strategic decisions in the e-learning market are increasingly influenced by granular needs, moving beyond broad platform adoption. Organizations are now asking how to create engaging e-learning content to maximize learner retention.
  • The evaluation of the best e-learning platforms for small business focuses on scalability and affordability, while larger enterprises analyze the cost of implementing a learning management system and seek to integrating lms with human resources information system for streamlined operations. The benefits of gamification in corporate training are well-documented, with interactive approaches often yielding higher completion rates than traditional formats.
  • For specific use cases, e-learning solutions for employee onboarding and microlearning for just-in-time employee training are becoming standard. The push for practical skills is evident in the adoption of virtual reality for hands-on skills training, particularly in technical fields. In academia, blended learning models in university settings are becoming the norm.
  • The market is also addressing how to measuring roi of corporate e-learning programs and the challenges of implementing e-learning in k-12, such as digital equity. Security is a paramount concern, driving interest in how to securing e-learning platforms and learner data.
  • The rise of adaptive learning platforms for personalized education and using ai for personalized feedback in e-learning marks a shift towards smarter, more effective educational ecosystems.
  • Both commercial and open source learning management system comparison are common as institutions seek the best fit, alongside the need for robust solutions for e-learning for professional certification and compliance and tools for developing scorm compliant e-learning courses.
  • Finally, platform accessibility is key, leading to searches for e-learning content authoring tools for mac to support diverse creator environments and developing effective mobile learning strategies for a remote workforce.

What are the key market drivers leading to the rise in the adoption of E-learning Industry?

  • Enhanced learning outcomes achieved through academic digital transformation are a key driver propelling market growth.

  • The primary driver is the urgent need for efficient workforce reskilling, addressed through e-learning for corporate training. Organizations using employee training software for corporate compliance training report a 50% reduction in associated administrative costs.
  • The demand for flexible asynchronous learning options supports continuous upskilling through online certification programs and professional development courses. Effective digital content development and custom e-learning development allow companies to conduct detailed skills gap analysis and deploy targeted competency-based education.
  • Furthermore, streamlined employee onboarding platforms are crucial for talent retention. These initiatives are managed through integrated enterprise learning management systems, which provide the backbone for scalable corporate education strategies and talent development, ensuring workforce readiness.

What are the market trends shaping the E-learning Industry?

  • The expansion of microlearning as a preferred digital education format is emerging as a significant market trend. This approach delivers concise, targeted content modules to align with modern learner preferences for flexible, self-paced instruction.

  • A key trend is the fusion of gamified learning with corporate education, where gamification in corporate training has been shown to boost completion rates by over 30%. The use of virtual reality (vr) training and simulation-based training for complex skills development is increasing, reducing on-the-job errors by up to 40%.
  • Adaptive learning technology is being used to create highly personalized interactive learning content. Platforms are focusing on learner engagement metrics, tracked via learning analytics dashboards, and are integrating social learning features to foster collaborative social learning networks.
  • The creation of this content is streamlined through advanced content authoring tools and a focus on blended instructional design, often incorporating popular video-based learning formats for maximum impact.

What challenges does the E-learning Industry face during its growth?

  • The expansion of in-house digital content development capabilities by educational institutions presents a key challenge to market growth.

  • A significant market challenge is the rise of Open Educational Resources (OER) and freely available Corporate MOOCs, which intensify price competition for commercial vendors. Ensuring content adheres to interoperability standards like SCORM and xAPI across different Learning Management Systems (LMS) adds complexity, while failing to meet e-learning accessibility standards can result in penalties.
  • While synchronous learning platforms and online tutoring services offer real-time interaction, they present scalability challenges. The effectiveness of informal peer-to-peer learning is difficult to quantify with traditional assessment and analytics.
  • Furthermore, specialized content, such as virtual science labs and language learning apps, requires significant investment, and optimizing for mobile-first learning adds another layer of development cost, with some providers seeing a 20% increase in production expenses.

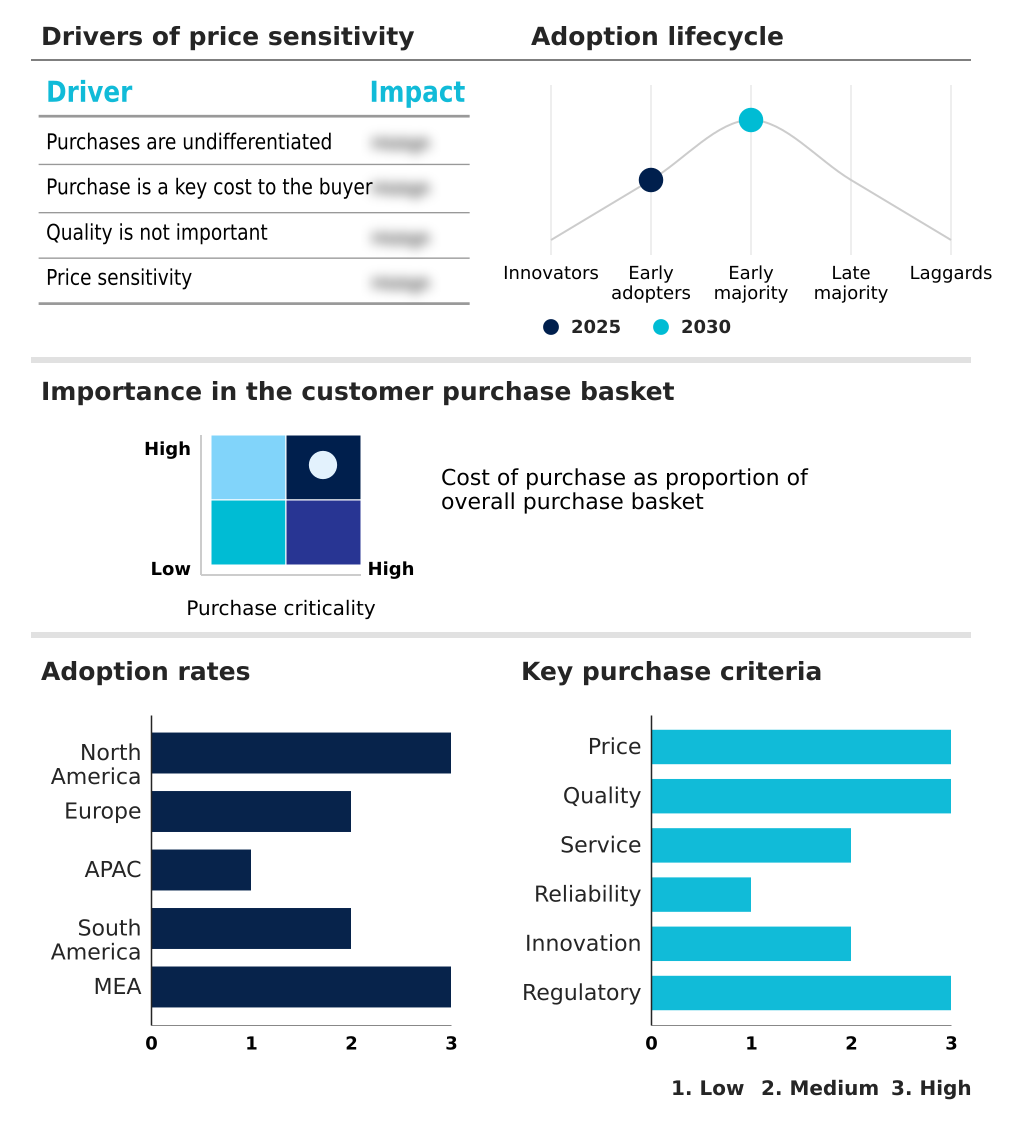
Exclusive Technavio Analysis on Customer Landscape

The e-learning market forecasting report includes the adoption lifecycle of the market, covering from the innovator’s stage to the laggard’s stage. It focuses on adoption rates in different regions based on penetration. Furthermore, the e-learning market report also includes key purchase criteria and drivers of price sensitivity to help companies evaluate and develop their market growth analysis strategies.

Customer Landscape of E-learning Industry

Competitive Landscape

Companies are implementing various strategies, such as strategic alliances, e-learning market forecast, partnerships, mergers and acquisitions, geographical expansion, and product/service launches, to enhance their presence in the industry.

2U Inc. - Key offerings facilitate the online delivery of degree and alternative credential programs by providing technology and services to non-profit colleges and universities.

The industry research and growth report includes detailed analyses of the competitive landscape of the market and information about key companies, including:

  • 2U Inc.
  • Aptara Inc.
  • Berlitz Corp.
  • Chegg Inc.
  • Cornerstone OnDemand Inc.
  • Coursera Inc.
  • D2L Corp.
  • Docebo Inc.
  • Google LLC
  • Instructure Holdings Inc.
  • Microsoft Corp.
  • Pearson Plc
  • Pluralsight LLC
  • Sanako
  • SAP SE
  • Skillsoft Corp.
  • Udacity Inc.
  • Udemy Inc.

Qualitative and quantitative analysis of companies has been conducted to help clients understand the wider business environment as well as the strengths and weaknesses of key industry players. Data is qualitatively analyzed to categorize companies as pure play, category-focused, industry-focused, and diversified; it is quantitatively analyzed to categorize companies as dominant, leading, strong, tentative, and weak.

Recent Development and News in E-learning market

  • In August 2024, Accenture and Google Cloud expanded their strategic alliance to accelerate enterprise AI adoption, helping clients scale generative AI projects and strengthen cybersecurity protections.
  • In December 2024, Coursera announced a significant expansion of its generative AI catalog, adding over 450 new courses during the year to meet strong global learner demand for AI-related skills.
  • In March 2025, the European Union-funded Future4Alliances project was launched to support the development and structuring of European Universities alliances, aiming to create favorable legislative and technical environments for joint educational programs.
  • In May 2025, the World Economic Forum emphasized that AI literacy is crucial for strategic transformation, highlighting the need for individuals and organizations to acquire skills for responsible and transparent AI use.

Dive into Technavio’s robust research methodology, blending expert interviews, extensive data synthesis, and validated models for unparalleled E-learning Market insights. See full methodology.

Market Scope
Page number 290
Base year 2025
Historic period 2020-2024
Forecast period 2026-2030
Growth momentum & CAGR Accelerate at a CAGR of 24.2%
Market growth 2026-2030 USD 549004.4 million
Market structure Fragmented
YoY growth 2025-2026(%) 19.5%
Key countries US, Canada, Mexico, Germany, UK, France, Italy, Spain, The Netherlands, China, Japan, India, South Korea, Australia, Indonesia, Brazil, Argentina, Colombia, Saudi Arabia, UAE, South Africa, Israel and Turkey
Competitive landscape Leading Companies, Market Positioning of Companies, Competitive Strategies, and Industry Risks

Request Free Sample

Research Analyst Overview

  • The e-learning market is defined by its continuous evolution, moving beyond simple content delivery to integrated ecosystems. The adoption of Learning Management Systems (LMS) and Learning Experience Platform (LXP) is now standard for both corporate compliance training and higher education online programs.
  • A key trend influencing boardroom decisions is the strategic use of assessment and analytics to measure the impact of training on business goals, with some firms reporting a 15% increase in team performance after implementing targeted workforce reskilling programs. This data-driven approach is enabled by AI-powered personalization and adaptive learning technology.
  • The content landscape is shifting towards microlearning modules and gamified learning to improve engagement. Technologies like Virtual Reality (VR) training and Augmented Reality (AR) in education are creating immersive experiences. The market relies on standards like SCORM and xAPI for interoperability.
  • The development of K-12 digital curriculum and Massive Open Online Courses (MOOCs) is expanding access, while cloud-based e-learning platforms provide scalability. From instructional design using content authoring tools to ensuring digital credentialing integrity, the focus is on creating effective, measurable learning outcomes through both synchronous learning in virtual classrooms and flexible asynchronous learning.
  • This ecosystem also leverages Open Educational Resources (OER) and social learning features to build comprehensive learning communities and address skills gap analysis.

What are the Key Data Covered in this E-learning Market Research and Growth Report?

  • What is the expected growth of the E-learning Market between 2026 and 2030?

    • USD 549.00 billion, at a CAGR of 24.2%

  • What segmentation does the market report cover?

    • The report is segmented by End-user (Higher education, Corporate, and K-12), Deployment (On-premises, and Cloud), Technology (Online e-learning, LMS, and Others) and Geography (North America, Europe, APAC, South America, Middle East and Africa)

  • Which regions are analyzed in the report?

    • North America, Europe, APAC, South America and Middle East and Africa

  • What are the key growth drivers and market challenges?

    • Enhanced learning outcomes through academic digital transformation, Expansion of in-house digital content capabilities

  • Who are the major players in the E-learning Market?

    • 2U Inc., Aptara Inc., Berlitz Corp., Chegg Inc., Cornerstone OnDemand Inc., Coursera Inc., D2L Corp., Docebo Inc., Google LLC, Instructure Holdings Inc., Microsoft Corp., Pearson Plc, Pluralsight LLC, Sanako, SAP SE, Skillsoft Corp., Udacity Inc. and Udemy Inc.

Market Research Insights

  • The market's dynamics are shaped by a rising demand for flexible and efficient training, with organizations increasingly adopting digital education solutions. The use of e-learning for corporate training has been shown to improve employee engagement by up to 18% compared to traditional methods.
  • Enterprise learning management systems now offer personalized learning paths, leading to a 25% faster completion rate for mandatory compliance courses. The shift toward remote learning platforms is supported by a growing preference for video-based learning and mobile-first learning formats.
  • Furthermore, the integration of digital assessment tools and learning analytics dashboards enables institutions to track performance effectively, with some reporting a 15% improvement in identifying at-risk students. This data-driven approach allows for continuous refinement of interactive learning content, ensuring higher returns on educational investments across both academic and corporate sectors.

We can help! Our analysts can customize this e-learning market research report to meet your requirements.

Get in touch

1. Executive Summary

1.1 Market overview

Executive Summary - Chart on Market Overview
Executive Summary - Data Table on Market Overview
Executive Summary - Chart on Global Market Characteristics
Executive Summary - Chart on Market by Geography
Executive Summary - Chart on Market Segmentation by End-user
Executive Summary - Chart on Market Segmentation by Deployment
Executive Summary - Chart on Market Segmentation by Technology
Executive Summary - Chart on Incremental Growth
Executive Summary - Data Table on Incremental Growth
Executive Summary - Chart on Company Market Positioning

2. Technavio Analysis

2.1 Analysis of price sensitivity, lifecycle, customer purchase basket, adoption rates, and purchase criteria

2.2 Criticality of inputs and Factors of differentiation

Chart on Overview on criticality of inputs and factors of differentiation

2.3 Factors of disruption

Chart on Overview on factors of disruption

2.4 Impact of drivers and challenges

Chart on Impact of drivers and challenges in 2025 and 2030

3. Market Landscape

3.1 Market ecosystem

Chart on Parent Market
Data Table on - Parent Market

3.2 Market characteristics

Chart on Market characteristics analysis

3.3 Value chain analysis

Chart on Value chain analysis

4. Market Sizing

4.1 Market definition

Data Table on Offerings of companies included in the market definition

4.2 Market segment analysis

Market segments

4.3 Market size 2025

4.4 Market outlook: Forecast for 2025-2030

Chart on Global - Market size and forecast 2025-2030 ($ million)
Data Table on Global - Market size and forecast 2025-2030 ($ million)
Chart on Global Market: Year-over-year growth 2025-2030 (%)
Data Table on Global Market: Year-over-year growth 2025-2030 (%)

5. Historic Market Size

5.1 Global E-Learning Market 2020 - 2024

Historic Market Size - Data Table on Global E-Learning Market 2020 - 2024 ($ million)

5.2 End-user segment analysis 2020 - 2024

Historic Market Size - End-user Segment 2020 - 2024 ($ million)

5.3 Deployment segment analysis 2020 - 2024

Historic Market Size - Deployment Segment 2020 - 2024 ($ million)

5.4 Technology segment analysis 2020 - 2024

Historic Market Size - Technology Segment 2020 - 2024 ($ million)

5.5 Geography segment analysis 2020 - 2024

Historic Market Size - Geography Segment 2020 - 2024 ($ million)

5.6 Country segment analysis 2020 - 2024

Historic Market Size - Country Segment 2020 - 2024 ($ million)

6. Qualitative Analysis

6.1 Impact of AI on the Global E-learning Market

7. Five Forces Analysis

7.1 Five forces summary

Five forces analysis - Comparison between 2025 and 2030

7.2 Bargaining power of buyers

Bargaining power of buyers - Impact of key factors 2025 and 2030

7.3 Bargaining power of suppliers

Bargaining power of suppliers - Impact of key factors in 2025 and 2030

7.4 Threat of new entrants

Threat of new entrants - Impact of key factors in 2025 and 2030

7.5 Threat of substitutes

Threat of substitutes - Impact of key factors in 2025 and 2030

7.6 Threat of rivalry

Threat of rivalry - Impact of key factors in 2025 and 2030

7.7 Market condition

Chart on Market condition - Five forces 2025 and 2030

8. Market Segmentation by End-user

8.1 Market segments

Chart on End-user - Market share 2025-2030 (%)
Data Table on End-user - Market share 2025-2030 (%)

8.2 Comparison by End-user

Chart on Comparison by End-user
Data Table on Comparison by End-user

8.3 Higher education - Market size and forecast 2025-2030

Chart on Higher education - Market size and forecast 2025-2030 ($ million)
Data Table on Higher education - Market size and forecast 2025-2030 ($ million)
Chart on Higher education - Year-over-year growth 2025-2030 (%)
Data Table on Higher education - Year-over-year growth 2025-2030 (%)

8.4 Corporate - Market size and forecast 2025-2030

Chart on Corporate - Market size and forecast 2025-2030 ($ million)
Data Table on Corporate - Market size and forecast 2025-2030 ($ million)
Chart on Corporate - Year-over-year growth 2025-2030 (%)
Data Table on Corporate - Year-over-year growth 2025-2030 (%)

8.5 K-12 - Market size and forecast 2025-2030

Chart on K-12 - Market size and forecast 2025-2030 ($ million)
Data Table on K-12 - Market size and forecast 2025-2030 ($ million)
Chart on K-12 - Year-over-year growth 2025-2030 (%)
Data Table on K-12 - Year-over-year growth 2025-2030 (%)

8.6 Market opportunity by End-user

Market opportunity by End-user ($ million)
Data Table on Market opportunity by End-user ($ million)

9. Market Segmentation by Deployment

9.1 Market segments

Chart on Deployment - Market share 2025-2030 (%)
Data Table on Deployment - Market share 2025-2030 (%)

9.2 Comparison by Deployment

Chart on Comparison by Deployment
Data Table on Comparison by Deployment

9.3 On-premises - Market size and forecast 2025-2030

Chart on On-premises - Market size and forecast 2025-2030 ($ million)
Data Table on On-premises - Market size and forecast 2025-2030 ($ million)
Chart on On-premises - Year-over-year growth 2025-2030 (%)
Data Table on On-premises - Year-over-year growth 2025-2030 (%)

9.4 Cloud - Market size and forecast 2025-2030

Chart on Cloud - Market size and forecast 2025-2030 ($ million)
Data Table on Cloud - Market size and forecast 2025-2030 ($ million)
Chart on Cloud - Year-over-year growth 2025-2030 (%)
Data Table on Cloud - Year-over-year growth 2025-2030 (%)

9.5 Market opportunity by Deployment

Market opportunity by Deployment ($ million)
Data Table on Market opportunity by Deployment ($ million)

10. Market Segmentation by Technology

10.1 Market segments

Chart on Technology - Market share 2025-2030 (%)
Data Table on Technology - Market share 2025-2030 (%)

10.2 Comparison by Technology

Chart on Comparison by Technology
Data Table on Comparison by Technology

10.3 Online e-learning - Market size and forecast 2025-2030

Chart on Online e-learning - Market size and forecast 2025-2030 ($ million)
Data Table on Online e-learning - Market size and forecast 2025-2030 ($ million)
Chart on Online e-learning - Year-over-year growth 2025-2030 (%)
Data Table on Online e-learning - Year-over-year growth 2025-2030 (%)

10.4 LMS - Market size and forecast 2025-2030

Chart on LMS - Market size and forecast 2025-2030 ($ million)
Data Table on LMS - Market size and forecast 2025-2030 ($ million)
Chart on LMS - Year-over-year growth 2025-2030 (%)
Data Table on LMS - Year-over-year growth 2025-2030 (%)

10.5 Others - Market size and forecast 2025-2030

Chart on Others - Market size and forecast 2025-2030 ($ million)
Data Table on Others - Market size and forecast 2025-2030 ($ million)
Chart on Others - Year-over-year growth 2025-2030 (%)
Data Table on Others - Year-over-year growth 2025-2030 (%)

10.6 Market opportunity by Technology

Market opportunity by Technology ($ million)
Data Table on Market opportunity by Technology ($ million)

11. Customer Landscape

11.1 Customer landscape overview

Analysis of price sensitivity, lifecycle, customer purchase basket, adoption rates, and purchase criteria

12. Geographic Landscape

12.1 Geographic segmentation

Chart on Market share by geography 2025-2030 (%)
Data Table on Market share by geography 2025-2030 (%)

12.2 Geographic comparison

Chart on Geographic comparison
Data Table on Geographic comparison

12.3 North America - Market size and forecast 2025-2030

Chart on North America - Market size and forecast 2025-2030 ($ million)
Data Table on North America - Market size and forecast 2025-2030 ($ million)
Chart on North America - Year-over-year growth 2025-2030 (%)
Data Table on North America - Year-over-year growth 2025-2030 (%)
Chart on Regional Comparison - North America
Data Table on Regional Comparison - North America

12.3.1 US - Market size and forecast 2025-2030

Chart on US - Market size and forecast 2025-2030 ($ million)
Data Table on US - Market size and forecast 2025-2030 ($ million)
Chart on US - Year-over-year growth 2025-2030 (%)
Data Table on US - Year-over-year growth 2025-2030 (%)

12.3.2 Canada - Market size and forecast 2025-2030

Chart on Canada - Market size and forecast 2025-2030 ($ million)
Data Table on Canada - Market size and forecast 2025-2030 ($ million)
Chart on Canada - Year-over-year growth 2025-2030 (%)
Data Table on Canada - Year-over-year growth 2025-2030 (%)

12.3.3 Mexico - Market size and forecast 2025-2030

Chart on Mexico - Market size and forecast 2025-2030 ($ million)
Data Table on Mexico - Market size and forecast 2025-2030 ($ million)
Chart on Mexico - Year-over-year growth 2025-2030 (%)
Data Table on Mexico - Year-over-year growth 2025-2030 (%)

12.4 Europe - Market size and forecast 2025-2030

Chart on Europe - Market size and forecast 2025-2030 ($ million)
Data Table on Europe - Market size and forecast 2025-2030 ($ million)
Chart on Europe - Year-over-year growth 2025-2030 (%)
Data Table on Europe - Year-over-year growth 2025-2030 (%)
Chart on Regional Comparison - Europe
Data Table on Regional Comparison - Europe

12.4.1 Germany - Market size and forecast 2025-2030

Chart on Germany - Market size and forecast 2025-2030 ($ million)
Data Table on Germany - Market size and forecast 2025-2030 ($ million)
Chart on Germany - Year-over-year growth 2025-2030 (%)
Data Table on Germany - Year-over-year growth 2025-2030 (%)

12.4.2 UK - Market size and forecast 2025-2030

Chart on UK - Market size and forecast 2025-2030 ($ million)
Data Table on UK - Market size and forecast 2025-2030 ($ million)
Chart on UK - Year-over-year growth 2025-2030 (%)
Data Table on UK - Year-over-year growth 2025-2030 (%)

12.4.3 France - Market size and forecast 2025-2030

Chart on France - Market size and forecast 2025-2030 ($ million)
Data Table on France - Market size and forecast 2025-2030 ($ million)
Chart on France - Year-over-year growth 2025-2030 (%)
Data Table on France - Year-over-year growth 2025-2030 (%)

12.4.4 Italy - Market size and forecast 2025-2030

Chart on Italy - Market size and forecast 2025-2030 ($ million)
Data Table on Italy - Market size and forecast 2025-2030 ($ million)
Chart on Italy - Year-over-year growth 2025-2030 (%)
Data Table on Italy - Year-over-year growth 2025-2030 (%)

12.4.5 Spain - Market size and forecast 2025-2030

Chart on Spain - Market size and forecast 2025-2030 ($ million)
Data Table on Spain - Market size and forecast 2025-2030 ($ million)
Chart on Spain - Year-over-year growth 2025-2030 (%)
Data Table on Spain - Year-over-year growth 2025-2030 (%)

12.4.6 The Netherlands - Market size and forecast 2025-2030

Chart on The Netherlands - Market size and forecast 2025-2030 ($ million)
Data Table on The Netherlands - Market size and forecast 2025-2030 ($ million)
Chart on The Netherlands - Year-over-year growth 2025-2030 (%)
Data Table on The Netherlands - Year-over-year growth 2025-2030 (%)

12.5 APAC - Market size and forecast 2025-2030

Chart on APAC - Market size and forecast 2025-2030 ($ million)
Data Table on APAC - Market size and forecast 2025-2030 ($ million)
Chart on APAC - Year-over-year growth 2025-2030 (%)
Data Table on APAC - Year-over-year growth 2025-2030 (%)
Chart on Regional Comparison - APAC
Data Table on Regional Comparison - APAC

12.5.1 China - Market size and forecast 2025-2030

Chart on China - Market size and forecast 2025-2030 ($ million)
Data Table on China - Market size and forecast 2025-2030 ($ million)
Chart on China - Year-over-year growth 2025-2030 (%)
Data Table on China - Year-over-year growth 2025-2030 (%)

12.5.2 Japan - Market size and forecast 2025-2030

Chart on Japan - Market size and forecast 2025-2030 ($ million)
Data Table on Japan - Market size and forecast 2025-2030 ($ million)
Chart on Japan - Year-over-year growth 2025-2030 (%)
Data Table on Japan - Year-over-year growth 2025-2030 (%)

12.5.3 India - Market size and forecast 2025-2030

Chart on India - Market size and forecast 2025-2030 ($ million)
Data Table on India - Market size and forecast 2025-2030 ($ million)
Chart on India - Year-over-year growth 2025-2030 (%)
Data Table on India - Year-over-year growth 2025-2030 (%)

12.5.4 South Korea - Market size and forecast 2025-2030

Chart on South Korea - Market size and forecast 2025-2030 ($ million)
Data Table on South Korea - Market size and forecast 2025-2030 ($ million)
Chart on South Korea - Year-over-year growth 2025-2030 (%)
Data Table on South Korea - Year-over-year growth 2025-2030 (%)

12.5.5 Australia - Market size and forecast 2025-2030

Chart on Australia - Market size and forecast 2025-2030 ($ million)
Data Table on Australia - Market size and forecast 2025-2030 ($ million)
Chart on Australia - Year-over-year growth 2025-2030 (%)
Data Table on Australia - Year-over-year growth 2025-2030 (%)

12.5.6 Indonesia - Market size and forecast 2025-2030

Chart on Indonesia - Market size and forecast 2025-2030 ($ million)
Data Table on Indonesia - Market size and forecast 2025-2030 ($ million)
Chart on Indonesia - Year-over-year growth 2025-2030 (%)
Data Table on Indonesia - Year-over-year growth 2025-2030 (%)

12.6 South America - Market size and forecast 2025-2030

Chart on South America - Market size and forecast 2025-2030 ($ million)
Data Table on South America - Market size and forecast 2025-2030 ($ million)
Chart on South America - Year-over-year growth 2025-2030 (%)
Data Table on South America - Year-over-year growth 2025-2030 (%)
Chart on Regional Comparison - South America
Data Table on Regional Comparison - South America

12.6.1 Brazil - Market size and forecast 2025-2030

Chart on Brazil - Market size and forecast 2025-2030 ($ million)
Data Table on Brazil - Market size and forecast 2025-2030 ($ million)
Chart on Brazil - Year-over-year growth 2025-2030 (%)
Data Table on Brazil - Year-over-year growth 2025-2030 (%)

12.6.2 Argentina - Market size and forecast 2025-2030

Chart on Argentina - Market size and forecast 2025-2030 ($ million)
Data Table on Argentina - Market size and forecast 2025-2030 ($ million)
Chart on Argentina - Year-over-year growth 2025-2030 (%)
Data Table on Argentina - Year-over-year growth 2025-2030 (%)

12.6.3 Colombia - Market size and forecast 2025-2030

Chart on Colombia - Market size and forecast 2025-2030 ($ million)
Data Table on Colombia - Market size and forecast 2025-2030 ($ million)
Chart on Colombia - Year-over-year growth 2025-2030 (%)
Data Table on Colombia - Year-over-year growth 2025-2030 (%)

12.7 Middle East and Africa - Market size and forecast 2025-2030

Chart on Middle East and Africa - Market size and forecast 2025-2030 ($ million)
Data Table on Middle East and Africa - Market size and forecast 2025-2030 ($ million)
Chart on Middle East and Africa - Year-over-year growth 2025-2030 (%)
Data Table on Middle East and Africa - Year-over-year growth 2025-2030 (%)
Chart on Regional Comparison - Middle East and Africa
Data Table on Regional Comparison - Middle East and Africa

12.7.1 Saudi Arabia - Market size and forecast 2025-2030

Chart on Saudi Arabia - Market size and forecast 2025-2030 ($ million)
Data Table on Saudi Arabia - Market size and forecast 2025-2030 ($ million)
Chart on Saudi Arabia - Year-over-year growth 2025-2030 (%)
Data Table on Saudi Arabia - Year-over-year growth 2025-2030 (%)

12.7.2 UAE - Market size and forecast 2025-2030

Chart on UAE - Market size and forecast 2025-2030 ($ million)
Data Table on UAE - Market size and forecast 2025-2030 ($ million)
Chart on UAE - Year-over-year growth 2025-2030 (%)
Data Table on UAE - Year-over-year growth 2025-2030 (%)

12.7.3 South Africa - Market size and forecast 2025-2030

Chart on South Africa - Market size and forecast 2025-2030 ($ million)
Data Table on South Africa - Market size and forecast 2025-2030 ($ million)
Chart on South Africa - Year-over-year growth 2025-2030 (%)
Data Table on South Africa - Year-over-year growth 2025-2030 (%)

12.7.4 Israel - Market size and forecast 2025-2030

Chart on Israel - Market size and forecast 2025-2030 ($ million)
Data Table on Israel - Market size and forecast 2025-2030 ($ million)
Chart on Israel - Year-over-year growth 2025-2030 (%)
Data Table on Israel - Year-over-year growth 2025-2030 (%)

12.7.5 Turkey - Market size and forecast 2025-2030

Chart on Turkey - Market size and forecast 2025-2030 ($ million)
Data Table on Turkey - Market size and forecast 2025-2030 ($ million)
Chart on Turkey - Year-over-year growth 2025-2030 (%)
Data Table on Turkey - Year-over-year growth 2025-2030 (%)

12.8 Market opportunity by geography

Market opportunity by geography ($ million)
Data Tables on Market opportunity by geography ($ million)

13. Drivers, Challenges, and Opportunity

13.1 Market drivers

Enhanced learning outcomes through academic digital transformation
Cost efficiency and scalability in digital content development
Increased student engagement through gamified learning experiences

13.2 Market challenges

Expansion of in-house digital content capabilities
Rising use of open-source learning platforms
Credential integrity and digital certification complexities

13.3 Impact of drivers and challenges

Impact of drivers and challenges in 2025 and 2030

13.4 Market opportunities

Expansion of microlearning as preferred digital education format
Increasing reliance on cloud-based platforms in academic e-learning
Integration of industry 4.0 technologies into digital learning ecosystems

14. Competitive Landscape

14.1 Overview

14.2

Overview on criticality of inputs and factors of differentiation

14.3 Landscape disruption

Overview on factors of disruption

14.4 Industry risks

Impact of key risks on business

15. Competitive Analysis

15.1 Companies profiled

Companies covered

15.2 Company ranking index

15.3 Market positioning of companies

Matrix on companies position and classification

15.4 2U Inc.

2U Inc. - Overview
2U Inc. - Business segments
2U Inc. - Key offerings
2U Inc. - Segment focus
SWOT

15.5 Aptara Inc.

Aptara Inc. - Overview
Aptara Inc. - Product / Service
Aptara Inc. - Key offerings
SWOT

15.6 Berlitz Corp.

Berlitz Corp. - Overview
Berlitz Corp. - Product / Service
Berlitz Corp. - Key offerings
SWOT

15.7 Chegg Inc.

Chegg Inc. - Overview
Chegg Inc. - Product / Service
Chegg Inc. - Key news
Chegg Inc. - Key offerings
SWOT

15.8 Cornerstone OnDemand Inc.

Cornerstone OnDemand Inc. - Overview
Cornerstone OnDemand Inc. - Product / Service
Cornerstone OnDemand Inc. - Key news
Cornerstone OnDemand Inc. - Key offerings
SWOT

15.9 D2L Corp.

D2L Corp. - Overview
D2L Corp. - Product / Service
D2L Corp. - Key news
D2L Corp. - Key offerings
SWOT

15.10 Google LLC

Google LLC - Overview
Google LLC - Product / Service
Google LLC - Key offerings
SWOT

15.11 Instructure Holdings Inc.

Instructure Holdings Inc. - Overview
Instructure Holdings Inc. - Product / Service
Instructure Holdings Inc. - Key news
Instructure Holdings Inc. - Key offerings
SWOT

15.12 Microsoft Corp.

Microsoft Corp. - Overview
Microsoft Corp. - Business segments
Microsoft Corp. - Key news
Microsoft Corp. - Key offerings
Microsoft Corp. - Segment focus
SWOT

15.13 Pearson Plc

Pearson Plc - Overview
Pearson Plc - Business segments
Pearson Plc - Key news
Pearson Plc - Key offerings
Pearson Plc - Segment focus
SWOT

15.14 Pluralsight LLC

Pluralsight LLC - Overview
Pluralsight LLC - Product / Service
Pluralsight LLC - Key offerings
SWOT

15.15 Sanako

Sanako - Overview
Sanako - Product / Service
Sanako - Key offerings
SWOT

15.16 SAP SE

SAP SE - Overview
SAP SE - Business segments
SAP SE - Key news
SAP SE - Key offerings
SAP SE - Segment focus
SWOT

15.17 Skillsoft Corp.

Skillsoft Corp. - Overview
Skillsoft Corp. - Business segments
Skillsoft Corp. - Key news
Skillsoft Corp. - Key offerings
Skillsoft Corp. - Segment focus
SWOT

15.18 Udemy Inc.

Udemy Inc. - Overview
Udemy Inc. - Business segments
Udemy Inc. - Key news
Udemy Inc. - Key offerings
Udemy Inc. - Segment focus
SWOT

16. Appendix

16.1 Scope of the report

Market definition
Objectives
Notes and caveats

16.2 Inclusions and exclusions checklist

Inclusions checklist
Exclusions checklist

16.3 Currency conversion rates for US$

16.4 Research methodology

16.5 Data procurement

Information sources

16.6 Data validation

16.7 Validation techniques employed for market sizing

16.8 Data synthesis

16.9 360 degree market analysis

16.10 List of abbreviations

Research Methodology

Technavio presents a detailed picture of the market by way of study, synthesis, and summation of data from multiple sources. The analysts have presented the various facets of the market with a particular focus on identifying the key industry influencers. The data thus presented is comprehensive, reliable, and the result of extensive research, both primary and secondary.

INFORMATION SOURCES

Primary sources

  • Manufacturers and suppliers
  • Channel partners
  • Industry experts
  • Strategic decision makers

Secondary sources

  • Industry journals and periodicals
  • Government data
  • Financial reports of key industry players
  • Historical data
  • Press releases

DATA ANALYSIS

Data Synthesis

  • Collation of data
  • Estimation of key figures
  • Analysis of derived insights

Data Validation

  • Triangulation with data models
  • Reference against proprietary databases
  • Corroboration with industry experts

REPORT WRITING

Qualitative

  • Market drivers
  • Market challenges
  • Market trends
  • Five forces analysis

Quantitative

  • Market size and forecast
  • Market segmentation
  • Geographical insights
  • Competitive landscape

Interested in this report?

Get your sample now to see our research methodology and insights!

Download Now

Frequently Asked Questions

E-learning market growth will increase by USD 549004.4 million during 2026-2030.

The E-learning market is expected to grow at a CAGR of 24.2% during 2026-2030.

E-learning market is segmented by End-user (Higher education, Corporate, K-12) Deployment (On-premises, Cloud) Technology (Online e-learning, LMS, Others)

2U Inc., Aptara Inc., Berlitz Corp., Chegg Inc., Cornerstone OnDemand Inc., Coursera Inc., D2L Corp., Docebo Inc., Google LLC, Instructure Holdings Inc., Microsoft Corp., Pearson Plc, Pluralsight LLC, Sanako, SAP SE, Skillsoft Corp., Udacity Inc., Udemy Inc. are a few of the key vendors in the E-learning market.

North America will register the highest growth rate of 37.8% among the other regions. Therefore, the E-learning market in North America is expected to garner significant business opportunities for the vendors during the forecast period.

US, Canada, Mexico, Germany, UK, France, Italy, Spain, The Netherlands, China, Japan, India, South Korea, Australia, Indonesia, Brazil, Argentina, Colombia, Saudi Arabia, UAE, South Africa, Israel, Turkey

  • Enhanced learning outcomes through academic digital transformation is the driving factor this market.

The E-learning market vendors should focus on grabbing business opportunities from the End-user segment as it accounted for the largest market share in the base year.
RIA - Research AI Assistant
Ask RIA