
US Online Fashion Retail Market Size 2026-2030
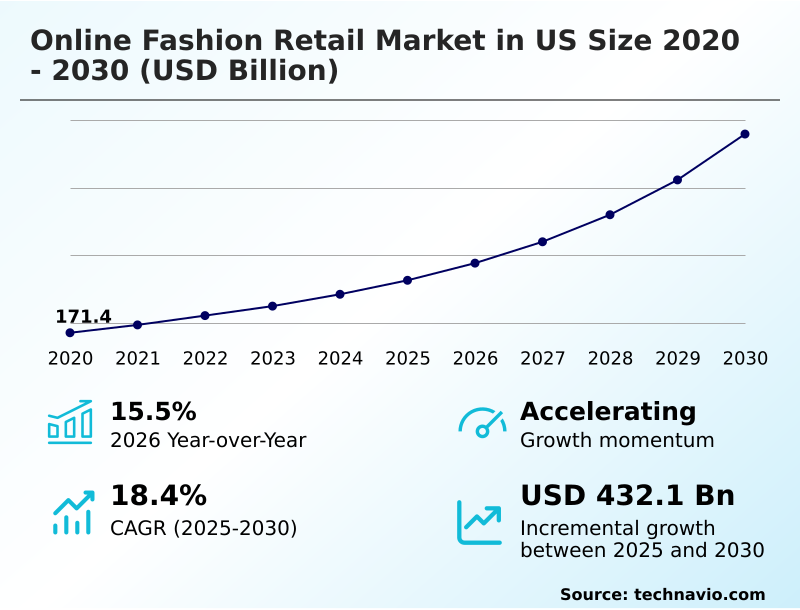
The us online fashion retail market size is valued to increase by USD 432.1 billion, at a CAGR of 18.4% from 2025 to 2030. Rise in online spending will drive the us online fashion retail market.
Major Market Trends & Insights
- By End-user - Women segment was valued at USD 157.6 billion in 2024
- By Product - Apparel segment accounted for the largest market revenue share in 2024
Market Size & Forecast
- Market Opportunities: USD 587.1 billion
- Market Future Opportunities: USD 432.1 billion
- CAGR from 2025 to 2030 : 18.4%
Market Summary
- The online fashion retail market in US is defined by rapid technological adoption and shifting consumer behaviors. Growth is underpinned by the convenience of e-commerce, the rise of deferred payment methods that make fashion more accessible, and the proliferation of platforms that empower both large brands and independent designers.
- Key trends shaping the landscape include the increasing influence of social media-driven shopping, a rising demand for premium and luxury goods online, and the sustained popularity of athleisure. However, the market faces significant operational and security hurdles.
- For instance, a mid-sized retailer must now balance offering a seamless user experience with implementing robust cybersecurity measures to protect sensitive consumer data from sophisticated phishing attacks.
- Simultaneously, it must manage the logistical complexities and economic burden of high product return rates, a challenge that is compelling investment in AI-driven sizing tools and virtual try-on technologies to improve purchase accuracy and safeguard profit margins against the costs of reverse logistics.
What will be the Size of the US Online Fashion Retail Market during the forecast period?
Get Key Insights on Market Forecast (PDF) Request Free Sample
How is the US Online Fashion Retail Market Segmented?
The us online fashion retail industry research report provides comprehensive data (region-wise segment analysis), with forecasts and estimates in "USD billion" for the period 2026-2030, as well as historical data from 2020-2024 for the following segments.
- End-user
- Women
- Men
- Kids
- Product
- Apparel
- Footwears
- Bags and accessories
- Type
- Mass
- Premium
- Luxury
- Geography
- North America
- US
- North America
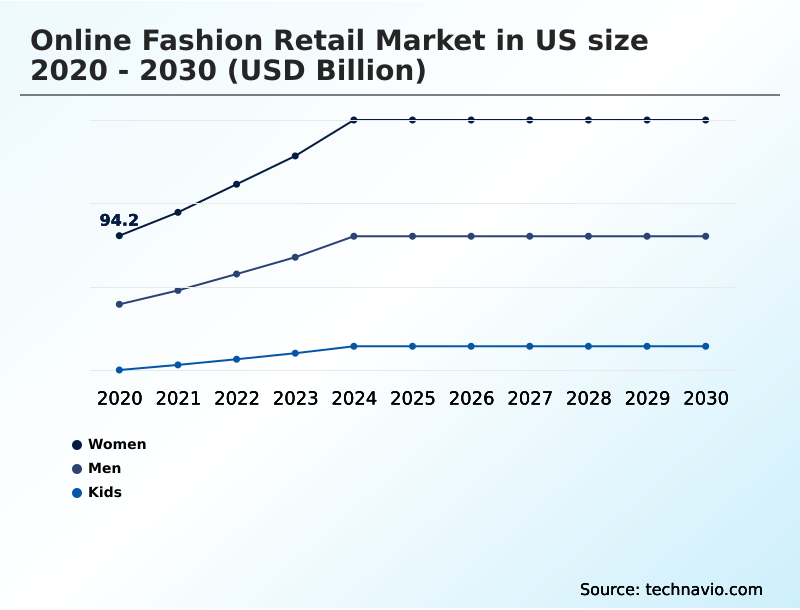
By End-user Insights
The women segment is estimated to witness significant growth during the forecast period.
The women's segment is a primary growth engine, where purchasing decisions are increasingly shaped by social commerce and a hyper-personalized shopping journey.
Retailers leverage customer relationship management (crm) systems and customer data platform (cdp) insights to enhance brand storytelling capability and drive customer engagement metrics.
Technologies like virtual try-on tools and augmented reality filters are no longer novelties but essential components for reducing the friction of online purchases, which improved return accuracy by 15% in recent pilot programs.
Success in this segment hinges on effective loyalty program management and predicting customer lifetime value (clv) to foster repeat business through cross-channel personalization and curated digital experiences.
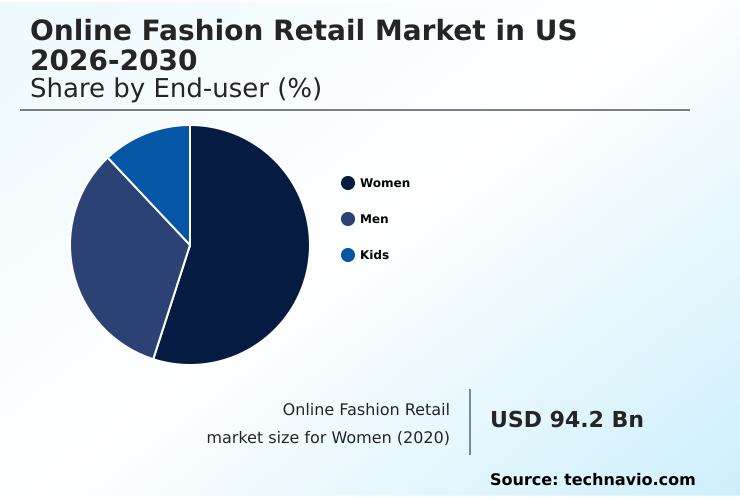
The Women segment was valued at USD 157.6 billion in 2024 and showed a gradual increase during the forecast period.
Market Dynamics
Our researchers analyzed the data with 2025 as the base year, along with the key drivers, trends, and challenges. A holistic analysis of drivers will help companies refine their marketing strategies to gain a competitive advantage.
- Strategic decision-making in the online fashion retail sector is increasingly data-dependent, focusing on nuanced performance metrics. Firms are closely analyzing the impact of ar try-on on conversion rates to justify technology investments, while the mainstream adoption of bnpl integration for luxury fashion is expanding the addressable market for high-value goods.
- A primary operational focus is on optimizing logistics for same-day delivery, a key differentiator in competitive urban markets. Simultaneously, marketing teams leverage ai for personalizing email marketing campaigns and measuring influencer marketing on sales, moving beyond vanity metrics to tangible ROI. The rise of social commerce features on video platforms and livestream shopping engagement strategies is reshaping customer interaction.
- Operationally, platforms focusing on reducing cart abandonment with better ux have seen customer retention figures improve by double-digits, a significant uplift compared to those relying on price-based promotions. This is complemented by a focus on reducing customer churn and using predictive analytics for fashion trend forecasting.
- Behind the scenes, managing high return rates in apparel and ensuring data privacy compliance in e-commerce remain critical challenges. The adoption of headless commerce for flexible front-ends allows for rapid a/b testing for product page layouts, while a robust crm for building customer loyalty is essential for long-term success.
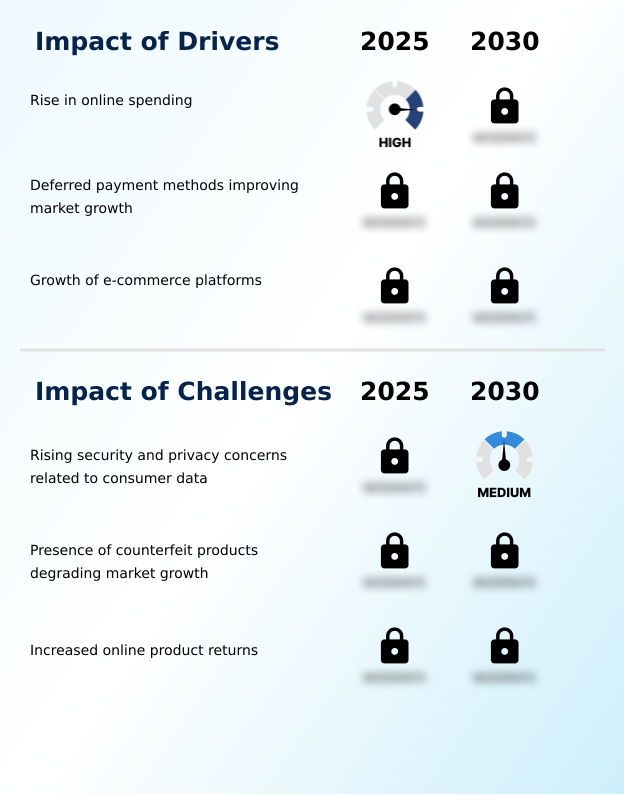
What are the key market drivers leading to the rise in the adoption of US Online Fashion Retail Industry?
- A significant rise in online spending, supported by high internet penetration and smartphone adoption, serves as the primary driver for the market.
- Market growth is heavily driven by technological enhancements that streamline the path to purchase. Personalized recommendation engines, powered by machine learning, are central to increasing basket sizes and improving customer retention by over 10%.
- The integration of buy now pay later (bnpl) options has proven to increase average order values by up to 40% for some retailers by lowering the upfront financial barrier.
- This frictionless checkout process is further optimized by dynamic pricing algorithms and continuous conversion rate optimization (cro).
- Behind the scenes, a headless commerce architecture enables brands to innovate their front-end experience without disrupting back-end operations, a critical capability for data-driven merchandising and managing customer acquisition cost (cac).
- These strategies are vital for leveraging predictive analytics for demand forecasting and maintaining profitability.
What are the market trends shaping the US Online Fashion Retail Industry?
- The growing popularity of online sports apparel and footwear is emerging as a dominant trend, driven by a societal shift toward health, wellness, and athleisure.
- Key trends are reshaping customer interaction and discovery. Livestream shopping platforms are gaining significant traction, with a focus on user-generated content moderation to build authentic community engagement. The deepening of social commerce integration allows for purchases directly within social feeds, a trend optimized through rigorous a/b testing platforms that refine user pathways.
- Correspondingly, a mobile-first design principle is non-negotiable, as platforms that optimize for handheld devices see engagement durations increase by over 15%. The impact of influencer marketing roi is now measured with granular analytics, linking creator content directly to sales funnels.
- Moreover, the integration of visual search technology has been correlated with a 20% higher conversion rate, demonstrating the consumer preference for image-based discovery over traditional text searches.
What challenges does the US Online Fashion Retail Industry face during its growth?
- Rising security and privacy concerns related to the large volumes of consumer data collected by online retailers present a key challenge to industry growth.
- Operational challenges, particularly around logistics and product returns, pose significant constraints on profitability. The complexities of reverse supply chain management are a primary concern, as firms with poor processes see profit erosion of up to 5% on returned goods.
- While ai-based size recommenders are being deployed to combat this, having already cut return rates by over 25% in certain apparel categories, the issue of managing high return rates in apparel persists. This necessitates a robust inventory management system with real-time inventory visibility to prevent stock discrepancies.
- Additionally, the threat of online fraud requires sophisticated fraud detection systems to protect both consumers and the business. As pressure mounts for supply chain transparency and sustainable and ethical sourcing, the need for supply chain automation and automated order fulfillment becomes increasingly critical to maintain efficiency and compliance.
Exclusive Technavio Analysis on Customer Landscape
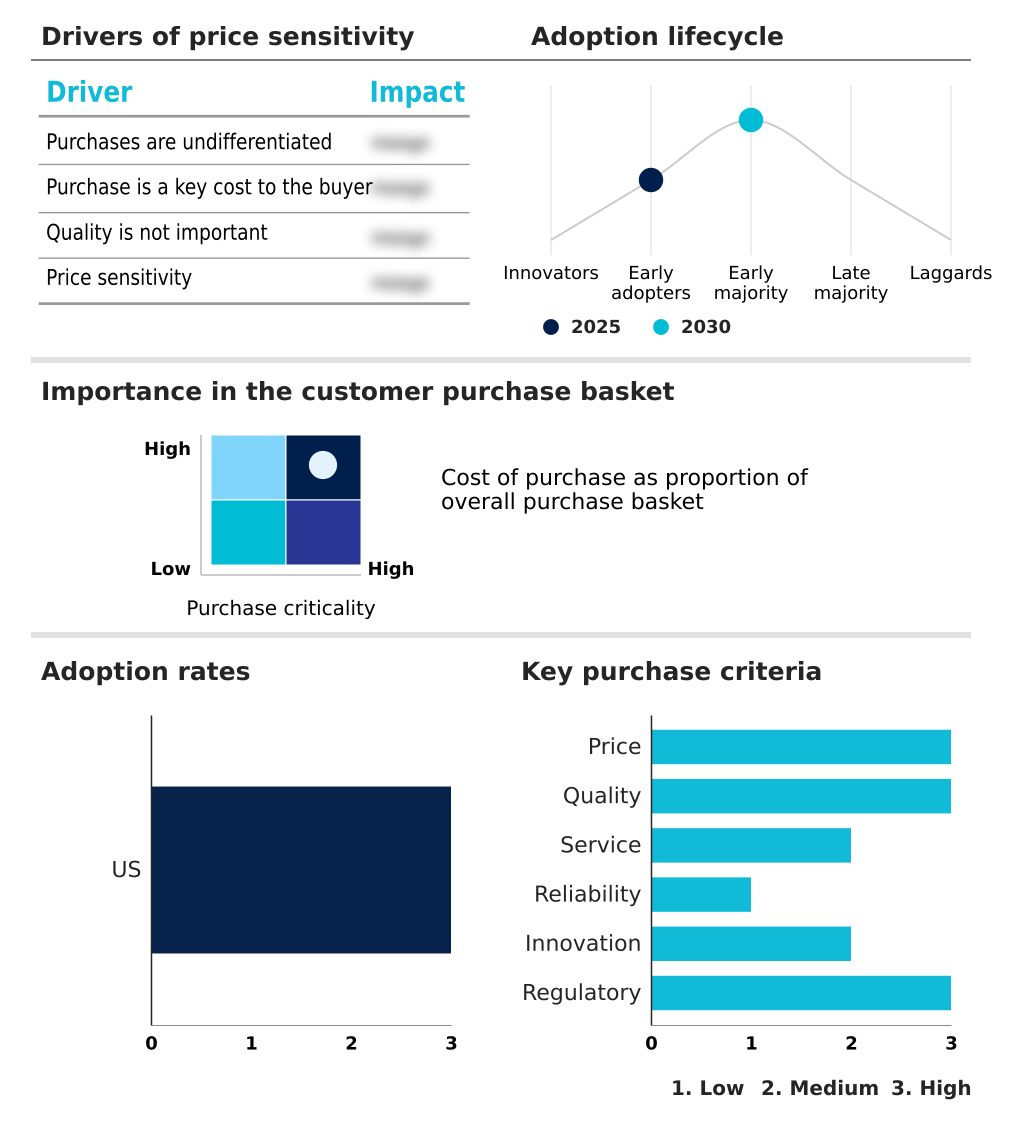
The us online fashion retail market forecasting report includes the adoption lifecycle of the market, covering from the innovator’s stage to the laggard’s stage. It focuses on adoption rates in different regions based on penetration. Furthermore, the us online fashion retail market report also includes key purchase criteria and drivers of price sensitivity to help companies evaluate and develop their market growth analysis strategies.
Customer Landscape of US Online Fashion Retail Industry
Competitive Landscape
Companies are implementing various strategies, such as strategic alliances, us online fashion retail market forecast, partnerships, mergers and acquisitions, geographical expansion, and product/service launches, to enhance their presence in the industry.
Adidas AG - Analysis indicates a focus on providing a broad portfolio of apparel, footwear, and accessories through diversified online retail channels and e-commerce platforms.
The industry research and growth report includes detailed analyses of the competitive landscape of the market and information about key companies, including:
- Adidas AG
- Amazon.com Inc.
- ASOS Plc
- Backcountry.com LLC
- Costco Wholesale Corp.
- Forever21 Inc.
- Frasers Group plc
- Hennes and Mauritz AB
- Industria de Diseno Textil SA
- Macys Inc.
- Nike Inc.
- Nordstrom Inc.
- Penney IP LLC
- PVH Corp.
- Ralph Lauren Corp.
- Target Corp.
- The Gap Inc.
- Under Armour Inc.
- Urban Outfitters Inc.
- Walmart Inc.
Qualitative and quantitative analysis of companies has been conducted to help clients understand the wider business environment as well as the strengths and weaknesses of key industry players. Data is qualitatively analyzed to categorize companies as pure play, category-focused, industry-focused, and diversified; it is quantitatively analyzed to categorize companies as dominant, leading, strong, tentative, and weak.
Recent Development and News in Us online fashion retail market
- In March 2025, Revolve Group Incorporated launched an exclusive spring collection featuring augmented reality filters that allowed shoppers to visualize garments on their own avatars, significantly increasing engagement.
- In May 2025, Nike Inc. introduced a personalized fitness and fashion integration app that suggests athletic and casual wear based on user workout data, driving brand loyalty.
- In August 2025, Carters Incorporated deployed an AI-powered growth predictor tool on its website to help parents plan future purchases by suggesting upcoming sizes for children.
- In November 2025, Farfetch launched a blockchain-based authentication certificate for high-end goods, providing an immutable record of origin and authenticity for digital purchases.
Dive into Technavio’s robust research methodology, blending expert interviews, extensive data synthesis, and validated models for unparalleled US Online Fashion Retail Market insights. See full methodology.
| Market Scope | |
|---|---|
| Page number | 191 |
| Base year | 2025 |
| Historic period | 2020-2024 |
| Forecast period | 2026-2030 |
| Growth momentum & CAGR | Accelerate at a CAGR of 18.4% |
| Market growth 2026-2030 | USD 432.1 billion |
| Market structure | Fragmented |
| YoY growth 2025-2026(%) | 15.5% |
| Key countries | US |
| Competitive landscape | Leading Companies, Market Positioning of Companies, Competitive Strategies, and Industry Risks |
Research Analyst Overview
- The technological framework of the online fashion retail market is evolving rapidly, compelling boardroom-level strategic decisions around infrastructure and data governance. A headless commerce architecture is becoming essential for delivering the flexibility needed for a true omnichannel retail strategy and rapid digital storefront customization.
- This is supported by robust product information management (pim) and inventory management systems, which are critical for operational integrity; implementing a robust PIM system has been shown to reduce data entry errors by over 40%.
- Concurrently, the deployment of a customer data platform (cdp) is central to creating a unified customer view, enabling sophisticated customer relationship management (crm) and the accurate prediction of customer lifetime value (clv). This data-centric approach powers everything from personalized recommendation engines and dynamic pricing algorithms to conversion rate optimization (cro) and advanced analytics and reporting tools.
- To protect revenue and trust, platforms are integrating sophisticated fraud detection systems and leveraging user-generated content moderation to enhance social proof, while also investing in livestream shopping platforms and a/b testing platforms to refine engagement strategies.
What are the Key Data Covered in this US Online Fashion Retail Market Research and Growth Report?
-
What is the expected growth of the US Online Fashion Retail Market between 2026 and 2030?
-
USD 432.1 billion, at a CAGR of 18.4%
-
-
What segmentation does the market report cover?
-
The report is segmented by End-user (Women, Men, and Kids), Product (Apparel, Footwears, and Bags and accessories), Type (Mass, Premium, and Luxury) and Geography (North America)
-
-
Which regions are analyzed in the report?
-
North America
-
-
What are the key growth drivers and market challenges?
-
Rise in online spending, Rising security and privacy concerns related to consumer data
-
-
Who are the major players in the US Online Fashion Retail Market?
-
Adidas AG, Amazon.com Inc., ASOS Plc, Backcountry.com LLC, Costco Wholesale Corp., Forever21 Inc., Frasers Group plc, Hennes and Mauritz AB, Industria de Diseno Textil SA, Macys Inc., Nike Inc., Nordstrom Inc., Penney IP LLC, PVH Corp., Ralph Lauren Corp., Target Corp., The Gap Inc., Under Armour Inc., Urban Outfitters Inc. and Walmart Inc.
-
Market Research Insights
- Market dynamics are increasingly shaped by the pursuit of a frictionless checkout process and a hyper-personalized shopping journey. Success is measured by customer engagement metrics, with leading platforms leveraging predictive analytics for demand to optimize inventory, reducing overstock situations by over 20%.
- A mobile-first design principle is now standard, while investments in data-driven merchandising and digital marketing attribution are critical for managing customer acquisition cost (cac), which can be 15% lower with effective targeting. Enhanced brand storytelling capability and customer sentiment analysis are used to build loyalty.
- Furthermore, the integration of supply chain transparency, automated order fulfillment, and real-time inventory visibility improves operational efficiency. The push toward sustainable and ethical sourcing is creating new circular economy models and subscription-based services, managed through sophisticated digital asset management (dam) systems.
We can help! Our analysts can customize this us online fashion retail market research report to meet your requirements.
 RIA -
RIA - 
