
CRM Market Size 2026-2030
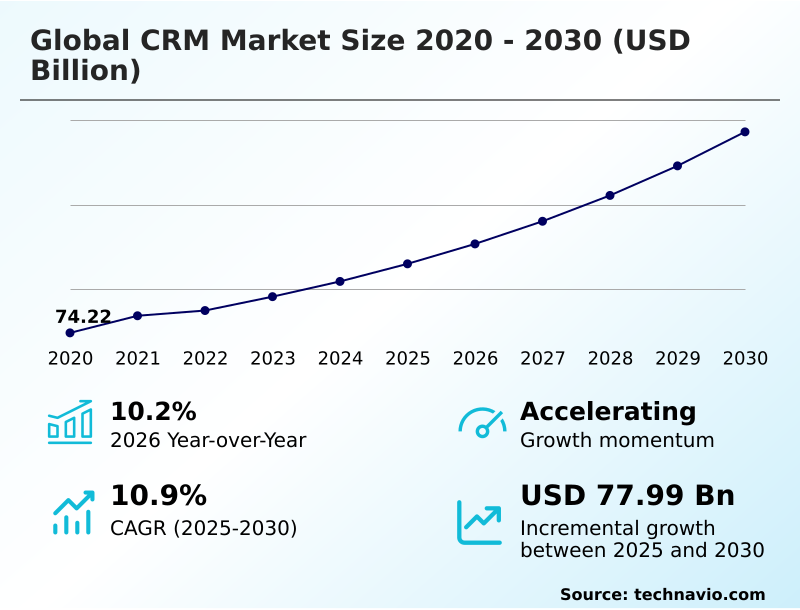
The crm market size is valued to increase by USD 77.99 billion, at a CAGR of 10.9% from 2025 to 2030. Transition from reactive automation to autonomous ai agentic orchestration will drive the crm market.
Major Market Trends & Insights
- North America dominated the market and accounted for a 54.7% growth during the forecast period.
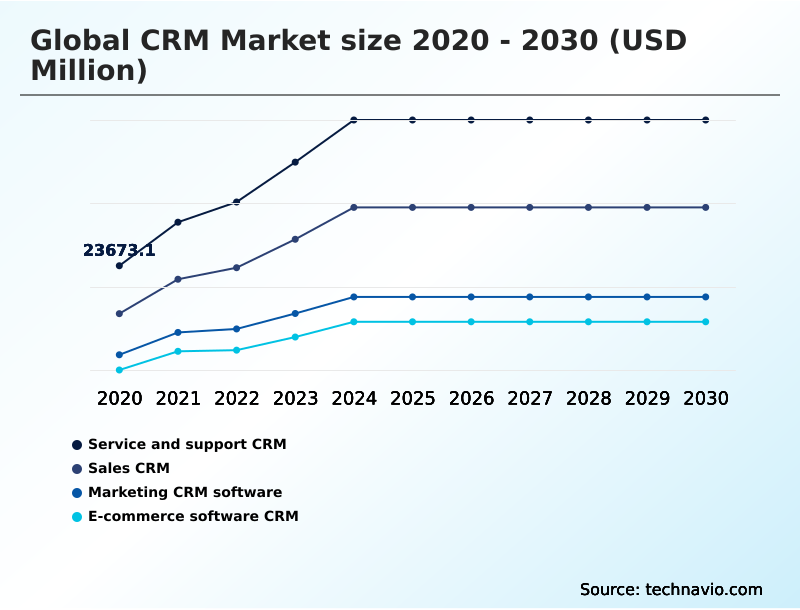
- By Application - Service and support CRM segment was valued at USD 36.04 billion in 2024
- By Deployment - SaaS segment accounted for the largest market revenue share in 2024
Market Size & Forecast
- Market Opportunities: USD 118.78 billion
- Market Future Opportunities: USD 77.99 billion
- CAGR from 2025 to 2030 : 10.9%
Market Summary
- The CRM market has evolved into an indispensable component of modern enterprise strategy, moving far beyond its origins as a simple contact database. Today's platforms function as dynamic engines for hyper-personalization at scale, leveraging predictive lead scoring and omnichannel communication frameworks to orchestrate every customer interaction.
- The integration of customer data platforms (CDP) is central to this shift, enabling a 360-degree customer view that breaks down traditional departmental silos. A key focus is the transition toward autonomous agentic CRM, where intelligent systems handle everything from sales force automation to proactive issue resolution.
- For example, a global logistics company can use its CRM's agentic orchestration to automatically re-route shipments based on real-time weather data and notify affected customers via their preferred channel, all without human intervention. This is made possible by trusted AI frameworks and privacy-first personalization, which balance automation with data sovereignty compliance.
- The market is also seeing a surge in verticalized CRM solutions and no-code workflow automation, making sophisticated customer journey mapping and sentiment analysis tools accessible to a wider range of businesses, ensuring technology acts as a strategic enabler rather than a technical hurdle.
What will be the Size of the CRM Market during the forecast period?
Get Key Insights on Market Forecast (PDF) Get Free Sample
How is the CRM Market Segmented?
The crm industry research report provides comprehensive data (region-wise segment analysis), with forecasts and estimates in "USD million" for the period 2026-2030, as well as historical data from 2020-2024 for the following segments.
- Application
- Service and support CRM
- Sales CRM
- Marketing CRM software
- E-commerce software CRM
- Deployment
- SaaS
- On-premises
- Sector
- Large enterprises
- SMEs
- Geography
- North America
- US
- Canada
- Mexico
- Europe
- Germany
- UK
- France
- APAC
- China
- Japan
- India
- South America
- Brazil
- Argentina
- Middle East and Africa
- Saudi Arabia
- UAE
- South Africa
- Rest of World (ROW)
- North America
By Application Insights
The service and support crm segment is estimated to witness significant growth during the forecast period.
The service and support CRM segment has evolved beyond basic case management into a dynamic ecosystem for optimizing the customer journey.
This transformation is driven by the integration of AI-augmented ticketing systems and self-service knowledge bases, which empower customers and reduce agent workload. Leading platforms now incorporate sentiment analysis tools and real-time feedback loops for a more proactive omnichannel support strategy.
The goal is to create a non-siloed engagement experience through hyper-automation of routine tasks and intelligent conversational AI handoffs.
Success is measured by improved customer success metrics rather than just ticket closure rates, with some systems achieving a 25% reduction in customer churn. This shift toward citizen-centric relationship management principles, focusing on value-exchange models, is redefining service excellence.
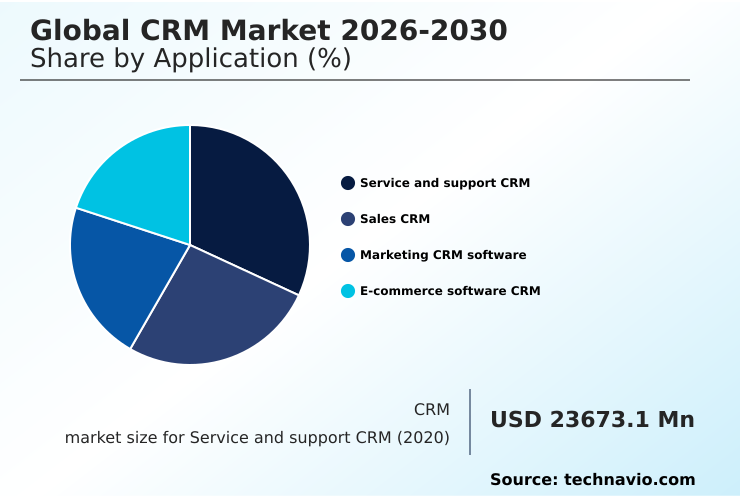
The Service and support CRM segment was valued at USD 36.04 billion in 2024 and showed a gradual increase during the forecast period.
Regional Analysis
North America is estimated to contribute 54.7% to the growth of the global market during the forecast period.Technavio’s analysts have elaborately explained the regional trends and drivers that shape the market during the forecast period.
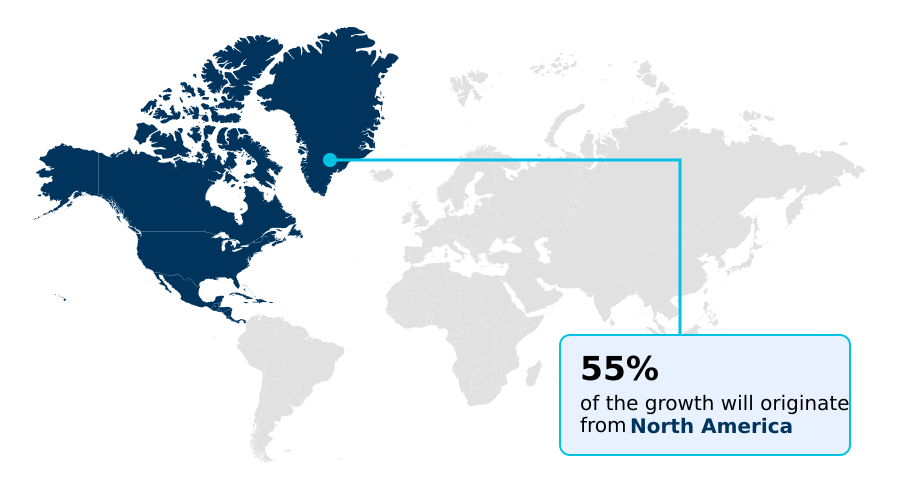
See How CRM Market Demand is Rising in North America Get Free Sample
The geographic landscape is increasingly shaped by regulations surrounding data sovereignty compliance, driving demand for sovereign cloud offerings and zero-trust security frameworks. In regions like Europe, this has led to a preference for multi-tenant architectures that can guarantee data residency.
Meanwhile, a focus on innovation in North America is popularizing the headless CRM architecture, which separates front-end presentation from back-end logic, enabling omnichannel retail synchronization.
This approach, coupled with mobile-first CRM design, supports a product-led growth strategy and allows for flexible social CRM integration. These headless and modular architectures are powered by probabilistic AI agents and are essential for managing subscription-based revenue cycles effectively.
The market is seeing a 20% faster deployment time for modular systems compared to monolithic ones, with data integrity maintained through secure data clean rooms.
Market Dynamics
Our researchers analyzed the data with 2025 as the base year, along with the key drivers, trends, and challenges. A holistic analysis of drivers will help companies refine their marketing strategies to gain a competitive advantage.
- The strategic application of CRM is becoming increasingly specialized to address complex operational niches. For instance, CRM for complex B2B sales cycles now requires advanced tools for stakeholder mapping and multi-threaded engagement tracking, moving beyond simple pipeline management.
- In the industrial sector, CRM integration with industrial IoT data is enabling CRM for proactive maintenance service models, shifting revenue from reactive repairs to predictable service contracts. The retail landscape is being reshaped by CRM for managing dark store logistics and the use of CRM for managing social commerce influencers to create authentic marketing channels.
- In finance and fintech, platforms must be capable of CRM for high-frequency micro-transactions and provide CRM for unified cross-border trade finance. Simultaneously, public sector transformation is driving demand for CRM for citizen-centric government services. Underpinning these vertical applications are horizontal technology shifts, including the demand for CRM with sovereign cloud data residency and CRM with zero-trust security architecture.
- The growth of CRM for subscription-based revenue models is evident, with this segment growing nearly 50% faster than traditional license models. Furthermore, functionality like CRM with integrated WhatsApp Business API, CRM with generative AI for email copy, and CRM for AI-driven sentiment analysis are becoming standard expectations.
- The future points toward highly intelligent systems providing CRM for predictive sales pipeline forecasting and CRM with autonomous lead qualification agents, all while ensuring compliance through CRM with zero-party data consent management.
- Platforms that offer CRM for no-code vertical workflow automation and specialized tools like CRM for patient journey mapping in healthcare are capturing significant market share by solving specific, high-value problems and unifying CRM for unified revenue operations intelligence.
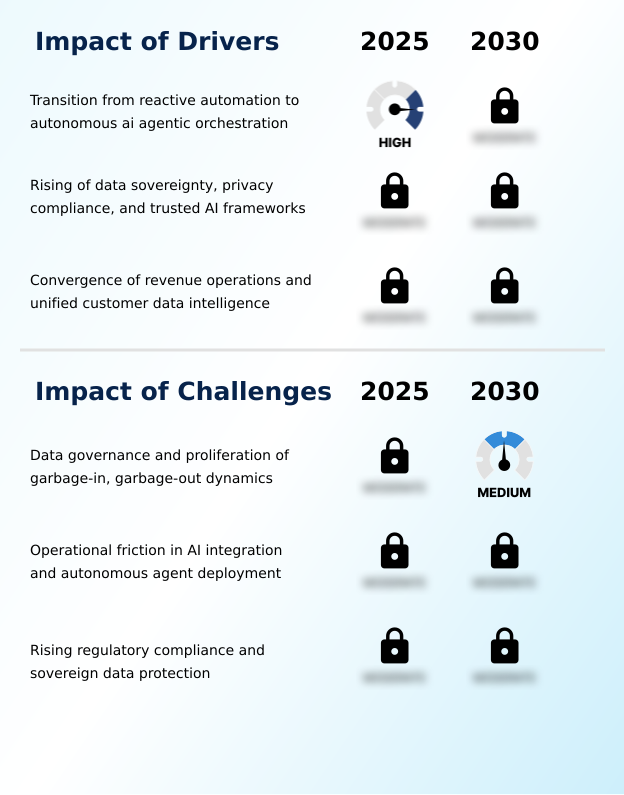
What are the key market drivers leading to the rise in the adoption of CRM Industry?
- A key market driver is the transition from reactive, rule-based automation to autonomous AI agentic orchestration, where intelligent systems proactively manage customer interactions.
- A primary market driver is the convergence of revenue operations (RevOps) and unified customer data intelligence, creating a cohesive operational backbone.
- The adoption of Customer Data Platforms (CDP) is central to achieving a 360-degree customer view, which is essential for effective agentic orchestration.
- Modern platforms leverage autonomous AI agents and predictive analytics to drive efficiency gains, including accelerated deal closure and AI-powered lead research. For instance, integrated solutions have demonstrated the ability to reduce lead response times by up to 40%.
- The integrity of these processes is ensured by robust data-hygiene features and real-time activity logging. In specialized sectors, the availability of AI-enabled trade financing and SWIFT-certified infrastructures is also propelling market growth.
What are the market trends shaping the CRM Industry?
- The CRM market is experiencing a significant evolution, shifting from generative assistance tools to the deployment of autonomous agentic operations. This transition enables systems to manage complex business processes independently.
- Market trends indicate a definitive shift from basic generative AI assistants toward a fully autonomous agentic CRM. This evolution enables agentic AI workflows to handle complex cross-departmental workflows, including lead qualification and personalized follow-ups, without human intervention. The rise of verticalized CRM solutions is accelerating this trend, offering pre-configured agentic frameworks for specific industries.
- These systems facilitate functions like autonomous billing disputes and proactive inventory-based outreach. The use of prescriptive revenue analytics and custom forecast models within these platforms allows businesses to optimize operations, with some firms reporting a 15% increase in forecast accuracy. This transition to autonomous operations is being facilitated by platforms that manage privacy-compliant data streams effectively.
What challenges does the CRM Industry face during its growth?
- A primary market challenge is managing data governance and mitigating the proliferation of 'garbage-in, garbage-out' dynamics, which undermine the strategic value of AI-driven insights.
- A significant challenge facing the market is the data governance crisis, which exacerbates garbage-in, garbage-out dynamics and undermines AI initiatives. The operational friction in AI is another major hurdle, as the complexities of autonomous agent deployment and digital labor integration are often underestimated.
- Organizations struggle to maintain a single source of truth without effective data validation tools, leading to fragmented insights. The rising need for sovereign data protection adds another layer of complexity. In sectors like retail, managing dark store logistics and high-volume micro-transaction management places immense pressure on data systems.
- Furthermore, expanding into new markets requires vernacular CRM platforms, and differentiating service involves delivering omotenashi customer service and enabling social commerce integration, all of which are difficult with poor data quality.
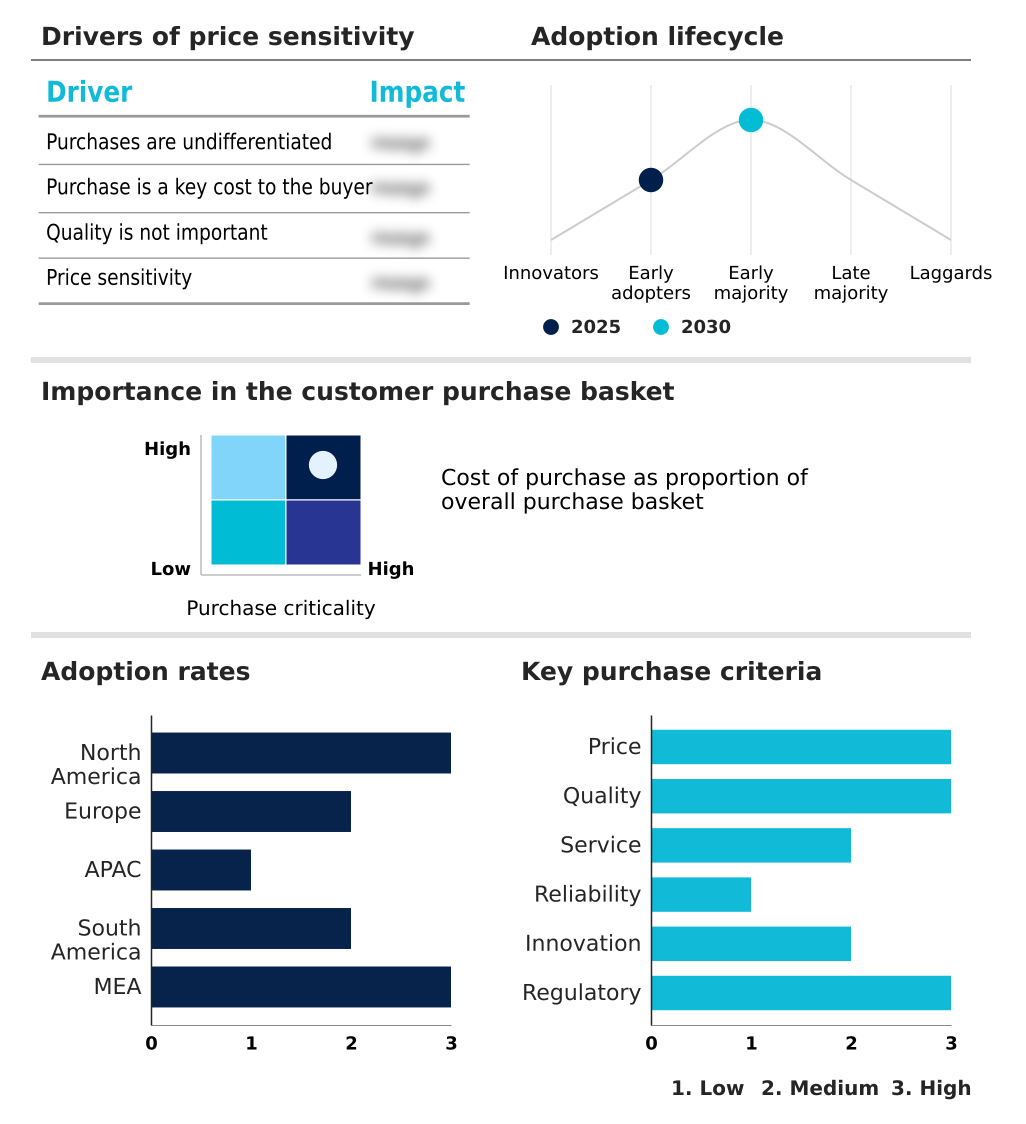
Exclusive Technavio Analysis on Customer Landscape
The crm market forecasting report includes the adoption lifecycle of the market, covering from the innovator’s stage to the laggard’s stage. It focuses on adoption rates in different regions based on penetration. Furthermore, the crm market report also includes key purchase criteria and drivers of price sensitivity to help companies evaluate and develop their market growth analysis strategies.
Customer Landscape of CRM Industry
Competitive Landscape
Companies are implementing various strategies, such as strategic alliances, crm market forecast, partnerships, mergers and acquisitions, geographical expansion, and product/service launches, to enhance their presence in the industry.
Agile CRM Inc. - Key offerings include unified platforms featuring sales, marketing, and service automation, progressively enhanced with AI-driven workflows and no-code customization for diverse industry verticals.
The industry research and growth report includes detailed analyses of the competitive landscape of the market and information about key companies, including:
- Agile CRM Inc.
- Apptivo Inc.
- Bitrix24 Ltd.
- Copper CRM Inc.
- Creatio Ltd.
- Freshworks Inc.
- HubSpot Inc.
- Insightly Inc.
- Keap
- Microsoft Corp.
- Nimble Inc.
- Oracle Corp.
- Pegasystems Inc.
- Salesforce Inc.
- SAP SE
- SugarCRM Inc.
- The Pipedrive Services
- Vtiger Systems Pvt. Ltd.
- Zendesk Inc.
- Zoho Corp. Pvt. Ltd.
Qualitative and quantitative analysis of companies has been conducted to help clients understand the wider business environment as well as the strengths and weaknesses of key industry players. Data is qualitatively analyzed to categorize companies as pure play, category-focused, industry-focused, and diversified; it is quantitatively analyzed to categorize companies as dominant, leading, strong, tentative, and weak.
Recent Development and News in Crm market
- In February, 2025, Salesforce Inc. announced the full integration of its Agentforce platform into the Customer 360 ecosystem, enabling businesses to deploy autonomous agents for tasks like billing disputes and proactive inventory-based outreach.
- In January, 2025, SAP SE launched new sovereign cloud offerings for its CRM and ERP customers, a strategic move to address regulatory compliance and AI sovereignty barriers, particularly for organizations in high-regulation sectors.
- In November, 2024, Microsoft Corp. unveiled its Dynamics 365 2025 Release Wave 1 plans, introducing advanced data-hygiene features designed to improve the efficacy of its Copilot and other generative AI integrations within enterprise environments.
- In April, 2025, Oracle Corp. enhanced its Oracle Unity platform to allow for real-time activation of zero-party data while ensuring adherence to international data protection laws, providing a scalable solution for maintaining unified customer profiles.
Dive into Technavio’s robust research methodology, blending expert interviews, extensive data synthesis, and validated models for unparalleled CRM Market insights. See full methodology.
| Market Scope | |
|---|---|
| Page number | 299 |
| Base year | 2025 |
| Historic period | 2020-2024 |
| Forecast period | 2026-2030 |
| Growth momentum & CAGR | Accelerate at a CAGR of 10.9% |
| Market growth 2026-2030 | USD 77985.4 million |
| Market structure | Fragmented |
| YoY growth 2025-2026(%) | 10.2% |
| Key countries | US, Canada, Mexico, Germany, UK, France, Italy, Spain, The Netherlands, China, Japan, India, South Korea, Australia, Indonesia, Brazil, Argentina, Chile, Saudi Arabia, UAE, South Africa, Israel and Turkey |
| Competitive landscape | Leading Companies, Market Positioning of Companies, Competitive Strategies, and Industry Risks |
Research Analyst Overview
- The CRM market is fundamentally shifting from a system of record to an active system of intelligence, driven by the rise of the agentic enterprise model. Core to this evolution is the move to autonomous agentic CRM, where agentic orchestration and real-time data processing automate complex tasks previously handled by humans.
- This necessitates robust zero-trust security and a headless CRM architecture to support omnichannel communication frameworks. Success now depends on leveraging a 360-degree customer view, which is fueled by customer data platforms (CDP) and zero-party data activation.
- Boardroom decisions are increasingly focused on data sovereignty compliance and managing subscription-based revenue cycles, where predictive lead scoring can improve forecast accuracy by over 15%. Platforms are incorporating sentiment analysis tools, consent management modules, and no-code workflow automation, all built on multi-tenant architectures.
- This allows for hyper-personalization at scale while navigating the garbage-in, garbage-out dynamics through better data governance and the use of secure data clean rooms. The end goal is to achieve true sales force automation and effective customer journey mapping.
What are the Key Data Covered in this CRM Market Research and Growth Report?
-
What is the expected growth of the CRM Market between 2026 and 2030?
-
USD 77.99 billion, at a CAGR of 10.9%
-
-
What segmentation does the market report cover?
-
The report is segmented by Application (Service and support CRM, Sales CRM, Marketing CRM software, and E-commerce software CRM), Deployment (SaaS, and On-premises), Sector (Large enterprises, and SMEs) and Geography (North America, Europe, APAC, South America, Middle East and Africa)
-
-
Which regions are analyzed in the report?
-
North America, Europe, APAC, South America and Middle East and Africa
-
-
What are the key growth drivers and market challenges?
-
Transition from reactive automation to autonomous ai agentic orchestration , Data governance and proliferation of garbage-in, garbage-out dynamics
-
-
Who are the major players in the CRM Market?
-
Agile CRM Inc., Apptivo Inc., Bitrix24 Ltd., Copper CRM Inc., Creatio Ltd., Freshworks Inc., HubSpot Inc., Insightly Inc., Keap, Microsoft Corp., Nimble Inc., Oracle Corp., Pegasystems Inc., Salesforce Inc., SAP SE, SugarCRM Inc., The Pipedrive Services, Vtiger Systems Pvt. Ltd., Zendesk Inc. and Zoho Corp. Pvt. Ltd.
-
Market Research Insights
- The market's dynamics are driven by a push for greater operational intelligence and efficiency. The adoption of agentic AI workflows is leading to measurable outcomes, with businesses reporting a 20% improvement in lead conversion rates by automating initial outreach and follow-up.
- This is complemented by a focus on prescriptive revenue analytics, which has improved sales forecast accuracy by an average of 15% across early-adopting firms. The emphasis on privacy-compliant data streams is not just a compliance issue but a strategic one, as value-exchange models that reward customers for data sharing see 30% higher engagement.
- These shifts are enabled by platforms offering proactive inventory-based outreach and real-time activity logging, turning static customer data into a dynamic, actionable asset for accelerated deal closure and enhanced customer lifecycle management.
We can help! Our analysts can customize this crm market research report to meet your requirements.
 RIA -
RIA - 
