Social Commerce Market Size 2025-2029
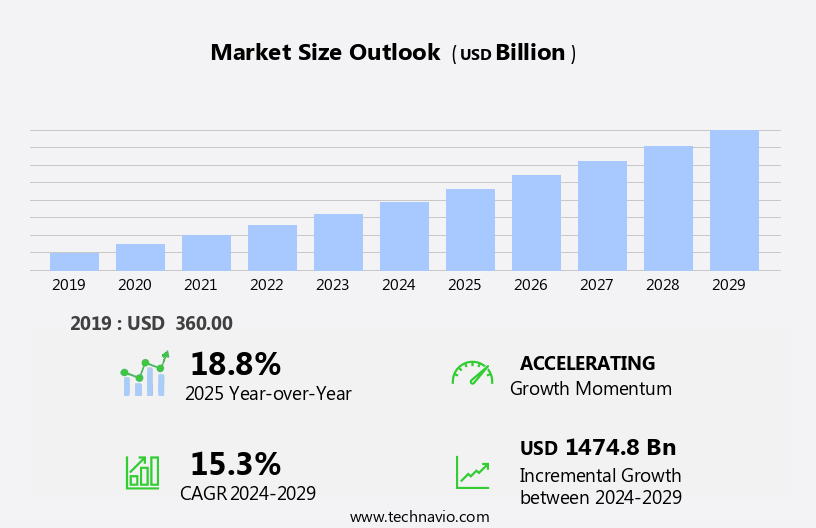
The social commerce market size is forecast to increase by USD 1474.8 billion at a CAGR of 15.3% between 2024 and 2029.
- The market is experiencing significant growth, driven by the personalized shopping experience and diverse product portfolios offered on social media platforms. Technological advancements in social media, enabling seamless transactions and real-time interactions, further fuel this growth. Brands and retailers are investing in customer engagement and retention strategies, including influencer marketing and social media advertising, to capitalize on the market trend. The market has witnessed significant growth due to the increasing use of laptops and PCs for social media engagement. The report provides a comprehensive analysis of these trends and the challenges they present, including data security concerns and the need for seamless integration with e-commerce platforms. Adopting these strategies can help businesses tap into the vast potential of social commerce and stay competitive In the ever-evolving digital landscape.
What will be the Size of the Social Commerce Market During the Forecast Period?

Request Free Sample
- The market represents a dynamic and rapidly evolving segment within the broader e-commerce landscape. This market enables customers to shop and discover products directly within virtual environments of social media platforms. The shopping process on these platforms often begins with content sharing and product discovery through organic or paid posts. Interested buyers can engage with brands and sellers through messaging features, influencer collaborations, and shoppable posts. Millennials and the internet-savvy population are key demographics driving the growth of social commerce. Brands and sellers leverage this market to increase brand awareness and reach a wider audience. Small businesses and individuals also benefit from the personalized shopping experience offered by social media platforms.
- Modern technologies, such as messaging features, secure payment methods, and user data protection, contribute to the convenience and safety of social commerce. The market encompasses various product categories, including electronics, home decor, and more. Changing consumer preferences and the increasing use of user-generated content further fuel its growth. Despite its advantages, the market faces challenges such as privacy concerns, regulatory compliance, and ensuring secure payment methods. As the market continues to evolve, large players and smaller niche providers will need to adapt to meet the evolving needs and preferences of consumers.
How is this Social Commerce Industry segmented and which is the largest segment?
The social commerce industry research report provides comprehensive data (region-wise segment analysis), with forecasts and estimates in "USD billion" for the period 2025-2029, as well as historical data from 2019-2023 for the following segments.
- Device
- Laptops and PCs
- Mobiles
- Tablets
- Others
- Business Segment
- Business to consumer
- Business to business
- Consumer to consumer
- Product Type
- Fashion and apparel
- Beauty and personal care
- Electronics and gadgets
- Home decor and furniture
- Others
- Geography
- APAC
- China
- India
- Japan
- South Korea
- North America
- Europe
- South America
- Middle East and Africa
By Device Insights
- The laptops and PCs segment is estimated to witness significant growth during the forecast period. These devices offer a larger screen size, enhancing the visual appeal of social media platforms and facilitating product discovery through customer reviews, ratings, and advertisements. Social media platforms have become essential tools for shopping, with users comparing prices across various social commerce websites. Virtual environments, such as social networks and messaging features, enable interested buyers to engage in immediate communication with brands, sellers, and influencers, fostering personalized customer experiences and brand awareness. Modern technologies, including Video Commerce, livestream shopping, and shoppable posts, have further enhanced the buyer experience.
- Millennials and younger generations, in particular, have shown a strong preference for social commerce, with mobile technology enabling seamless shopping on-the-go. However, concerns over cyberattacks, data collection, and security have emerged as challenges, necessitating regulatory compliance, secure payment methods, and user data protection. Brands, sellers, small businesses, and individuals alike leverage social media for marketing, personalized shopping, and consumer engagement, driving conversion rates. The latest technology trends, such as artificial intelligence and augmented reality, continue to shape the social commerce landscape.

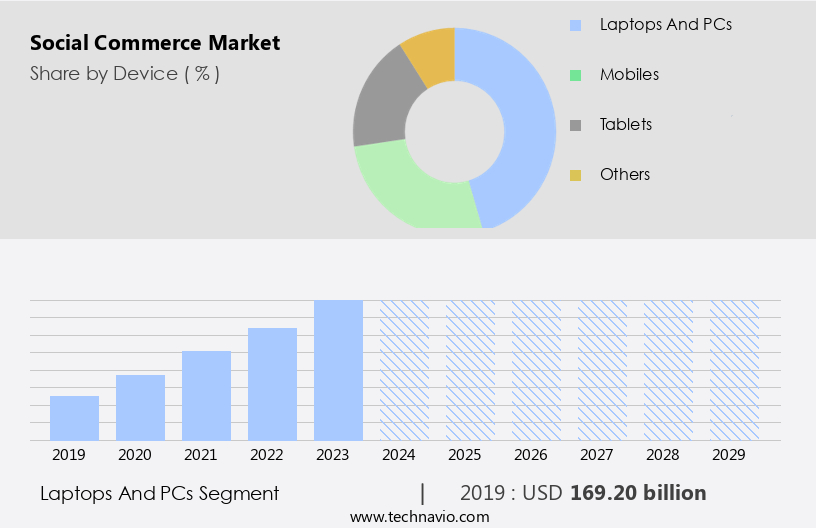
Get a glance at the market report of share of various segments Request Free Sample
- The laptops and PCs segment was valued at USD 169.20 billion in 2019 and showed a gradual increase during the forecast period.
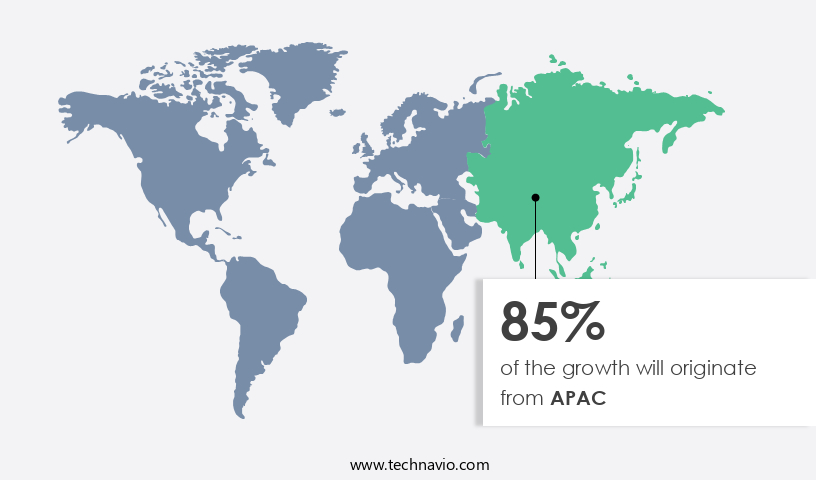
Regional Analysis
- APAC is estimated to contribute 85% to the growth of the global market during the forecast period. Technavio's analysts have elaborately explained the regional trends and drivers that shape the market during the forecast period. The market in APAC is experiencing significant growth due to the increasing adoption of smartphones in countries such as India, Indonesia, Vietnam, the Philippines, Sri Lanka, and Pakistan. India and China, in particular, are major contributors to this trend, with a large portion of their populations transitioning from feature phones to smartphones.

For more insights on the market size of various regions, Request Free Sample
- This shift is driving the demand for social commerce, as mobile technology enables immediate communication, personalized shopping experiences, and user-generated content. Brands, sellers, and individuals are leveraging social media platforms for product discovery, checkout, and consumer engagement. Social networks, including video commerce and livestream shopping, are popular channels for younger generations to explore and purchase products in categories such as personal and beauty, electronics, home decor, and more.
- The market's growth is also fueled by investment in telecommunication infrastructure, enabling faster and more reliable internet connections. However, concerns around cyberattacks, data collection, and security remain, necessitating regulatory compliance, secure payment methods, and user data protection. Brands and sellers must prioritize consumer preference, personalized shopping experiences, and multichannel retailing strategies to remain competitive. Modern technologies, such as artificial intelligence and augmented reality, are also transforming the buyer experience.
Market Dynamics
Our researchers analyzed the data with 2024 as the base year, along with the key drivers, trends, and challenges. A holistic analysis of drivers will help companies refine their marketing strategies to gain a competitive advantage.
What are the key market drivers leading to the rise In the adoption of Social Commerce Industry?
- The personalized shopping experience and diverse product portfolios on social commerce platforms is the key driver of the market. The marketplaces facilitate a unique shopping experience by allowing customers to discover and purchase products through virtual environments on social media platforms. These environments enable users to engage in content shopping, sharing, and messaging features, fostering social interactions and influencing consumer purchase behavior. Millennials and younger generations, in particular, are drawn to this modern form of retailing due to its immediate communication, personalized customer service, and user-generated content. Leading social commerce categories include personal and beauty products, electronics, home decor, and fashion. Brands and sellers leverage these platforms to increase brand awareness and reach a larger, internet-savvy population. The dynamic nature of these segments necessitates regular updates to keep up with consumer preferences and the latest technology, such as Video Commerce, livestream shopping, and artificial intelligence-driven product recommendations.
- However, concerns over cyberattacks, data collection, and user data protection persist. Ensuring regulatory compliance, secure payment methods, and user privacy are essential for both large players and smaller niche providers. The market is continuously evolving, with influencer collaborations, shoppable posts, and personalized shopping experiences becoming increasingly popular. In summary, social commerce represents a significant shift in consumer behavior and business strategy, offering multichannel retailing opportunities and enhancing the overall buyer experience.
What are the market trends shaping the Social Commerce Industry?
- The technological advances in social media is the upcoming market trend. The market has experienced significant growth due to the integration of shopping functionality into social media platforms. Virtual environments have transformed from simple interaction spaces into arenas for product discovery, checkout, and consumer purchase behavior. Millennials and younger generations are leading this trend, with a preference for immediate communication, personalized shopping experiences, and user-generated content. Social networks, such as Snapchat and Instagram, have become modern marketing tools for brands and sellers to increase brand awareness and engage consumers through shoppable posts, influencer collaborations, and livestream shopping. Technological innovations, including messaging features, secure payment methods, and personalized recommendations, are driving the market forward.
- However, concerns regarding data collection, privacy, and cyberattacks persist, necessitating regulatory compliance and user data protection. The latest technology, such as artificial intelligence, augmented reality, and video commerce, is expected to further enhance the buyer experience across various industries, including personal and beauty, electronics, and home decor. Businesses must adopt a multichannel retailing strategy to cater to the evolving consumer preferences and engage in social interactions to boost conversion rates.
What challenges does the Social Commerce Industry face during its growth?
- The efforts required for customer engagement and retention is a key challenge affecting the industry growth. In the realm of modern business, social commerce represents a significant market dynamic, particularly for engaging and retaining customers in virtual environments. Unlike traditional retail, where staff assists in product discovery and influences buying decisions, social commerce empowers consumers to control their shopping process. However, the interactive and appealing nature of these platforms is crucial to prevent customers from exploring competitors or returning to brick-and-mortar stores. Brands and sellers leverage social media platforms for content shopping, sharing, and messaging features to increase brand awareness among millennials and younger generations. Social networks have become a hub for consumer preference, with personalized shopping experiences in sectors like personal and beauty, electronics, home decor, and more.
- Influencer collaboration and shoppable posts are key marketing tools, shaping consumer purchase behavior In the internet-savvy population. The social commerce landscape is evolving with technologies like Video Commerce, livestream shopping, and buyer experience enhancements. Large players and smaller niche providers alike are addressing privacy concerns and regulatory compliance while implementing secure payment methods and user data protection. Multichannel retailing is becoming the norm, with artificial intelligence, augmented reality, and personalized product recommendations driving consumer engagement and conversion rates. Despite the benefits, challenges persist, such as cyberattacks, data collection, and security concerns. Brands and sellers must address these issues while maintaining a focus on user experience, user-generated content, and social influence to develop effective business strategies.
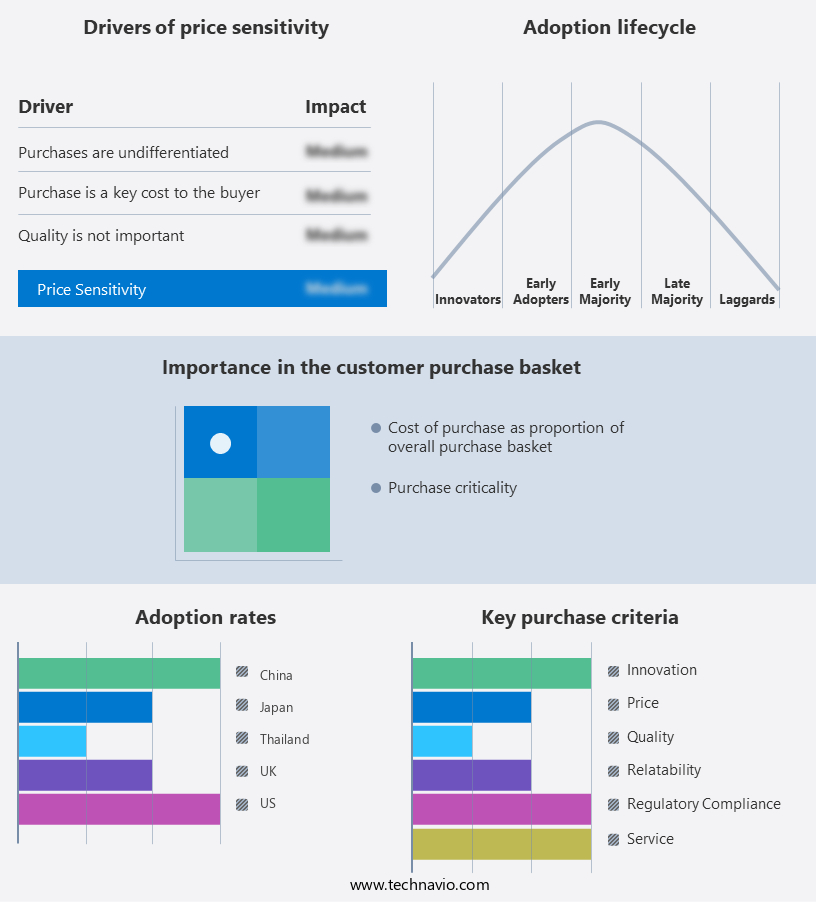
Exclusive Customer Landscape
The social commerce market forecasting report includes the adoption lifecycle of the market, market growth and forecasting, covering from the innovator's stage to the laggard's stage. It focuses on adoption rates in different regions based on penetration. Furthermore, the social commerce market report also includes key purchase criteria and drivers of price sensitivity to help companies evaluate and develop their market growth analysis strategies.

Customer Landscape
Key Companies & Market Insights
Companies are implementing various strategies, such as strategic alliances, social commerce market forecast, partnerships, mergers and acquisitions, geographical expansion, and product/service launches, to enhance their presence In the industry.
Advance - The company offers social commerce through the social media platform, Reddit. Also, the company offers different types of media such as newspapers, news and information websites, magazines, and others.
The industry research and growth report includes detailed analyses of the competitive landscape of the market and information about key companies, including:
- Advance
- Alibaba Group Holding Ltd.
- Automattic Inc.
- ByteDance Ltd.
- Charlton Media Group
- Etsy Inc.
- Eventbrite Inc.
- Fashnear Technologies Pvt. Ltd.
- iQIYI Inc.
- Meta Platforms Inc.
- Microsoft Corp.
- One97 Communications Ltd.
- PayPal Holdings Inc.
- PDD Holdings
- Renren Inc.
- Shopify Inc.
- SINA Corp.
- Tencent Holdings Ltd.
- X Corp.
- Verizon Communications Inc.
Qualitative and quantitative analysis of companies has been conducted to help clients understand the wider business environment as well as the strengths and weaknesses of key industry players. Data is qualitatively analyzed to categorize companies as pure play, category-focused, industry-focused, and diversified; it is quantitatively analyzed to categorize companies as dominant, leading, strong, tentative, and weak.
Research Analyst Overview
The market continues to evolve as customers increasingly turn to virtual environments for product discovery and shopping. This trend is particularly prevalent among younger generations, who are more likely to use social media platforms as a primary means of content shopping and sharing. The shopping process on social media has become more streamlined, with checkout features integrated directly into the platforms. Interested buyers can easily make purchases without leaving the app, making the experience more convenient and efficient. Social media platforms have also introduced messaging features, allowing brands and sellers to engage in immediate communication with consumers. This real-time interaction enhances brand awareness and customer service, leading to increased consumer preference for social commerce. Small businesses and individuals have also embraced social commerce as a way to reach a wider audience and sell their products. Brands and sellers can collaborate with influencers to promote their offerings through shoppable posts, further expanding their reach. Consumer purchase behavior is influenced by the modern technologies that underpin social commerce. Mobile technology enables users to shop on-the-go, while personalized shopping recommendations based on user data and social influence can lead to higher conversion rates.
However, the market is not without challenges. Cyberattacks and data collection concerns have raised security issues, leading to privacy concerns among consumers. Regulatory compliance and secure payment methods are also crucial for user data protection. Changing consumer preferences and user experience continue to shape the social commerce landscape. User-generated content and product recommendations play a significant role in influencing consumer decisions. Video commerce and livestream shopping are also gaining popularity, providing a more engaging shopping experience. The personalized shopping experience offered by social commerce extends to various product categories, including personal and beauty, electronics, and home decor. Brands and sellers can leverage marketing tools and multichannel retailing strategies to reach a broader audience and increase sales. Artificial intelligence and augmented reality are the latest technologies transforming social commerce. These technologies enhance the shopping experience by providing personalized product recommendations and virtual try-ons, respectively. Consumer behavior and preferences continue to evolve, and businesses must adapt to remain competitive in this dynamic market.
Market Scope
|
Report Coverage
|
Details
|
Page number
|
229
|
Base year
|
2024
|
Historic period
|
2019-2023 |
Forecast period
|
2025-2029
|
Growth momentum & CAGR
|
Accelerate at a CAGR of 15.3%
|
Market growth 2025-2029
|
USD 1474.8 billion
|
Market structure
|
Fragmented
|
YoY growth 2024-2025(%)
|
18.8
|
Key countries
|
China, India, Japan, US, South Korea, Australia, Canada, UK, Germany, and Brazil
|
Competitive landscape
|
Leading Companies, Market Positioning of Companies, Competitive Strategies, and Industry Risks
|
Request Free Sample
What are the Key Data Covered in this Social Commerce Market Research and Growth Report?
- CAGR of the Social Commerce industry during the forecast period
- Detailed information on factors that will drive the growth and forecasting between 2025 and 2029
- Precise estimation of the size of the market and its contribution of the industry in focus to the parent market
- Accurate predictions about upcoming growth and trends and changes in consumer behaviour
- Growth of the market across APAC, North America, Europe, South America, and Middle East and Africa
- Thorough analysis of the market's competitive landscape and detailed information about companies
- Comprehensive analysis of factors that will challenge the social commerce market growth of industry companies
We can help! Our analysts can customize this social commerce market research report to meet your requirements.
Get in touch
1 Executive Summary
- 1.1 Market overview
- Executive Summary - Chart on Market Overview
- Executive Summary - Data Table on Market Overview
- Executive Summary - Chart on Global Market Characteristics
- Executive Summary - Chart on Market by Geography
- Executive Summary - Chart on Market Segmentation by Device
- Executive Summary - Chart on Market Segmentation by Business Segment
- Executive Summary - Chart on Market Segmentation by Product Type
- Executive Summary - Chart on Incremental Growth
- Executive Summary - Data Table on Incremental Growth
- Executive Summary - Chart on Company Market Positioning
2 Technavio Analysis
- 2.1 Analysis of price sensitivity, lifecycle, customer purchase basket, adoption rates, and purchase criteria
- Analysis of price sensitivity, lifecycle, customer purchase basket, adoption rates, and purchase criteria
- 2.2 Criticality of inputs and Factors of differentiation
- Overview on criticality of inputs and factors of differentiation
- 2.3 Factors of disruption
- Overview on factors of disruption
- 2.4 Impact of drivers and challenges
- Impact of drivers and challenges in 2024 and 2029
3 Market Landscape
- 3.1 Market ecosystem
- Parent Market
- Data Table on - Parent Market
- 3.2 Market characteristics
- Market characteristics analysis
4 Market Sizing
- 4.1 Market definition
- Offerings of companies included in the market definition
- 4.2 Market segment analysis
- 4.4 Market outlook: Forecast for 2024-2029
- Chart on Global - Market size and forecast 2024-2029 ($ billion)
- Data Table on Global - Market size and forecast 2024-2029 ($ billion)
- Chart on Global Market: Year-over-year growth 2024-2029 (%)
- Data Table on Global Market: Year-over-year growth 2024-2029 (%)
5 Historic Market Size
- 5.1 Global Social Commerce Market 2019 - 2023
- Historic Market Size - Data Table on Global Social Commerce Market 2019 - 2023 ($ billion)
- 5.2 Device segment analysis 2019 - 2023
- Historic Market Size - Device Segment 2019 - 2023 ($ billion)
- 5.3 Business segment analysis 2019 - 2023
- Historic Market Size - Business Segment 2019 - 2023 ($ billion)
- 5.4 Product Type segment analysis 2019 - 2023
- Historic Market Size - Product Type Segment 2019 - 2023 ($ billion)
- 5.5 Geography segment analysis 2019 - 2023
- Historic Market Size - Geography Segment 2019 - 2023 ($ billion)
- 5.6 Country segment analysis 2019 - 2023
- Historic Market Size - Country Segment 2019 - 2023 ($ billion)
6 Qualitative Analysis
- 6.1 Impact of AI on Global Social Commerce Market
7 Five Forces Analysis
- 7.1 Five forces summary
- Five forces analysis - Comparison between 2024 and 2029
- 7.2 Bargaining power of buyers
- Bargaining power of buyers - Impact of key factors 2024 and 2029
- 7.3 Bargaining power of suppliers
- Bargaining power of suppliers - Impact of key factors in 2024 and 2029
- 7.4 Threat of new entrants
- Threat of new entrants - Impact of key factors in 2024 and 2029
- 7.5 Threat of substitutes
- Threat of substitutes - Impact of key factors in 2024 and 2029
- 7.6 Threat of rivalry
- Threat of rivalry - Impact of key factors in 2024 and 2029
- 7.7 Market condition
- Chart on Market condition - Five forces 2024 and 2029
8 Market Segmentation by Device
- 8.1 Market segments
- Chart on Device - Market share 2024-2029 (%)
- Data Table on Device - Market share 2024-2029 (%)
- 8.2 Comparison by Device
- Chart on Comparison by Device
- Data Table on Comparison by Device
- 8.3 Laptops and PCs - Market size and forecast 2024-2029
- Chart on Laptops and PCs - Market size and forecast 2024-2029 ($ billion)
- Data Table on Laptops and PCs - Market size and forecast 2024-2029 ($ billion)
- Chart on Laptops and PCs - Year-over-year growth 2024-2029 (%)
- Data Table on Laptops and PCs - Year-over-year growth 2024-2029 (%)
- 8.4 Mobiles - Market size and forecast 2024-2029
- Chart on Mobiles - Market size and forecast 2024-2029 ($ billion)
- Data Table on Mobiles - Market size and forecast 2024-2029 ($ billion)
- Chart on Mobiles - Year-over-year growth 2024-2029 (%)
- Data Table on Mobiles - Year-over-year growth 2024-2029 (%)
- 8.5 Tablets - Market size and forecast 2024-2029
- Chart on Tablets - Market size and forecast 2024-2029 ($ billion)
- Data Table on Tablets - Market size and forecast 2024-2029 ($ billion)
- Chart on Tablets - Year-over-year growth 2024-2029 (%)
- Data Table on Tablets - Year-over-year growth 2024-2029 (%)
- 8.6 Others - Market size and forecast 2024-2029
- Chart on Others - Market size and forecast 2024-2029 ($ billion)
- Data Table on Others - Market size and forecast 2024-2029 ($ billion)
- Chart on Others - Year-over-year growth 2024-2029 (%)
- Data Table on Others - Year-over-year growth 2024-2029 (%)
- 8.7 Market opportunity by Device
- Market opportunity by Device ($ billion)
- Data Table on Market opportunity by Device ($ billion)
9 Market Segmentation by Business Segment
- 9.1 Market segments
- Chart on Market Segmentation by Business Segment - Market share 2024-2029 (%)
- Data Table on Market Segmentation by Business Segment - Market share 2024-2029 (%)
- 9.2 Comparison by Market Segmentation by Business Segment
- Chart on Comparison by Market Segmentation by Business Segment
- Data Table on Comparison by Market Segmentation by Business Segment
- 9.3 Business to consumer - Market size and forecast 2024-2029
- Chart on Business to consumer - Market size and forecast 2024-2029 ($ billion)
- Data Table on Business to consumer - Market size and forecast 2024-2029 ($ billion)
- Chart on Business to consumer - Year-over-year growth 2024-2029 (%)
- Data Table on Business to consumer - Year-over-year growth 2024-2029 (%)
- 9.4 Business to business - Market size and forecast 2024-2029
- Chart on Business to business - Market size and forecast 2024-2029 ($ billion)
- Data Table on Business to business - Market size and forecast 2024-2029 ($ billion)
- Chart on Business to business - Year-over-year growth 2024-2029 (%)
- Data Table on Business to business - Year-over-year growth 2024-2029 (%)
- 9.5 Consumer to consumer - Market size and forecast 2024-2029
- Chart on Consumer to consumer - Market size and forecast 2024-2029 ($ billion)
- Data Table on Consumer to consumer - Market size and forecast 2024-2029 ($ billion)
- Chart on Consumer to consumer - Year-over-year growth 2024-2029 (%)
- Data Table on Consumer to consumer - Year-over-year growth 2024-2029 (%)
- 9.6 Market opportunity by Market Segmentation by Business Segment
- Market opportunity by Market Segmentation by Business Segment ($ billion)
- Data Table on Market opportunity by Market Segmentation by Business Segment ($ billion)
10 Market Segmentation by Product Type
- 10.1 Market segments
- Chart on Product Type - Market share 2024-2029 (%)
- Data Table on Product Type - Market share 2024-2029 (%)
- 10.2 Comparison by Product Type
- Chart on Comparison by Product Type
- Data Table on Comparison by Product Type
- 10.3 Fashion and apparel - Market size and forecast 2024-2029
- Chart on Fashion and apparel - Market size and forecast 2024-2029 ($ billion)
- Data Table on Fashion and apparel - Market size and forecast 2024-2029 ($ billion)
- Chart on Fashion and apparel - Year-over-year growth 2024-2029 (%)
- Data Table on Fashion and apparel - Year-over-year growth 2024-2029 (%)
- 10.4 Beauty and personal care - Market size and forecast 2024-2029
- Chart on Beauty and personal care - Market size and forecast 2024-2029 ($ billion)
- Data Table on Beauty and personal care - Market size and forecast 2024-2029 ($ billion)
- Chart on Beauty and personal care - Year-over-year growth 2024-2029 (%)
- Data Table on Beauty and personal care - Year-over-year growth 2024-2029 (%)
- 10.5 Electronics and gadgets - Market size and forecast 2024-2029
- Chart on Electronics and gadgets - Market size and forecast 2024-2029 ($ billion)
- Data Table on Electronics and gadgets - Market size and forecast 2024-2029 ($ billion)
- Chart on Electronics and gadgets - Year-over-year growth 2024-2029 (%)
- Data Table on Electronics and gadgets - Year-over-year growth 2024-2029 (%)
- 10.6 Home decor and furniture - Market size and forecast 2024-2029
- Chart on Home decor and furniture - Market size and forecast 2024-2029 ($ billion)
- Data Table on Home decor and furniture - Market size and forecast 2024-2029 ($ billion)
- Chart on Home decor and furniture - Year-over-year growth 2024-2029 (%)
- Data Table on Home decor and furniture - Year-over-year growth 2024-2029 (%)
- 10.7 Others - Market size and forecast 2024-2029
- Chart on Others - Market size and forecast 2024-2029 ($ billion)
- Data Table on Others - Market size and forecast 2024-2029 ($ billion)
- Chart on Others - Year-over-year growth 2024-2029 (%)
- Data Table on Others - Year-over-year growth 2024-2029 (%)
- 10.8 Market opportunity by Product Type
- Market opportunity by Product Type ($ billion)
- Data Table on Market opportunity by Product Type ($ billion)
11 Customer Landscape
- 11.1 Customer landscape overview
- Analysis of price sensitivity, lifecycle, customer purchase basket, adoption rates, and purchase criteria
12 Geographic Landscape
- 12.1 Geographic segmentation
- Chart on Market share by geography 2024-2029 (%)
- Data Table on Market share by geography 2024-2029 (%)
- 12.2 Geographic comparison
- Chart on Geographic comparison
- Data Table on Geographic comparison
- 12.3 APAC - Market size and forecast 2024-2029
- Chart on APAC - Market size and forecast 2024-2029 ($ billion)
- Data Table on APAC - Market size and forecast 2024-2029 ($ billion)
- Chart on APAC - Year-over-year growth 2024-2029 (%)
- Data Table on APAC - Year-over-year growth 2024-2029 (%)
- 12.4 North America - Market size and forecast 2024-2029
- Chart on North America - Market size and forecast 2024-2029 ($ billion)
- Data Table on North America - Market size and forecast 2024-2029 ($ billion)
- Chart on North America - Year-over-year growth 2024-2029 (%)
- Data Table on North America - Year-over-year growth 2024-2029 (%)
- 12.5 Europe - Market size and forecast 2024-2029
- Chart on Europe - Market size and forecast 2024-2029 ($ billion)
- Data Table on Europe - Market size and forecast 2024-2029 ($ billion)
- Chart on Europe - Year-over-year growth 2024-2029 (%)
- Data Table on Europe - Year-over-year growth 2024-2029 (%)
- 12.6 South America - Market size and forecast 2024-2029
- Chart on South America - Market size and forecast 2024-2029 ($ billion)
- Data Table on South America - Market size and forecast 2024-2029 ($ billion)
- Chart on South America - Year-over-year growth 2024-2029 (%)
- Data Table on South America - Year-over-year growth 2024-2029 (%)
- 12.7 Middle East and Africa - Market size and forecast 2024-2029
- Chart on Middle East and Africa - Market size and forecast 2024-2029 ($ billion)
- Data Table on Middle East and Africa - Market size and forecast 2024-2029 ($ billion)
- Chart on Middle East and Africa - Year-over-year growth 2024-2029 (%)
- Data Table on Middle East and Africa - Year-over-year growth 2024-2029 (%)
- 12.8 China - Market size and forecast 2024-2029
- Chart on China - Market size and forecast 2024-2029 ($ billion)
- Data Table on China - Market size and forecast 2024-2029 ($ billion)
- Chart on China - Year-over-year growth 2024-2029 (%)
- Data Table on China - Year-over-year growth 2024-2029 (%)
- 12.9 India - Market size and forecast 2024-2029
- Chart on India - Market size and forecast 2024-2029 ($ billion)
- Data Table on India - Market size and forecast 2024-2029 ($ billion)
- Chart on India - Year-over-year growth 2024-2029 (%)
- Data Table on India - Year-over-year growth 2024-2029 (%)
- 12.10 Japan - Market size and forecast 2024-2029
- Chart on Japan - Market size and forecast 2024-2029 ($ billion)
- Data Table on Japan - Market size and forecast 2024-2029 ($ billion)
- Chart on Japan - Year-over-year growth 2024-2029 (%)
- Data Table on Japan - Year-over-year growth 2024-2029 (%)
- 12.11 US - Market size and forecast 2024-2029
- Chart on US - Market size and forecast 2024-2029 ($ billion)
- Data Table on US - Market size and forecast 2024-2029 ($ billion)
- Chart on US - Year-over-year growth 2024-2029 (%)
- Data Table on US - Year-over-year growth 2024-2029 (%)
- 12.12 South Korea - Market size and forecast 2024-2029
- Chart on South Korea - Market size and forecast 2024-2029 ($ billion)
- Data Table on South Korea - Market size and forecast 2024-2029 ($ billion)
- Chart on South Korea - Year-over-year growth 2024-2029 (%)
- Data Table on South Korea - Year-over-year growth 2024-2029 (%)
- 12.13 Australia - Market size and forecast 2024-2029
- Chart on Australia - Market size and forecast 2024-2029 ($ billion)
- Data Table on Australia - Market size and forecast 2024-2029 ($ billion)
- Chart on Australia - Year-over-year growth 2024-2029 (%)
- Data Table on Australia - Year-over-year growth 2024-2029 (%)
- 12.14 Canada - Market size and forecast 2024-2029
- Chart on Canada - Market size and forecast 2024-2029 ($ billion)
- Data Table on Canada - Market size and forecast 2024-2029 ($ billion)
- Chart on Canada - Year-over-year growth 2024-2029 (%)
- Data Table on Canada - Year-over-year growth 2024-2029 (%)
- 12.15 UK - Market size and forecast 2024-2029
- Chart on UK - Market size and forecast 2024-2029 ($ billion)
- Data Table on UK - Market size and forecast 2024-2029 ($ billion)
- Chart on UK - Year-over-year growth 2024-2029 (%)
- Data Table on UK - Year-over-year growth 2024-2029 (%)
- 12.16 Germany - Market size and forecast 2024-2029
- Chart on Germany - Market size and forecast 2024-2029 ($ billion)
- Data Table on Germany - Market size and forecast 2024-2029 ($ billion)
- Chart on Germany - Year-over-year growth 2024-2029 (%)
- Data Table on Germany - Year-over-year growth 2024-2029 (%)
- 12.17 Brazil - Market size and forecast 2024-2029
- Chart on Brazil - Market size and forecast 2024-2029 ($ billion)
- Data Table on Brazil - Market size and forecast 2024-2029 ($ billion)
- Chart on Brazil - Year-over-year growth 2024-2029 (%)
- Data Table on Brazil - Year-over-year growth 2024-2029 (%)
- 12.18 Market opportunity by geography
- Market opportunity by geography ($ billion)
- Data Tables on Market opportunity by geography ($ billion)
13 Drivers, Challenges, and Opportunity/Restraints
- 13.3 Impact of drivers and challenges
- Impact of drivers and challenges in 2024 and 2029
- 13.4 Market opportunities/restraints
14 Competitive Landscape
- 14.2 Competitive Landscape
- Overview on criticality of inputs and factors of differentiation
- 14.3 Landscape disruption
- Overview on factors of disruption
- 14.4 Industry risks
- Impact of key risks on business
15 Competitive Analysis
- 15.2 Company ranking index
- 15.3 Market positioning of companies
- Matrix on companies position and classification
- 15.4 Advance
- Advance - Overview
- Advance - Product / Service
- Advance - Key news
- Advance - Key offerings
- SWOT
- 15.5 Alibaba Group Holding Ltd.
- Alibaba Group Holding Ltd. - Overview
- Alibaba Group Holding Ltd. - Business segments
- Alibaba Group Holding Ltd. - Key news
- Alibaba Group Holding Ltd. - Key offerings
- Alibaba Group Holding Ltd. - Segment focus
- SWOT
- 15.6 Automattic Inc.
- Automattic Inc. - Overview
- Automattic Inc. - Product / Service
- Automattic Inc. - Key offerings
- SWOT
- 15.7 Charlton Media Group
- Charlton Media Group - Overview
- Charlton Media Group - Product / Service
- Charlton Media Group - Key offerings
- SWOT
- 15.8 Etsy Inc.
- Etsy Inc. - Overview
- Etsy Inc. - Product / Service
- Etsy Inc. - Key news
- Etsy Inc. - Key offerings
- SWOT
- 15.9 iQIYI Inc.
- iQIYI Inc. - Overview
- iQIYI Inc. - Product / Service
- iQIYI Inc. - Key offerings
- SWOT
- 15.10 Meta Platforms Inc.
- Meta Platforms Inc. - Overview
- Meta Platforms Inc. - Business segments
- Meta Platforms Inc. - Key news
- Meta Platforms Inc. - Key offerings
- Meta Platforms Inc. - Segment focus
- SWOT
- 15.11 One97 Communications Ltd.
- One97 Communications Ltd. - Overview
- One97 Communications Ltd. - Product / Service
- One97 Communications Ltd. - Key offerings
- SWOT
- 15.12 PayPal Holdings Inc.
- PayPal Holdings Inc. - Overview
- PayPal Holdings Inc. - Product / Service
- PayPal Holdings Inc. - Key news
- PayPal Holdings Inc. - Key offerings
- SWOT
- 15.13 Renren Inc.
- Renren Inc. - Overview
- Renren Inc. - Business segments
- Renren Inc. - Key news
- Renren Inc. - Key offerings
- Renren Inc. - Segment focus
- SWOT
- 15.14 Shopify Inc.
- Shopify Inc. - Overview
- Shopify Inc. - Product / Service
- Shopify Inc. - Key offerings
- SWOT
- 15.15 SINA Corp.
- SINA Corp. - Overview
- SINA Corp. - Product / Service
- SINA Corp. - Key offerings
- SWOT
- 15.16 Tencent Holdings Ltd.
- Tencent Holdings Ltd. - Overview
- Tencent Holdings Ltd. - Business segments
- Tencent Holdings Ltd. - Key news
- Tencent Holdings Ltd. - Key offerings
- Tencent Holdings Ltd. - Segment focus
- SWOT
- 15.17 X Corp.
- X Corp. - Overview
- X Corp. - Product / Service
- X Corp. - Key offerings
- SWOT
- 15.18 Verizon Communications Inc.
- Verizon Communications Inc. - Overview
- Verizon Communications Inc. - Business segments
- Verizon Communications Inc. - Key news
- Verizon Communications Inc. - Key offerings
- Verizon Communications Inc. - Segment focus
- SWOT
16 Appendix
- 16.2 Inclusions and exclusions checklist
- Inclusions checklist
- Exclusions checklist
- 16.3 Currency conversion rates for US$
- Currency conversion rates for US$
- 16.4 Research methodology
- 16.7 Validation techniques employed for market sizing
- Validation techniques employed for market sizing
- 16.9 360 degree market analysis
- 360 degree market analysis
- 16.10 List of abbreviations
Research Framework
Technavio presents a detailed picture of the market by way of study, synthesis, and summation of data from multiple sources. The analysts have presented the various facets of the market with a particular focus on identifying the key industry influencers. The data thus presented is comprehensive, reliable, and the result of extensive research, both primary and secondary.
INFORMATION SOURCES
Primary sources
- Manufacturers and suppliers
- Channel partners
- Industry experts
- Strategic decision makers
Secondary sources
- Industry journals and periodicals
- Government data
- Financial reports of key industry players
- Historical data
- Press releases

DATA ANALYSIS
Data Synthesis
- Collation of data
- Estimation of key figures
- Analysis of derived insights
Data Validation
- Triangulation with data models
- Reference against proprietary databases
- Corroboration with industry experts

REPORT WRITING
Qualitative
- Market drivers
- Market challenges
- Market trends
- Five forces analysis
Quantitative
- Market size and forecast
- Market segmentation
- Geographical insights
- Competitive landscape