
Sports Coaching Market Size 2026-2030
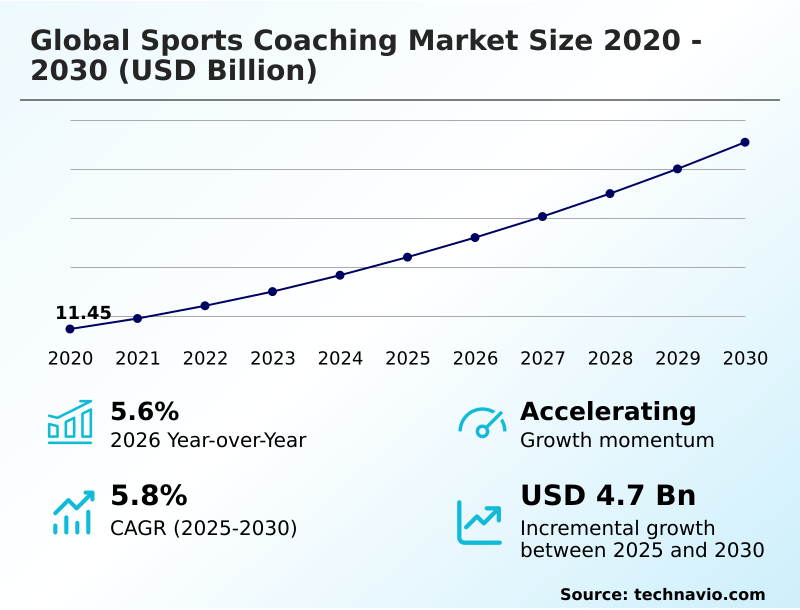
The sports coaching market size is valued to increase by USD 4.70 billion, at a CAGR of 5.8% from 2025 to 2030. Integration of AI and predictive analytics will drive the sports coaching market.
Major Market Trends & Insights
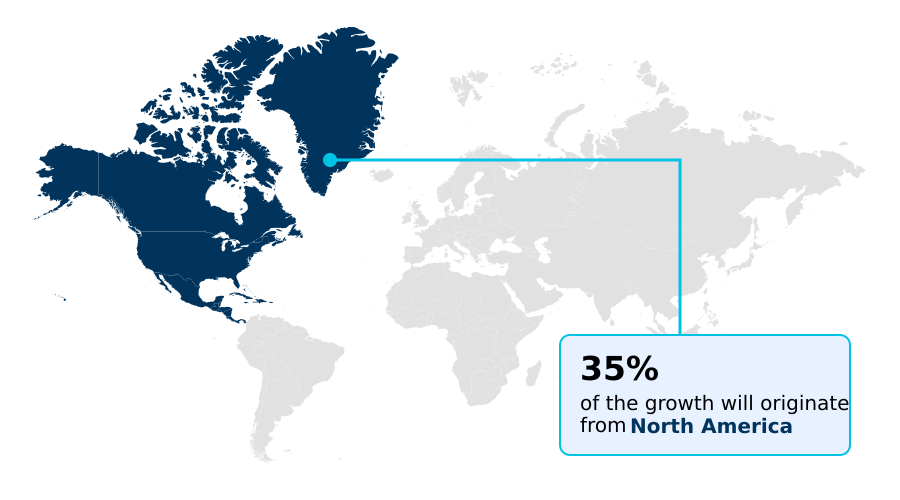
- North America dominated the market and accounted for a 35.1% growth during the forecast period.
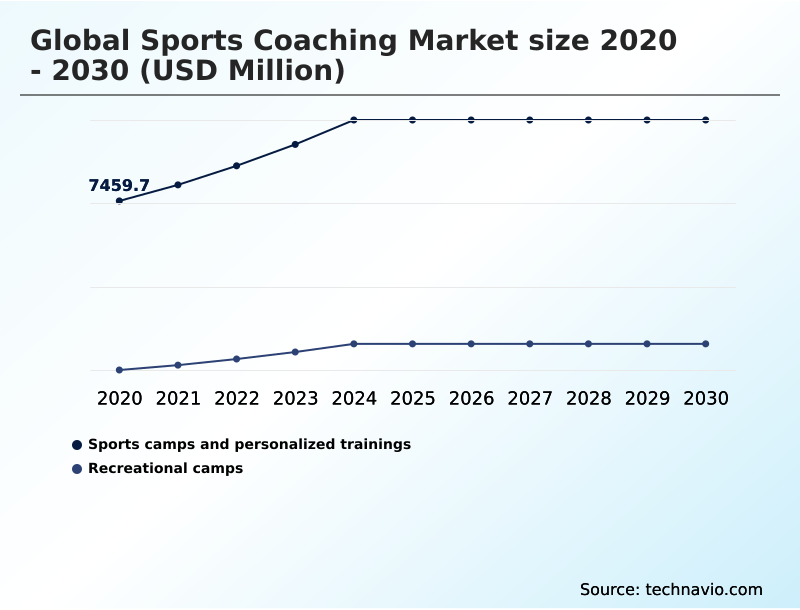
- By Type - Sports camps and personalized trainings segment was valued at USD 9.12 billion in 2024
- By Application - Men segment accounted for the largest market revenue share in 2024
Market Size & Forecast
- Market Opportunities: USD 7.64 billion
- Market Future Opportunities: USD 4.70 billion
- CAGR from 2025 to 2030 : 5.8%
Market Summary
- The sports coaching market is undergoing a significant transformation, moving from experience-based instruction to a data-centric paradigm defined by high-precision analytics. This evolution is driven by the integration of artificial intelligence and machine learning, which now form the intelligence layer for optimizing athlete performance and mitigating injury risk.
- Technologies such as wearable sensors and optical tracking systems generate massive datasets, which are processed by predictive models to identify physiological warning signs and tactical patterns invisible to the human eye. For instance, a professional team can now deploy a unified performance infrastructure that synthesizes biometric data, video analysis, and historical performance metrics into a single digital interface.
- This allows a data-informed strategist to manage athlete load with scientific precision, reducing the likelihood of non-contact injuries and ensuring key players are available for critical matches.
- This shift is also democratizing elite-level insights, as more affordable digital coaching platforms and AI-powered training platforms make advanced analytics accessible to youth academies and amateur athletes, fostering a more globalized and evidence-based athletic development ecosystem. This reliance on data necessitates robust data governance to manage sensitive athlete information effectively.
What will be the Size of the Sports Coaching Market during the forecast period?
Get Key Insights on Market Forecast (PDF) Get Free Sample
How is the Sports Coaching Market Segmented?
The sports coaching industry research report provides comprehensive data (region-wise segment analysis), with forecasts and estimates in "USD million" for the period 2026-2030, as well as historical data from 2020-2024 for the following segments.
- Type
- Sports camps and personalized trainings
- Recreational camps
- Application
- Men
- Women
- Kids
- Business model
- Offline
- Online
- Geography
- North America
- US
- Canada
- Mexico
- Europe
- UK
- Germany
- France
- APAC
- China
- India
- Japan
- South America
- Brazil
- Argentina
- Middle East and Africa
- Saudi Arabia
- UAE
- South Africa
- Rest of World (ROW)
- North America
By Type Insights
The sports camps and personalized trainings segment is estimated to witness significant growth during the forecast period.
The sports camps and personalized trainings segment is shifting toward high-intensity, data-driven regimens using advanced performance analytics and other data-driven methodologies.
This evolution is marked by the integration of AI-powered training platforms for tactical analysis and the adoption of high-performance computing to process complex athletic data.
The use of digital coaching platforms is expanding, allowing for scalable, personalized programming through automated scheduling and performance tracking.
Innovations in sports anthropometry and athlete performance tracking allow coaches to move beyond subjective observation to objective analysis of biomechanical efficiency and physiological load.
This focus on skill acquisition models and athletic development ecosystem reportedly reduces coach preparation time by over 60%, enabling a greater focus on individualized athlete development and remote coaching delivery.
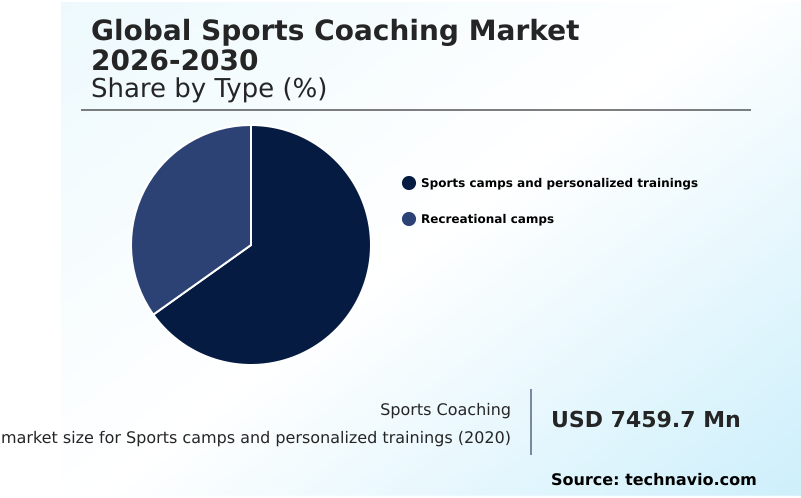
The Sports camps and personalized trainings segment was valued at USD 9.12 billion in 2024 and showed a gradual increase during the forecast period.
Regional Analysis
North America is estimated to contribute 35.1% to the growth of the global market during the forecast period.Technavio’s analysts have elaborately explained the regional trends and drivers that shape the market during the forecast period.
See How Sports Coaching Market Demand is Rising in North America Get Free Sample
The global sports coaching market exhibits distinct regional characteristics, with North America leading in market share, contributing over 35% of the incremental growth, driven by its technologically mature professional and collegiate sports ecosystems.
This region is a hub for sports technology innovation, rapidly adopting immersive video analytics and computer vision to gain a competitive edge. Meanwhile, APAC is the fastest-growing region, with a 6.7% CAGR fueled by government initiatives and rising disposable income.
Countries like China and India are investing heavily in high-performance training centers and digital certification frameworks.
Europe is characterized by a strong focus on professionalization of coaching and stringent data privacy regulations, which influence the design of athlete management modules and team management software.
This landscape highlights a global trend toward combining real-time feedback with personalized training programs.
Market Dynamics
Our researchers analyzed the data with 2025 as the base year, along with the key drivers, trends, and challenges. A holistic analysis of drivers will help companies refine their marketing strategies to gain a competitive advantage.
- The future of the global sports coaching market 2026-2030 is being shaped by highly specific, technology-driven applications that are transitioning from niche advantages to mainstream requirements. The use of AI for athlete performance optimization is becoming a standard tool for professional franchises, enabling a level of personalization in strength and conditioning software that was previously unattainable.
- Concurrently, the application of wearable sensor data for injury prevention is now a critical component of risk management, with teams that effectively use predictive analytics reporting a greater reduction in non-contact injuries than those relying on traditional methods.
- This data-centric approach extends to game strategy, where AI copilots for tactical game planning are helping coaches identify and exploit opponent weaknesses in real-time. The democratization of these tools is most evident in the use of gamification for youth athletic training, which leverages adaptive learning principles to drive engagement and skill mastery at the grassroots level.
- Furthermore, the rise of remote coaching for endurance athletes, powered by high-fidelity data analytics from mobile devices, is breaking down geographical barriers and making elite-level guidance more accessible.
- The effective integration of video analysis in professional team sports is now dependent on managing athlete load with predictive analytics, creating a holistic, data-informed coaching environment that optimizes both individual and team outcomes.
What are the key market drivers leading to the rise in the adoption of Sports Coaching Industry?
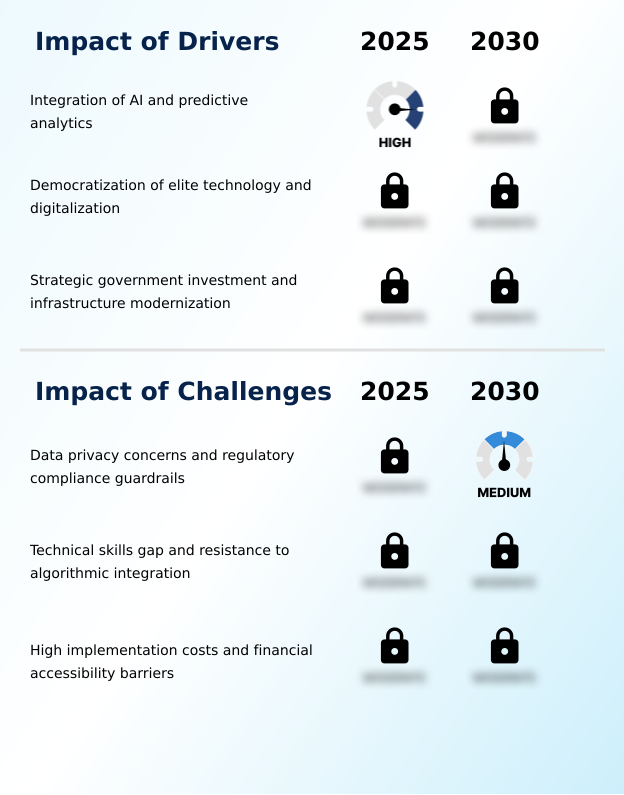
- The primary driver for the market is the integration of artificial intelligence and predictive analytics to enhance athlete performance and coaching effectiveness.
- Market growth is primarily driven by the integration of AI and predictive analytics, which has become foundational to modern coaching.
- Organizations are leveraging these technologies to optimize performance and mitigate injury risks, with 82% of professional sports bodies reporting tangible results from AI adoption. This data-driven methodology relies on wearable sensors and advanced video analysis to inform tactical decision making.
- Another significant driver is the democratization of elite technology, where mobile-first platforms and affordable strength and conditioning software make high-level analytics accessible to youth sports.
- This fosters a more inclusive athletic development ecosystem and supports talent identification and scouting based on objective metrics.
What are the market trends shaping the Sports Coaching Industry?
- A key market trend is the shift toward unified performance infrastructure. This transition enables the delivery of real-time, actionable feedback to coaching staff and athletes.
- Key trends are reshaping the market, with a notable shift toward a unified performance infrastructure that provides real-time feedback. This transition moves beyond isolated tools, integrating biometric data and optical tracking into a single intelligence layer for holistic athlete development. The rise of agentic AI and automated tactical copilots is another transformative trend, automating administrative and analytical tasks.
- These systems, utilizing natural language processing, allow coaches to focus on high-value instruction. This automation of tactical analysis, which can reduce manual review by over 80%, is enabling more sophisticated coaching curriculum management and evidence-based training protocols, even at grassroots levels, while enhancing coach-athlete communication.
What challenges does the Sports Coaching Industry face during its growth?
- A key market challenge involves navigating data privacy concerns and adhering to complex regulatory compliance guardrails for athlete information.
- The market faces significant challenges, primarily concerning data privacy and the technical skills gap. As coaching becomes more reliant on granular biometric data and player readiness checks, organizations must navigate complex data governance and security regulations, which require substantial investment and create legal burdens. This issue is compounded by a lack of unified global standards.
- Furthermore, a widening technical skills gap inhibits the adoption of advanced tools like digital twin simulations and foot-mounted IMU sensors. Many coaches lack the expertise to interpret complex datasets, leading to underutilization of technology. High implementation costs for comprehensive systems also create a financial barrier, stratifying the market.
Exclusive Technavio Analysis on Customer Landscape
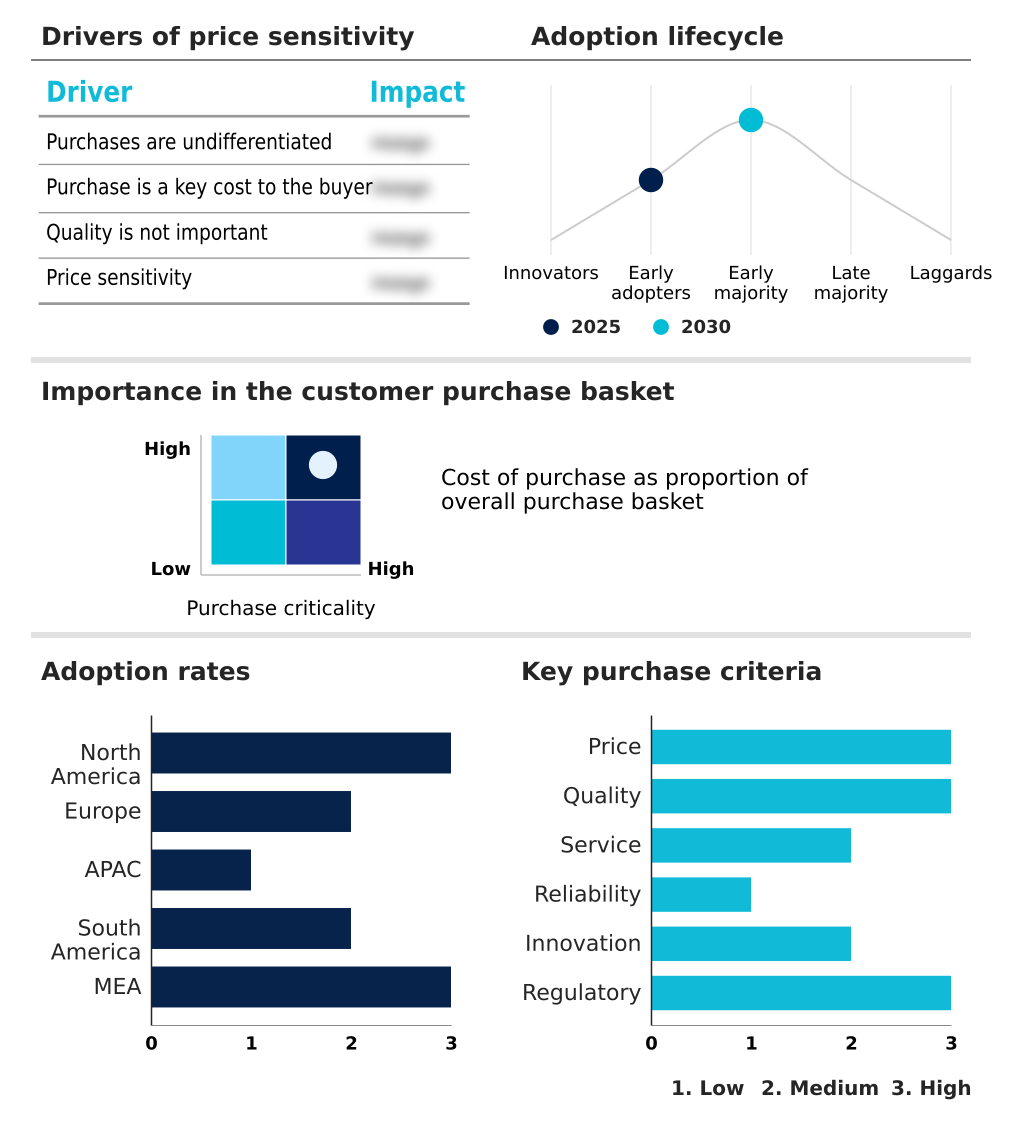
The sports coaching market forecasting report includes the adoption lifecycle of the market, covering from the innovator’s stage to the laggard’s stage. It focuses on adoption rates in different regions based on penetration. Furthermore, the sports coaching market report also includes key purchase criteria and drivers of price sensitivity to help companies evaluate and develop their market growth analysis strategies.
Customer Landscape of Sports Coaching Industry
Competitive Landscape
Companies are implementing various strategies, such as strategic alliances, sports coaching market forecast, partnerships, mergers and acquisitions, geographical expansion, and product/service launches, to enhance their presence in the industry.
Agile Sports Technologies Inc. - Key offerings include sports coaching platforms providing athlete development tools, performance tracking, remote coaching delivery, and comprehensive recruiting management solutions.
The industry research and growth report includes detailed analyses of the competitive landscape of the market and information about key companies, including:
- Agile Sports Technologies Inc.
- BridgeAthletic Inc.
- Catapult Group International
- CoachNow
- CoachUp Inc.
- Exos Works Inc.
- Firstbeat Technologies Oy
- IMG Academy
- iSport360 Inc.
- Little Kickers Group Ltd
- PlayMetrics LLC
- Sideline Power LLC
- Skillest Inc.
- Sportlyzer LLC
- SportsEngine Inc.
- TeamBuildr LLC
- TeamSnap Inc.
- Titleist Performance Institute
- TrainingPeaks LLC
- US Sports Camps
Qualitative and quantitative analysis of companies has been conducted to help clients understand the wider business environment as well as the strengths and weaknesses of key industry players. Data is qualitatively analyzed to categorize companies as pure play, category-focused, industry-focused, and diversified; it is quantitatively analyzed to categorize companies as dominant, leading, strong, tentative, and weak.
Recent Development and News in Sports coaching market
- In March, 2025, Catapult introduced the Vector 8 system, an advanced athlete monitoring platform using sophisticated algorithms to deliver real-time performance insights and biomechanical data with exceptional speed and density.
- In January, 2026, the NBA Launchpad program selected Swish Basket, an AI-powered basketball training and gaming platform designed to bring advanced shooting analytics and gamified training to youth players.
- In April, 2026, HCLTech expanded its strategic partnership with the New York Giants and New York Jets to serve as the Official AI Partner for MetLife Stadium, focusing on intelligent player management and facility operations.
- In May, 2026, Adobe Inc. and Dick Sporting Goods announced a strategic partnership to deploy generative artificial intelligence Digital Coaches within the retailer's mobile application to provide personalized training tips.
Dive into Technavio’s robust research methodology, blending expert interviews, extensive data synthesis, and validated models for unparalleled Sports Coaching Market insights. See full methodology.
| Market Scope | |
|---|---|
| Page number | 283 |
| Base year | 2025 |
| Historic period | 2020-2024 |
| Forecast period | 2026-2030 |
| Growth momentum & CAGR | Accelerate at a CAGR of 5.8% |
| Market growth 2026-2030 | USD 4703.5 million |
| Market structure | Fragmented |
| YoY growth 2025-2026(%) | 5.6% |
| Key countries | US, Canada, Mexico, UK, Germany, France, Italy, Spain, The Netherlands, China, India, Japan, South Korea, Australia, Indonesia, Brazil, Argentina, Chile, Saudi Arabia, UAE, South Africa, Egypt and Nigeria |
| Competitive landscape | Leading Companies, Market Positioning of Companies, Competitive Strategies, and Industry Risks |
Research Analyst Overview
- The global sports coaching market 2026-2030 is undergoing a structural shift from subjective instruction to a data-driven paradigm, where artificial intelligence and machine learning are foundational. This transition is powered by an ecosystem of technologies including wearable sensors, optical tracking, and digital twin simulations, which provide the biometric data for sophisticated predictive analytics.
- The integration of high-fidelity data analytics enables real-time feedback and tactical analysis, redefining the coach's role into that of a data-informed strategist.
- For instance, the deployment of agentic AI and automated tactical copilots, which can reduce manual video analysis time by up to 85%, is forcing a strategic reallocation of budgets toward both technology acquisition and staff upskilling in computer vision and natural language processing.
- This evolution toward a unified performance infrastructure, where immersive video analytics and performance analytics converge, is critical for competitive success. The market's trajectory is defined by the dual pursuit of performance optimization and the gamification of training to engage a new generation of athletes through adaptive learning and player readiness checks.
What are the Key Data Covered in this Sports Coaching Market Research and Growth Report?
-
What is the expected growth of the Sports Coaching Market between 2026 and 2030?
-
USD 4.70 billion, at a CAGR of 5.8%
-
-
What segmentation does the market report cover?
-
The report is segmented by Type (Sports camps and personalized trainings, and Recreational camps), Application (Men, Women, and Kids), Business Model (Offline, and Online) and Geography (North America, Europe, APAC, South America, Middle East and Africa)
-
-
Which regions are analyzed in the report?
-
North America, Europe, APAC, South America and Middle East and Africa
-
-
What are the key growth drivers and market challenges?
-
Integration of AI and predictive analytics, Data privacy concerns and regulatory compliance guardrails
-
-
Who are the major players in the Sports Coaching Market?
-
Agile Sports Technologies Inc., BridgeAthletic Inc., Catapult Group International, CoachNow, CoachUp Inc., Exos Works Inc., Firstbeat Technologies Oy, IMG Academy, iSport360 Inc., Little Kickers Group Ltd, PlayMetrics LLC, Sideline Power LLC, Skillest Inc., Sportlyzer LLC, SportsEngine Inc., TeamBuildr LLC, TeamSnap Inc., Titleist Performance Institute, TrainingPeaks LLC and US Sports Camps
-
Market Research Insights
- Market dynamics are shaped by a strategic push toward performance optimization, where sports science integration and evidence-based training protocols are becoming standard. Organizations are leveraging remote coaching solutions and team management software to create a cohesive athletic development ecosystem. This technological adoption yields significant efficiencies, with some automated video tagging tools reducing manual analysis time by up to 85%.
- However, a technical skills gap presents a challenge, as staff require new competencies to utilize advanced platforms for athlete load management and tactical decision making. While 82% of professional organizations have adopted artificial intelligence, the high cost of implementation creates a divide, limiting access for smaller clubs and amplifying the competitive advantage of well-funded teams.
We can help! Our analysts can customize this sports coaching market research report to meet your requirements.
 RIA -
RIA - 
