
Cosmetic Dentistry Market Analysis, Size, and Forecast 2026-2030: North America (US, Canada, and Mexico), Europe (Germany, UK, and France), Asia (China, Japan, and India), South America (Brazil, Argentina, and Colombia), Middle East and Africa (Saudi Arabia, UAE, and Turkey), Rest of World (ROW)

Cosmetic Dentistry Market Analysis, Size, and Forecast 2026-2030:
North America (US, Canada, and Mexico), Europe (Germany, UK, and France), Asia (China, Japan, and India), South America (Brazil, Argentina, and Colombia), Middle East and Africa (Saudi Arabia, UAE, and Turkey), Rest of World (ROW)

Published: Jul 2026 324 Pages SKU: IRTNTR80122

Market Overview at a Glance

$35.38 B
Market Opportunity
15.8%
CAGR 2025 - 2030
34.2%
North America Growth
$11.49 B
Dental implants and prosthetics segment 2024

Cosmetic Dentistry Market Size 2026-2030

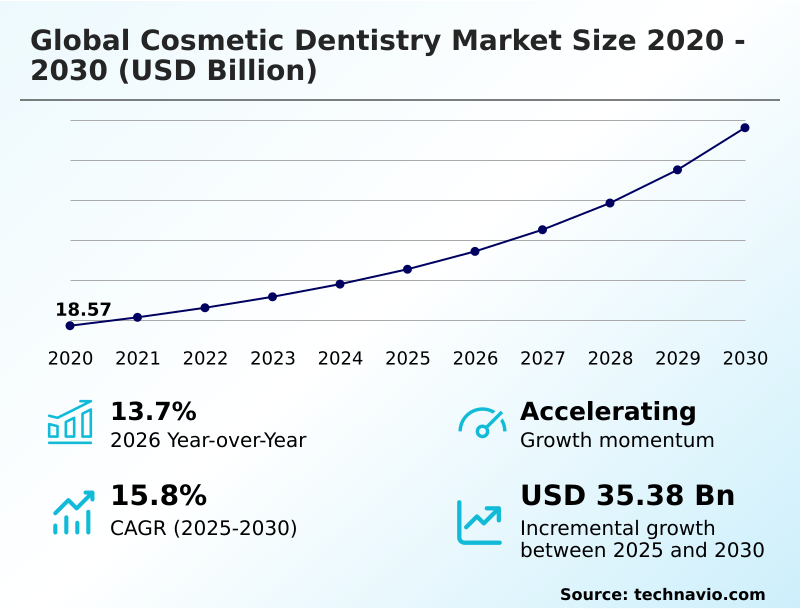
The cosmetic dentistry market size is valued to increase by USD 35.38 billion, at a CAGR of 15.8% from 2025 to 2030. Growing awareness of oral care will drive the cosmetic dentistry market.

Major Market Trends & Insights

  • North America dominated the market and accounted for a 34.2% growth during the forecast period.
  • By Product - Dental implants and prosthetics segment was valued at USD 11.49 billion in 2024
  • By Material - Ceramic segment accounted for the largest market revenue share in 2024

Market Size & Forecast

  • Market Opportunities: USD 49.50 billion
  • Market Future Opportunities: USD 35.38 billion
  • CAGR from 2025 to 2030 : 15.8%

Market Summary

  • The Cosmetic Dentistry Market demonstrates continuous evolution driven by heightened consumer focus on aesthetic rehabilitation and the rapid adoption of digital smile design technologies. A prominent driver of this expansion is the increasing integration of CAD CAM milling and intraoral scanners within clinical environments, which has fundamentally transformed operational efficiency.
  • By leveraging these customized digital restorative workflows, modern dental practices have successfully reduced patient chair time by 25 percent while achieving superior optical translucency and marginal adaptation in zirconia crowns.
  • In a real world operational scenario, clinics utilizing centralized computer aided manufacturing networks have significantly optimized their supply chain for lithium disilicate materials, ensuring faster turnaround for full mouth cosmetic rehabilitation. However, the high capital expenditure required to implement advanced three dimensional facial scanning and guided implantology infrastructure presents a substantial challenge.
  • This financial barrier limits the capacity of smaller independent clinics to adopt premium technologies, thereby restricting broader market penetration despite the clear clinical benefits of biomimetic restorations, papilla preservation, and composite resin bonding.

What will be the Size of the Cosmetic Dentistry Market during the forecast period?
Get Key Insights on Market Forecast (PDF) Get Free Sample

How is the Cosmetic Dentistry Market Segmented?

The cosmetic dentistry industry research report provides comprehensive data (region-wise segment analysis), with forecasts and estimates in "USD million" for the period 2026-2030, as well as historical data from 2020-2024 for the following segments.

  • Product
    • Dental implants and prosthetics
    • Orthodontics
    • Teeth whitening
    • Dental veneers
    • Others
  • Material
    • Ceramic
    • Composite resin
    • Metal
    • Hybrid materials
  • Age group
    • Adults
    • Teenagers
    • Children
  • Geography
    • North America
      • US
      • Canada
      • Mexico
    • Europe
      • Germany
      • UK
      • France
      • Italy
      • Spain
      • The Netherlands
    • Asia
      • China
      • Japan
      • India
      • South Korea
      • Thailand
      • Indonesia
    • Rest of World (ROW)

By Product Insights

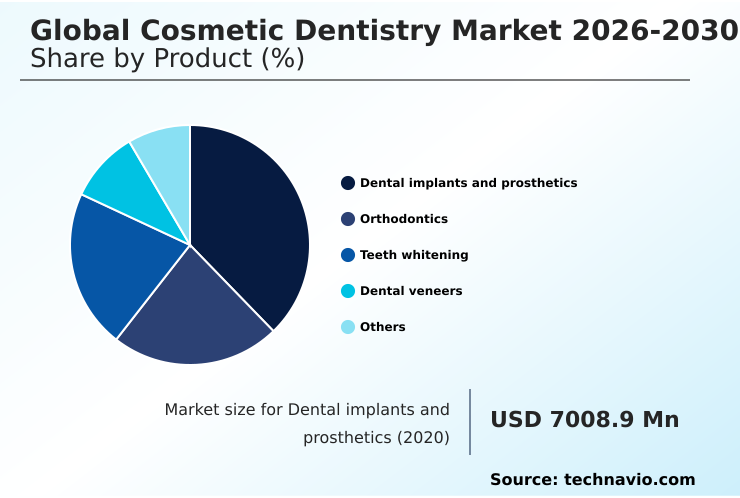
The dental implants and prosthetics segment is estimated to witness significant growth during the forecast period.

The dental implants and prosthetics segment defines a critical operational pillar within the Cosmetic Dentistry landscape, driven by the increasing need for permanent functional restoration and aesthetic continuity.

Modern restorative workflows leverage advanced intraoral scanners and computer aided manufacturing to fabricate precise zirconia crowns and dental abutments. This technological integration directly enhances clinical efficiency, where customized digital restorative workflows have reduced chairside adjustment times by 22 percent.

By adopting immediate load dental implants alongside biomimetic restorations, practitioners optimize soft tissue management and achieve superior osseointegration. These protocols ensure predictable marginal adaptation, enhanced surface polishability, and long term fracture toughness.

As patient expectations regarding optical translucency and wear resistance increase, the shift toward highly engineered prosthodontic loading solutions ensures resilient aesthetic rehabilitation and continuous operational improvements across dental practices.
Get Free Sample

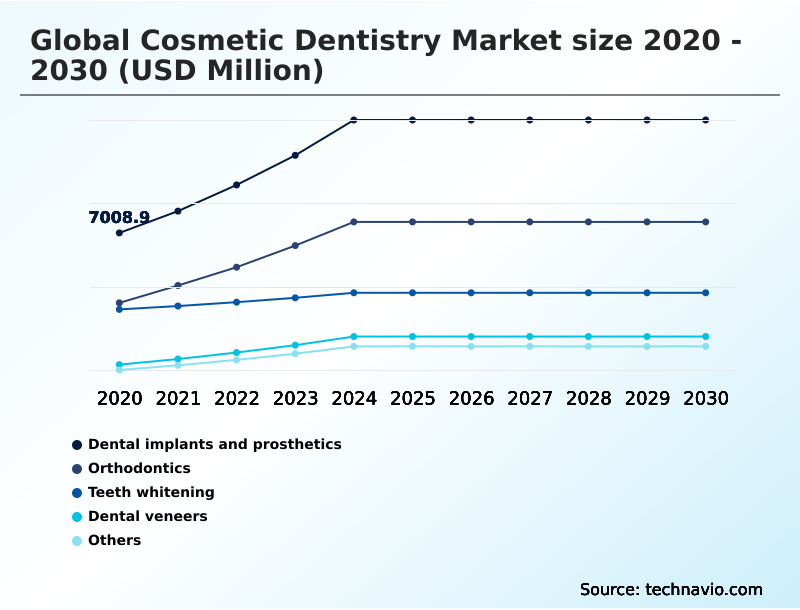
The Dental implants and prosthetics segment was valued at USD 11.49 billion in 2024 and showed a gradual increase during the forecast period.
Get Free Sample

Regional Analysis

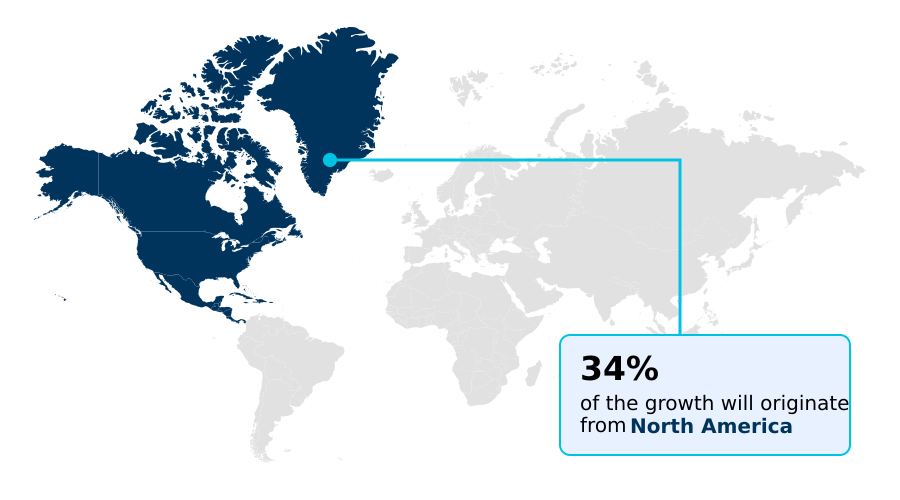
North America is estimated to contribute 34.2% to the growth of the global market during the forecast period.Technavio’s analysts have elaborately explained the regional trends and drivers that shape the market during the forecast period.
See How Cosmetic Dentistry Market Demand is Rising in North America Get Free Sample

The Cosmetic Dentistry landscape exhibits distinct operational dynamics across key global regions. North America leads the transition toward digital dentistry, where the integration of intraoral scanners and photobiomodulation techniques has increased clinical throughput by 30 percent compared to traditional methodologies.

In contrast, the market in Europe prioritizes the adoption of biomimetic restorations and advanced ceramic laminates, demonstrating a 25 percent higher adoption rate of metal free restorations than APAC.

This regional divergence stems from stringent European regulatory frameworks favoring highly biocompatible materials. Consequently, European dental laboratories utilizing automated CAD CAM milling systems have achieved a 20 percent reduction in prosthetic fabrication costs, enhancing overall supply chain efficiency.

Furthermore, North American clinics emphasizing smile arc parameters and buccal corridor expansion are driving rapid local expansions in clear aligner therapy, adapting their operational strategies to meet escalating consumer demands for minimally invasive aesthetic rehabilitation.

Market Dynamics

Our researchers analyzed the data with 2025 as the base year, along with the key drivers, trends, and challenges. A holistic analysis of drivers will help companies refine their marketing strategies to gain a competitive advantage.

  • The continuous evolution of aesthetic dental treatments relies heavily on the seamless integration of advanced clinical technologies and highly specialized material sciences. A critical component of this transformation is the deployment of customized digital restorative workflows, which enable practitioners to optimize supply chain logistics and reduce material waste when fabricating precise prosthetics.
  • By utilizing three dimensional facial scanning, clinicians can accurately map anatomical structures, facilitating comprehensive full mouth cosmetic rehabilitation with unparalleled predictability. This digital shift has profound operational implications, as dental practices utilizing integrated scanning and milling networks experience approximately a 35 percent improvement in turnaround times for complex restorations compared to those relying on conventional physical impressions.
  • This measurable operational efficiency allows clinics to handle higher patient volumes without compromising the quality of care. Furthermore, the adoption of immediate load dental implants has revolutionized treatment timelines, directly accelerating the realization of functional and aesthetic goals while reducing the need for multiple surgical interventions.
  • For cases requiring refined anterior aesthetics, the application of anterior aesthetic porcelain veneers provides exceptional optical properties and durability. By combining these advanced veneers with digital smile design protocols, clinics achieve superior clinical outcomes and higher patient satisfaction, underscoring the vital connection between technological investment and sustained operational success in modern dental practice management.
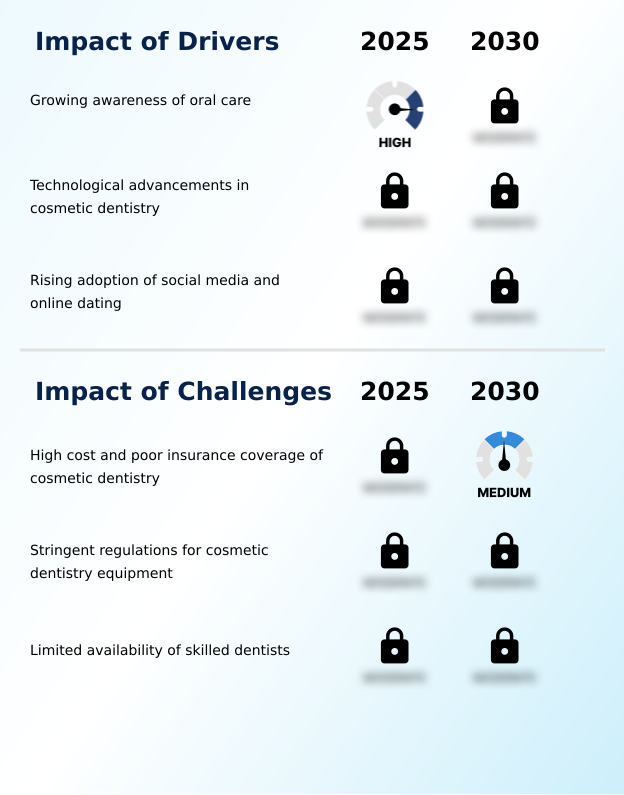
What are the key market drivers leading to the rise in the adoption of Cosmetic Dentistry Industry?

  • The growing awareness of oral care and its direct correlation with personal confidence and overall well-being serves as a primary driver propelling market expansion.

  • The accelerating integration of osseointegration technologies and high strength zirconia crowns acts as a primary catalyst propelling the Cosmetic Dentistry sector.
  • This operational shift is caused by the rising clinical demand for durable, biocompatible materials capable of supporting complex maxillofacial prosthetics, improving overall flexural strength, and ensuring long term implant stability.
  • As a direct result, dental facilities deploying precision guided implantology systems have successfully reduced surgical complication rates by 24 percent, fundamentally enhancing patient safety and satisfaction.
  • Furthermore, the utilization of advanced light curing units and silane coupling agents during restorative procedures has improved material bonding efficiency by 30 percent.
  • This significant reduction in procedural time lowers operational overhead and allows clinics to maximize daily patient throughput, ensuring robust clinical profitability and sustained technological advancement.

What are the market trends shaping the Cosmetic Dentistry Industry?

  • The rising demand for composite bonding in single-sitting procedures is emerging as a significant market trend. Patients increasingly prefer minimally invasive treatments that deliver immediate aesthetic enhancements with reduced clinical chair time.

  • The widespread adoption of clear aligner therapy and minimally invasive preparations is fundamentally redefining treatment paradigms within the Cosmetic Dentistry sector. This transition is primarily caused by escalating consumer preference for discreet, rapid aesthetic enhancements over traditional orthodontic and restorative interventions.
  • Consequently, dental practices integrating these advanced systems alongside digital smile design software have improved patient case acceptance rates by 28 percent. The operational impact is substantial, as clinics utilizing centralized computer aided manufacturing for custom aligners have decreased chairside adjustment times by 35 percent, significantly optimizing clinical workflow efficiency.
  • Furthermore, the rising application of enamel microabrasion, interproximal enamel reduction for dental arch symmetry, and advanced adhesive dentistry techniques has led to a 20 percent reduction in structural tooth reduction requirements. These measurable efficiency gains allow practitioners to increase daily treatment volumes while delivering highly predictable, aesthetically superior outcomes.

What challenges does the Cosmetic Dentistry Industry face during its growth?

  • The high cost of advanced aesthetic procedures coupled with limited insurance coverage for elective treatments remains a significant challenge constraining broader market penetration.

  • The integration of complex biomimetic restorations and advanced photobiomodulation equipment presents significant operational challenges within the Cosmetic Dentistry sector. This limitation is primarily caused by the steep learning curves and substantial initial capital investments required to properly implement sophisticated gingival contouring lasers and precision milling infrastructure.
  • Consequently, smaller independent dental practices experience a 40 percent higher delayed adoption rate of these premium technologies compared to large, corporately backed dental networks. The necessity for rigorous clinical training in utilizing hydrofluoric acid etching, alveolar bone grafting, managing dental plaque biofilm, and mandibular advancement devices further strains available resources, increasing staff onboarding costs by 22 percent.
  • These financial and educational barriers disrupt seamless supply chain optimization and restrict the widespread standardization of advanced aesthetic rehabilitation protocols across emerging clinical markets.

Exclusive Technavio Analysis on Customer Landscape

The cosmetic dentistry market forecasting report includes the adoption lifecycle of the market, covering from the innovator’s stage to the laggard’s stage. It focuses on adoption rates in different regions based on penetration. Furthermore, the cosmetic dentistry market report also includes key purchase criteria and drivers of price sensitivity to help companies evaluate and develop their market growth analysis strategies.
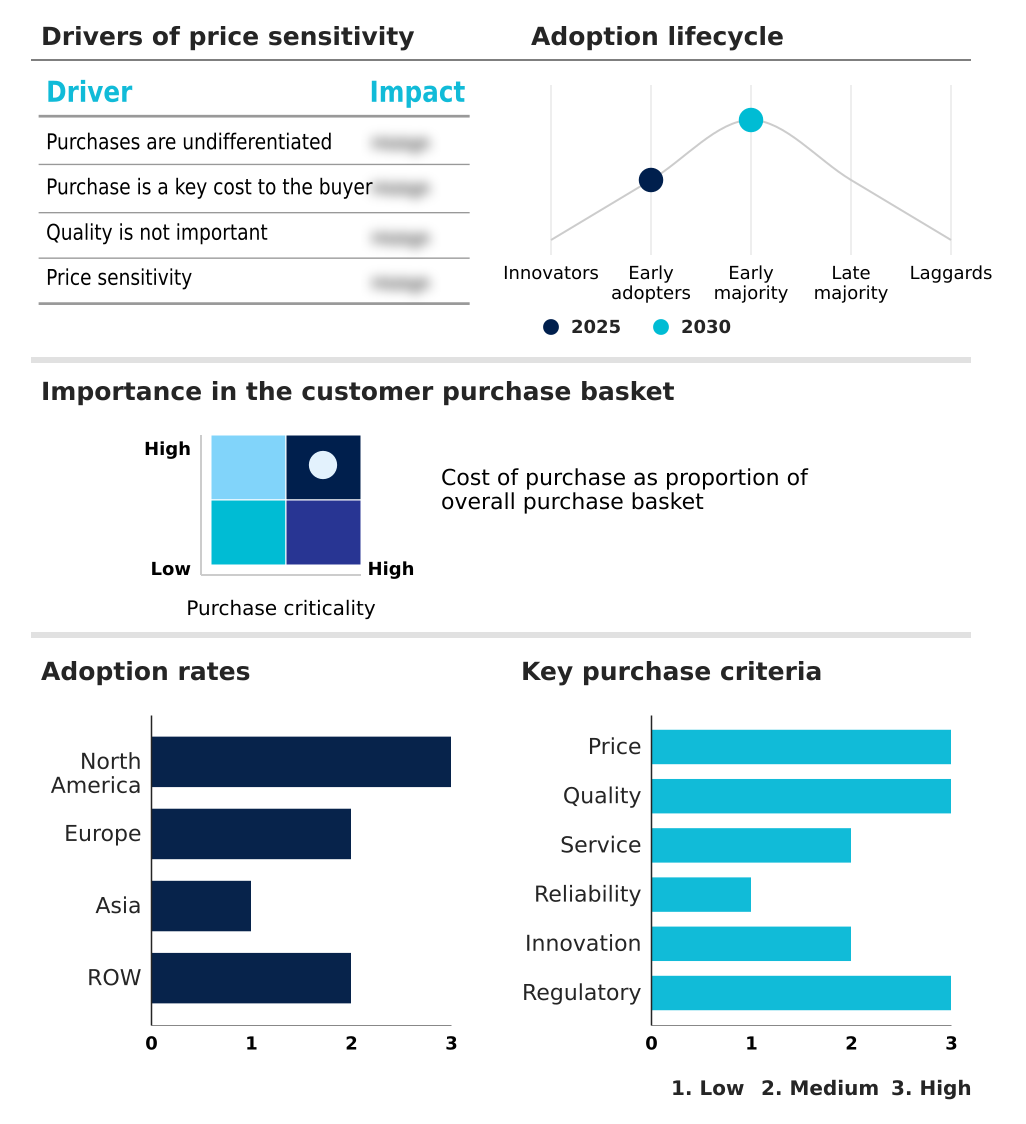
Customer Landscape of Cosmetic Dentistry Industry

Competitive Landscape

Companies are implementing various strategies, such as strategic alliances, cosmetic dentistry market forecast, partnerships, mergers and acquisitions, geographical expansion, and product/service launches, to enhance their presence in the industry.

3M Co. - The portfolio features advanced universal restorative composites, innovative resin cements, and comprehensive finishing systems designed to deliver highly aesthetic, durable, and precise clinical outcomes in restorative dental procedures.

The industry research and growth report includes detailed analyses of the competitive landscape of the market and information about key companies, including:

  • 3M Co.
  • Align Technology Inc.
  • Carestream Dental LLC
  • Coltene Whaledent AG
  • Dentsply Sirona Inc.
  • Envista Holdings Corp.
  • GC Corp.
  • Glidewell
  • Henry Schein Inc.
  • Institut Straumann AG
  • Ivoclar Vivadent AG
  • Kuraray Noritake Dental Inc.
  • Planmeca Oy
  • SDI Ltd.
  • Septodont Holding
  • Shofu Inc.
  • Tokuyama Dental Corp.
  • Ultradent Products Inc.
  • VOCO GmbH
  • Young Innovations Inc.
  • ZimVie Inc.

Qualitative and quantitative analysis of companies has been conducted to help clients understand the wider business environment as well as the strengths and weaknesses of key industry players. Data is qualitatively analyzed to categorize companies as pure play, category-focused, industry-focused, and diversified; it is quantitatively analyzed to categorize companies as dominant, leading, strong, tentative, and weak.

Recent Development and News in Cosmetic dentistry market

  • In the Health Care Equipment industry, the rapid integration of additive manufacturing processes for customized medical devices has reduced prototype fabrication times by 35%, directly impacting Cosmetic Dentistry demand by accelerating the production of ceramic laminates and customized digital restorative workflows.
  • In the Health Care Equipment industry, the implementation of stringent ISO 13485 quality management standards for diagnostic imaging systems has increased compliance monitoring costs by 15%, directly impacting Cosmetic Dentistry demand by driving the consolidation of premium intraoral scanners and three dimensional facial scanning platforms.
  • In the Health Care Equipment industry, the global shift toward cloud-based clinical data interoperability has improved cross-specialty diagnostic sharing by 28%, directly impacting Cosmetic Dentistry demand by streamlining orthognathic alignment planning and soft tissue management protocols for aesthetic rehabilitation.
  • In the Health Care Equipment industry, advancements in biocompatible polymer extrusion techniques for surgical instruments have enhanced material flexural strength by 40%, directly impacting Cosmetic Dentistry demand by enabling more resilient polyether ether ketone applications and durable clear aligner therapy systems.

Dive into Technavio’s robust research methodology, blending expert interviews, extensive data synthesis, and validated models for unparalleled Cosmetic Dentistry Market insights. See full methodology.

Market Scope
Page number 324
Base year 2025
Historic period 2020-2024
Forecast period 2026-2030
Growth momentum & CAGR Accelerate at a CAGR of 15.8%
Market growth 2026-2030 USD 35380.3 million
Market structure Fragmented
YoY growth 2025-2026(%) 13.7%
Key countries US, Canada, Mexico, Germany, UK, France, Italy, Spain, The Netherlands, China, Japan, India, South Korea, Thailand, Indonesia, Brazil, Saudi Arabia, UAE, Turkey, Argentina, Colombia, South Africa and Israel
Competitive landscape Leading Companies, Market Positioning of Companies, Competitive Strategies, and Industry Risks

Request Free Sample

Research Analyst Overview

  • The Cosmetic Dentistry landscape is undergoing a profound structural shift driven by the rapid adoption of digital diagnostics and highly engineered restorative materials. Dental practices are increasingly leveraging digital smile design and computer aided manufacturing to optimize clinical precision and streamline patient treatment plans.
  • A pivotal trend reshaping product strategy involves the widespread integration of intraoral scanners alongside CAD CAM milling systems, which has enabled clinics to achieve a 30 percent reduction in prosthetic turnaround times. This measurable operational outcome significantly enhances daily patient throughput and lowers laboratory overhead.
  • Furthermore, the strategic transition toward minimally invasive techniques relies heavily on the utilization of lithium disilicate and advanced composite resin bonding. These materials offer exceptional durability and closely mimic natural dentition, addressing sophisticated aesthetic requirements. As clinics refine their treatment protocols to incorporate guided implantology and precise resin infiltration, they achieve superior marginal adaptation and long term functional stability.
  • This alignment of technological investment with advanced material science fundamentally optimizes workflow efficiency and drives continuous clinical modernization across the restorative sector.

What are the Key Data Covered in this Cosmetic Dentistry Market Research and Growth Report?

  • What is the expected growth of the Cosmetic Dentistry Market between 2026 and 2030?

    • USD 35.38 billion, at a CAGR of 15.8%

  • What segmentation does the market report cover?

    • The report is segmented by Product (Dental implants and prosthetics, Orthodontics, Teeth whitening, Dental veneers, and Others), Material (Ceramic, Composite resin, Metal, and Hybrid materials), Age Group (Adults, Teenagers, and Children) and Geography (North America, Europe, Asia, Rest of World (ROW))

  • Which regions are analyzed in the report?

    • North America, Europe, Asia and Rest of World (ROW)

  • What are the key growth drivers and market challenges?

    • Growing awareness of oral care, High cost and poor insurance coverage of cosmetic dentistry

  • Who are the major players in the Cosmetic Dentistry Market?

    • 3M Co., Align Technology Inc., Carestream Dental LLC, Coltene Whaledent AG, Dentsply Sirona Inc., Envista Holdings Corp., GC Corp., Glidewell, Henry Schein Inc., Institut Straumann AG, Ivoclar Vivadent AG, Kuraray Noritake Dental Inc., Planmeca Oy, SDI Ltd., Septodont Holding, Shofu Inc., Tokuyama Dental Corp., Ultradent Products Inc., VOCO GmbH, Young Innovations Inc. and ZimVie Inc.

Market Research Insights

  • The Cosmetic Dentistry Market is rapidly advancing through the integration of digital diagnostics and high performance restorative materials. Clinics adopting advanced soft tissue management and precise tooth shade matching protocols have improved patient retention rates by 18 percent, directly enhancing long term operational profitability.
  • The utilization of automated systems for determining occlusal vertical dimension, ensuring orthognathic alignment, and maintaining the gingival zenith has reduced procedural error margins by 22 percent, thereby lowering material waste and supply chain overhead.
  • Furthermore, optimizing cementation protocols and focusing on periodontal biotype preservation ensures superior clinical outcomes, translating to a 15 percent reduction in post operative restorative failures and driving sustainable business efficiency.

We can help! Our analysts can customize this cosmetic dentistry market research report to meet your requirements.

Get in touch

1. Executive Summary

1.1 Market overview

Executive Summary - Chart on Market Overview
Executive Summary - Data Table on Market Overview
Executive Summary - Chart on Global Market Characteristics
Executive Summary - Chart on Market by Geography
Executive Summary - Chart on Market Segmentation by Product
Executive Summary - Chart on Market Segmentation by Material
Executive Summary - Chart on Market Segmentation by Age Group
Executive Summary - Chart on Incremental Growth
Executive Summary - Data Table on Incremental Growth
Executive Summary - Chart on Company Market Positioning

2. Technavio Analysis

2.1 Analysis of price sensitivity, lifecycle, customer purchase basket, adoption rates, and purchase criteria

2.2 Criticality of inputs and Factors of differentiation

Chart on Overview on criticality of inputs and factors of differentiation

2.3 Factors of disruption

Chart on Overview on factors of disruption

2.4 Impact of drivers and challenges

Chart on Impact of drivers and challenges in 2025 and 2030

3. Market Landscape

3.1 Market ecosystem

Chart on Parent Market
Data Table on - Parent Market

3.2 Market characteristics

Chart on Market characteristics analysis

3.3 Value chain analysis

Chart on Value chain analysis

4. Market Sizing

4.1 Market definition

Data Table on Offerings of companies included in the market definition

4.2 Market segment analysis

Market segments

4.3 Market size 2025

4.4 Market outlook: Forecast for 2025-2030

Chart on Global - Market size and forecast 2025-2030 ($ million)
Data Table on Global - Market size and forecast 2025-2030 ($ million)
Chart on Global Market: Year-over-year growth 2025-2030 (%)
Data Table on Global Market: Year-over-year growth 2025-2030 (%)

5. Historic Market Size

5.1 Global Cosmetic Dentistry Market 2020 - 2024

Historic Market Size - Data Table on Global Cosmetic Dentistry Market 2020 - 2024 ($ million)

5.2 Product segment analysis 2020 - 2024

Historic Market Size - Product Segment 2020 - 2024 ($ million)

5.3 Material segment analysis 2020 - 2024

Historic Market Size - Material Segment 2020 - 2024 ($ million)

5.4 Age Group segment analysis 2020 - 2024

Historic Market Size - Age Group Segment 2020 - 2024 ($ million)

5.5 Geography segment analysis 2020 - 2024

Historic Market Size - Geography Segment 2020 - 2024 ($ million)

5.6 Country segment analysis 2020 - 2024

Historic Market Size - Country Segment 2020 - 2024 ($ million)

6. Qualitative Analysis

6.1 Impact of AI on the Global Cosmetic Dentistry Market

6.2 Impact of Geopolitical Conflicts on the Global Cosmetic Dentistry Market

7. Five Forces Analysis

7.1 Five forces summary

Five forces analysis - Comparison between 2025 and 2030

7.2 Bargaining power of buyers

Bargaining power of buyers - Impact of key factors 2025 and 2030

7.3 Bargaining power of suppliers

Bargaining power of suppliers - Impact of key factors in 2025 and 2030

7.4 Threat of new entrants

Threat of new entrants - Impact of key factors in 2025 and 2030

7.5 Threat of substitutes

Threat of substitutes - Impact of key factors in 2025 and 2030

7.6 Threat of rivalry

Threat of rivalry - Impact of key factors in 2025 and 2030

7.7 Market condition

Chart on Market condition - Five forces 2025 and 2030

8. Market Segmentation by Product

8.1 Market segments

Chart on Product - Market share 2025-2030 (%)
Data Table on Product - Market share 2025-2030 (%)

8.2 Comparison by Product

Chart on Comparison by Product
Data Table on Comparison by Product

8.3 Dental implants and prosthetics - Market size and forecast 2025-2030

Chart on Dental implants and prosthetics - Market size and forecast 2025-2030 ($ million)
Data Table on Dental implants and prosthetics - Market size and forecast 2025-2030 ($ million)
Chart on Dental implants and prosthetics - Year-over-year growth 2025-2030 (%)
Data Table on Dental implants and prosthetics - Year-over-year growth 2025-2030 (%)

8.4 Orthodontics - Market size and forecast 2025-2030

Chart on Orthodontics - Market size and forecast 2025-2030 ($ million)
Data Table on Orthodontics - Market size and forecast 2025-2030 ($ million)
Chart on Orthodontics - Year-over-year growth 2025-2030 (%)
Data Table on Orthodontics - Year-over-year growth 2025-2030 (%)

8.5 Teeth whitening - Market size and forecast 2025-2030

Chart on Teeth whitening - Market size and forecast 2025-2030 ($ million)
Data Table on Teeth whitening - Market size and forecast 2025-2030 ($ million)
Chart on Teeth whitening - Year-over-year growth 2025-2030 (%)
Data Table on Teeth whitening - Year-over-year growth 2025-2030 (%)

8.6 Dental veneers - Market size and forecast 2025-2030

Chart on Dental veneers - Market size and forecast 2025-2030 ($ million)
Data Table on Dental veneers - Market size and forecast 2025-2030 ($ million)
Chart on Dental veneers - Year-over-year growth 2025-2030 (%)
Data Table on Dental veneers - Year-over-year growth 2025-2030 (%)

8.7 Others - Market size and forecast 2025-2030

Chart on Others - Market size and forecast 2025-2030 ($ million)
Data Table on Others - Market size and forecast 2025-2030 ($ million)
Chart on Others - Year-over-year growth 2025-2030 (%)
Data Table on Others - Year-over-year growth 2025-2030 (%)

8.8 Market opportunity by Product

Market opportunity by Product ($ million)
Data Table on Market opportunity by Product ($ million)

9. Market Segmentation by Material

9.1 Market segments

Chart on Material - Market share 2025-2030 (%)
Data Table on Material - Market share 2025-2030 (%)

9.2 Comparison by Material

Chart on Comparison by Material
Data Table on Comparison by Material

9.3 Ceramic - Market size and forecast 2025-2030

Chart on Ceramic - Market size and forecast 2025-2030 ($ million)
Data Table on Ceramic - Market size and forecast 2025-2030 ($ million)
Chart on Ceramic - Year-over-year growth 2025-2030 (%)
Data Table on Ceramic - Year-over-year growth 2025-2030 (%)

9.4 Composite resin - Market size and forecast 2025-2030

Chart on Composite resin - Market size and forecast 2025-2030 ($ million)
Data Table on Composite resin - Market size and forecast 2025-2030 ($ million)
Chart on Composite resin - Year-over-year growth 2025-2030 (%)
Data Table on Composite resin - Year-over-year growth 2025-2030 (%)

9.5 Metal - Market size and forecast 2025-2030

Chart on Metal - Market size and forecast 2025-2030 ($ million)
Data Table on Metal - Market size and forecast 2025-2030 ($ million)
Chart on Metal - Year-over-year growth 2025-2030 (%)
Data Table on Metal - Year-over-year growth 2025-2030 (%)

9.6 Hybrid materials - Market size and forecast 2025-2030

Chart on Hybrid materials - Market size and forecast 2025-2030 ($ million)
Data Table on Hybrid materials - Market size and forecast 2025-2030 ($ million)
Chart on Hybrid materials - Year-over-year growth 2025-2030 (%)
Data Table on Hybrid materials - Year-over-year growth 2025-2030 (%)

9.7 Market opportunity by Material

Market opportunity by Material ($ million)
Data Table on Market opportunity by Material ($ million)

10. Market Segmentation by Age Group

10.1 Market segments

Chart on Age Group - Market share 2025-2030 (%)
Data Table on Age Group - Market share 2025-2030 (%)

10.2 Comparison by Age Group

Chart on Comparison by Age Group
Data Table on Comparison by Age Group

10.3 Adults - Market size and forecast 2025-2030

Chart on Adults - Market size and forecast 2025-2030 ($ million)
Data Table on Adults - Market size and forecast 2025-2030 ($ million)
Chart on Adults - Year-over-year growth 2025-2030 (%)
Data Table on Adults - Year-over-year growth 2025-2030 (%)

10.4 Teenagers - Market size and forecast 2025-2030

Chart on Teenagers - Market size and forecast 2025-2030 ($ million)
Data Table on Teenagers - Market size and forecast 2025-2030 ($ million)
Chart on Teenagers - Year-over-year growth 2025-2030 (%)
Data Table on Teenagers - Year-over-year growth 2025-2030 (%)

10.5 Children - Market size and forecast 2025-2030

Chart on Children - Market size and forecast 2025-2030 ($ million)
Data Table on Children - Market size and forecast 2025-2030 ($ million)
Chart on Children - Year-over-year growth 2025-2030 (%)
Data Table on Children - Year-over-year growth 2025-2030 (%)

10.6 Market opportunity by Age Group

Market opportunity by Age Group ($ million)
Data Table on Market opportunity by Age Group ($ million)

11. Customer Landscape

11.1 Customer landscape overview

Analysis of price sensitivity, lifecycle, customer purchase basket, adoption rates, and purchase criteria

12. Geographic Landscape

12.1 Geographic segmentation

Chart on Market share by geography 2025-2030 (%)
Data Table on Market share by geography 2025-2030 (%)

12.2 Geographic comparison

Chart on Geographic comparison
Data Table on Geographic comparison

12.3 North America - Market size and forecast 2025-2030

Chart on North America - Market size and forecast 2025-2030 ($ million)
Data Table on North America - Market size and forecast 2025-2030 ($ million)
Chart on North America - Year-over-year growth 2025-2030 (%)
Data Table on North America - Year-over-year growth 2025-2030 (%)
Chart on Regional Comparison - North America
Data Table on Regional Comparison - North America

12.3.1 US - Market size and forecast 2025-2030

Chart on US - Market size and forecast 2025-2030 ($ million)
Data Table on US - Market size and forecast 2025-2030 ($ million)
Chart on US - Year-over-year growth 2025-2030 (%)
Data Table on US - Year-over-year growth 2025-2030 (%)

12.3.2 Canada - Market size and forecast 2025-2030

Chart on Canada - Market size and forecast 2025-2030 ($ million)
Data Table on Canada - Market size and forecast 2025-2030 ($ million)
Chart on Canada - Year-over-year growth 2025-2030 (%)
Data Table on Canada - Year-over-year growth 2025-2030 (%)

12.3.3 Mexico - Market size and forecast 2025-2030

Chart on Mexico - Market size and forecast 2025-2030 ($ million)
Data Table on Mexico - Market size and forecast 2025-2030 ($ million)
Chart on Mexico - Year-over-year growth 2025-2030 (%)
Data Table on Mexico - Year-over-year growth 2025-2030 (%)

12.4 Europe - Market size and forecast 2025-2030

Chart on Europe - Market size and forecast 2025-2030 ($ million)
Data Table on Europe - Market size and forecast 2025-2030 ($ million)
Chart on Europe - Year-over-year growth 2025-2030 (%)
Data Table on Europe - Year-over-year growth 2025-2030 (%)
Chart on Regional Comparison - Europe
Data Table on Regional Comparison - Europe

12.4.1 Germany - Market size and forecast 2025-2030

Chart on Germany - Market size and forecast 2025-2030 ($ million)
Data Table on Germany - Market size and forecast 2025-2030 ($ million)
Chart on Germany - Year-over-year growth 2025-2030 (%)
Data Table on Germany - Year-over-year growth 2025-2030 (%)

12.4.2 UK - Market size and forecast 2025-2030

Chart on UK - Market size and forecast 2025-2030 ($ million)
Data Table on UK - Market size and forecast 2025-2030 ($ million)
Chart on UK - Year-over-year growth 2025-2030 (%)
Data Table on UK - Year-over-year growth 2025-2030 (%)

12.4.3 France - Market size and forecast 2025-2030

Chart on France - Market size and forecast 2025-2030 ($ million)
Data Table on France - Market size and forecast 2025-2030 ($ million)
Chart on France - Year-over-year growth 2025-2030 (%)
Data Table on France - Year-over-year growth 2025-2030 (%)

12.4.4 Italy - Market size and forecast 2025-2030

Chart on Italy - Market size and forecast 2025-2030 ($ million)
Data Table on Italy - Market size and forecast 2025-2030 ($ million)
Chart on Italy - Year-over-year growth 2025-2030 (%)
Data Table on Italy - Year-over-year growth 2025-2030 (%)

12.4.5 Spain - Market size and forecast 2025-2030

Chart on Spain - Market size and forecast 2025-2030 ($ million)
Data Table on Spain - Market size and forecast 2025-2030 ($ million)
Chart on Spain - Year-over-year growth 2025-2030 (%)
Data Table on Spain - Year-over-year growth 2025-2030 (%)

12.4.6 The Netherlands - Market size and forecast 2025-2030

Chart on The Netherlands - Market size and forecast 2025-2030 ($ million)
Data Table on The Netherlands - Market size and forecast 2025-2030 ($ million)
Chart on The Netherlands - Year-over-year growth 2025-2030 (%)
Data Table on The Netherlands - Year-over-year growth 2025-2030 (%)

12.5 Asia - Market size and forecast 2025-2030

Chart on Asia - Market size and forecast 2025-2030 ($ million)
Data Table on Asia - Market size and forecast 2025-2030 ($ million)
Chart on Asia - Year-over-year growth 2025-2030 (%)
Data Table on Asia - Year-over-year growth 2025-2030 (%)
Chart on Regional Comparison - Asia
Data Table on Regional Comparison - Asia

12.5.1 China - Market size and forecast 2025-2030

Chart on China - Market size and forecast 2025-2030 ($ million)
Data Table on China - Market size and forecast 2025-2030 ($ million)
Chart on China - Year-over-year growth 2025-2030 (%)
Data Table on China - Year-over-year growth 2025-2030 (%)

12.5.2 Japan - Market size and forecast 2025-2030

Chart on Japan - Market size and forecast 2025-2030 ($ million)
Data Table on Japan - Market size and forecast 2025-2030 ($ million)
Chart on Japan - Year-over-year growth 2025-2030 (%)
Data Table on Japan - Year-over-year growth 2025-2030 (%)

12.5.3 India - Market size and forecast 2025-2030

Chart on India - Market size and forecast 2025-2030 ($ million)
Data Table on India - Market size and forecast 2025-2030 ($ million)
Chart on India - Year-over-year growth 2025-2030 (%)
Data Table on India - Year-over-year growth 2025-2030 (%)

12.5.4 South Korea - Market size and forecast 2025-2030

Chart on South Korea - Market size and forecast 2025-2030 ($ million)
Data Table on South Korea - Market size and forecast 2025-2030 ($ million)
Chart on South Korea - Year-over-year growth 2025-2030 (%)
Data Table on South Korea - Year-over-year growth 2025-2030 (%)

12.5.5 Thailand - Market size and forecast 2025-2030

Chart on Thailand - Market size and forecast 2025-2030 ($ million)
Data Table on Thailand - Market size and forecast 2025-2030 ($ million)
Chart on Thailand - Year-over-year growth 2025-2030 (%)
Data Table on Thailand - Year-over-year growth 2025-2030 (%)

12.5.6 Indonesia - Market size and forecast 2025-2030

Chart on Indonesia - Market size and forecast 2025-2030 ($ million)
Data Table on Indonesia - Market size and forecast 2025-2030 ($ million)
Chart on Indonesia - Year-over-year growth 2025-2030 (%)
Data Table on Indonesia - Year-over-year growth 2025-2030 (%)

12.6 Rest of World (ROW) - Market size and forecast 2025-2030

Chart on Rest of World (ROW) - Market size and forecast 2025-2030 ($ million)
Data Table on Rest of World (ROW) - Market size and forecast 2025-2030 ($ million)
Chart on Rest of World (ROW) - Year-over-year growth 2025-2030 (%)
Data Table on Rest of World (ROW) - Year-over-year growth 2025-2030 (%)
Chart on Regional Comparison - Rest of World (ROW)
Data Table on Regional Comparison - Rest of World (ROW)

12.6.1 Brazil - Market size and forecast 2025-2030

Chart on Brazil - Market size and forecast 2025-2030 ($ million)
Data Table on Brazil - Market size and forecast 2025-2030 ($ million)
Chart on Brazil - Year-over-year growth 2025-2030 (%)
Data Table on Brazil - Year-over-year growth 2025-2030 (%)

12.6.2 Saudi Arabia - Market size and forecast 2025-2030

Chart on Saudi Arabia - Market size and forecast 2025-2030 ($ million)
Data Table on Saudi Arabia - Market size and forecast 2025-2030 ($ million)
Chart on Saudi Arabia - Year-over-year growth 2025-2030 (%)
Data Table on Saudi Arabia - Year-over-year growth 2025-2030 (%)

12.6.3 UAE - Market size and forecast 2025-2030

Chart on UAE - Market size and forecast 2025-2030 ($ million)
Data Table on UAE - Market size and forecast 2025-2030 ($ million)
Chart on UAE - Year-over-year growth 2025-2030 (%)
Data Table on UAE - Year-over-year growth 2025-2030 (%)

12.6.4 Turkey - Market size and forecast 2025-2030

Chart on Turkey - Market size and forecast 2025-2030 ($ million)
Data Table on Turkey - Market size and forecast 2025-2030 ($ million)
Chart on Turkey - Year-over-year growth 2025-2030 (%)
Data Table on Turkey - Year-over-year growth 2025-2030 (%)

12.6.5 Argentina - Market size and forecast 2025-2030

Chart on Argentina - Market size and forecast 2025-2030 ($ million)
Data Table on Argentina - Market size and forecast 2025-2030 ($ million)
Chart on Argentina - Year-over-year growth 2025-2030 (%)
Data Table on Argentina - Year-over-year growth 2025-2030 (%)

12.6.6 Colombia - Market size and forecast 2025-2030

Chart on Colombia - Market size and forecast 2025-2030 ($ million)
Data Table on Colombia - Market size and forecast 2025-2030 ($ million)
Chart on Colombia - Year-over-year growth 2025-2030 (%)
Data Table on Colombia - Year-over-year growth 2025-2030 (%)

12.6.7 South Africa - Market size and forecast 2025-2030

Chart on South Africa - Market size and forecast 2025-2030 ($ million)
Data Table on South Africa - Market size and forecast 2025-2030 ($ million)
Chart on South Africa - Year-over-year growth 2025-2030 (%)
Data Table on South Africa - Year-over-year growth 2025-2030 (%)

12.6.8 Israel - Market size and forecast 2025-2030

Chart on Israel - Market size and forecast 2025-2030 ($ million)
Data Table on Israel - Market size and forecast 2025-2030 ($ million)
Chart on Israel - Year-over-year growth 2025-2030 (%)
Data Table on Israel - Year-over-year growth 2025-2030 (%)

12.7 Market opportunity by geography

Market opportunity by geography ($ million)
Data Tables on Market opportunity by geography ($ million)

13. Drivers, Challenges, and Opportunity

13.1 Market drivers

Growing awareness of oral care
Technological advancements in cosmetic dentistry
Rising adoption of social media and online dating

13.2 Market challenges

High cost and poor insurance coverage of cosmetic dentistry
Stringent regulations for cosmetic dentistry equipment
Limited availability of skilled dentists

13.3 Impact of drivers and challenges

Impact of drivers and challenges in 2025 and 2030

13.4 Market opportunities

Rising demand for composite bonding in single sitting
Launch of new cosmetic dentistry products
Growth in number of dental support organizations

14. Competitive Landscape

14.1 Overview

14.2

Overview on criticality of inputs and factors of differentiation

14.3 Landscape disruption

Overview on factors of disruption

14.4 Industry risks

Impact of key risks on business

15. Competitive Analysis

15.1 Companies profiled

Companies covered

15.2 Company ranking index

15.3 Market positioning of companies

Matrix on companies position and classification

15.4 3M Co.

3M Co. - Overview
3M Co. - Business segments
3M Co. - Key news
3M Co. - Key offerings
3M Co. - Segment focus
SWOT

15.5 Align Technology Inc.

Align Technology Inc. - Overview
Align Technology Inc. - Business segments
Align Technology Inc. - Key offerings
Align Technology Inc. - Segment focus
SWOT

15.6 Carestream Dental LLC

Carestream Dental LLC - Overview
Carestream Dental LLC - Product / Service
Carestream Dental LLC - Key offerings
SWOT

15.7 Coltene Whaledent AG

Coltene Whaledent AG - Overview
Coltene Whaledent AG - Product / Service
Coltene Whaledent AG - Key offerings
SWOT

15.8 Dentsply Sirona Inc.

Dentsply Sirona Inc. - Overview
Dentsply Sirona Inc. - Business segments
Dentsply Sirona Inc. - Key offerings
Dentsply Sirona Inc. - Segment focus
SWOT

15.9 Envista Holdings Corp.

Envista Holdings Corp. - Overview
Envista Holdings Corp. - Business segments
Envista Holdings Corp. - Key offerings
Envista Holdings Corp. - Segment focus
SWOT

15.10 GC Corp.

GC Corp. - Overview
GC Corp. - Product / Service
GC Corp. - Key offerings
SWOT

15.11 Glidewell

Glidewell - Overview
Glidewell - Product / Service
Glidewell - Key offerings
SWOT

15.12 Henry Schein Inc.

Henry Schein Inc. - Overview
Henry Schein Inc. - Business segments
Henry Schein Inc. - Key news
Henry Schein Inc. - Key offerings
Henry Schein Inc. - Segment focus
SWOT

15.13 Institut Straumann AG

Institut Straumann AG - Overview
Institut Straumann AG - Product / Service
Institut Straumann AG - Key offerings
SWOT

15.14 Ivoclar Vivadent AG

Ivoclar Vivadent AG - Overview
Ivoclar Vivadent AG - Product / Service
Ivoclar Vivadent AG - Key offerings
SWOT

15.15 Kuraray Noritake Dental Inc.

Kuraray Noritake Dental Inc. - Overview
Kuraray Noritake Dental Inc. - Product / Service
Kuraray Noritake Dental Inc. - Key offerings
SWOT

15.16 Planmeca Oy

Planmeca Oy - Overview
Planmeca Oy - Product / Service
Planmeca Oy - Key offerings
SWOT

15.17 SDI Ltd.

SDI Ltd. - Overview
SDI Ltd. - Product / Service
SDI Ltd. - Key offerings
SWOT

15.18 Septodont Holding

Septodont Holding - Overview
Septodont Holding - Product / Service
Septodont Holding - Key offerings
SWOT

16. Appendix

16.1 Scope of the report

Market definition
Objectives
Notes and caveats

16.2 Inclusions and exclusions checklist

Inclusions checklist
Exclusions checklist

16.3 Currency conversion rates for US$

16.4 Research methodology

16.5 Data procurement

Information sources

16.6 Data validation

16.7 Validation techniques employed for market sizing

16.8 Data synthesis

16.9 360 degree market analysis

16.10 List of abbreviations

Research Methodology

Technavio presents a detailed picture of the market by way of study, synthesis, and summation of data from multiple sources. The analysts have presented the various facets of the market with a particular focus on identifying the key industry influencers. The data thus presented is comprehensive, reliable, and the result of extensive research, both primary and secondary.

INFORMATION SOURCES

Primary sources

  • Manufacturers and suppliers
  • Channel partners
  • Industry experts
  • Strategic decision makers

Secondary sources

  • Industry journals and periodicals
  • Government data
  • Financial reports of key industry players
  • Historical data
  • Press releases

DATA ANALYSIS

Data Synthesis

  • Collation of data
  • Estimation of key figures
  • Analysis of derived insights

Data Validation

  • Triangulation with data models
  • Reference against proprietary databases
  • Corroboration with industry experts

REPORT WRITING

Qualitative

  • Market drivers
  • Market challenges
  • Market trends
  • Five forces analysis

Quantitative

  • Market size and forecast
  • Market segmentation
  • Geographical insights
  • Competitive landscape

Interested in this report?

Get your sample now to see our research methodology and insights!

Download Now

Frequently Asked Questions

Cosmetic Dentistry market growth will increase by USD 35380.3 million during 2026-2030.

The Cosmetic Dentistry market is expected to grow at a CAGR of 15.8% during 2026-2030.

Cosmetic Dentistry market is segmented by Product (Dental implants and prosthetics, Orthodontics, Teeth whitening, Dental veneers, Others) Material (Ceramic, Composite resin, Metal, Hybrid materials) Age group (Adults, Teenagers, Children)

3M Co., Align Technology Inc., Carestream Dental LLC, Coltene Whaledent AG, Dentsply Sirona Inc., Envista Holdings Corp., GC Corp., Glidewell, Henry Schein Inc., Institut Straumann AG, Ivoclar Vivadent AG, Kuraray Noritake Dental Inc., Planmeca Oy, SDI Ltd., Septodont Holding, Shofu Inc., Tokuyama Dental Corp., Ultradent Products Inc., VOCO GmbH, Young Innovations Inc., ZimVie Inc. are a few of the key vendors in the Cosmetic Dentistry market.

North America will register the highest growth rate of 34.2% among the other regions. Therefore, the Cosmetic Dentistry market in North America is expected to garner significant business opportunities for the vendors during the forecast period.

US, Canada, Mexico, Germany, UK, France, Italy, Spain, The Netherlands, China, Japan, India, South Korea, Thailand, Indonesia, Brazil, Saudi Arabia, UAE, Turkey, Argentina, Colombia, South Africa, Israel

  • Growing awareness of oral care is the driving factor this market.

The Cosmetic Dentistry market vendors should focus on grabbing business opportunities from the Product segment as it accounted for the largest market share in the base year.
RIA - Research AI Assistant
Ask RIA
