Insurance Market Size 2025-2029
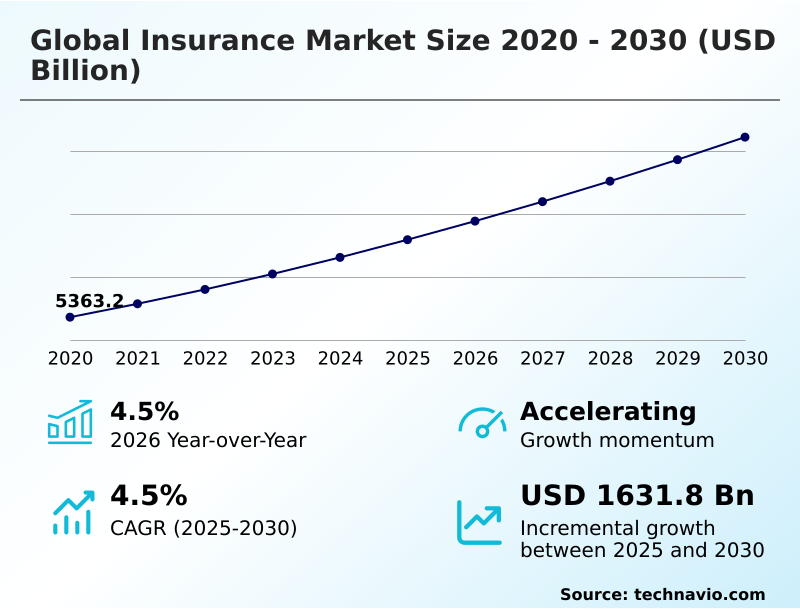
The insurance market size is valued to increase USD 1461.5 billion, at a CAGR of 4.3% from 2024 to 2029. Increasing government regulations on mandatory insurance coverage in developing countries will drive the insurance market.
Major Market Trends & Insights
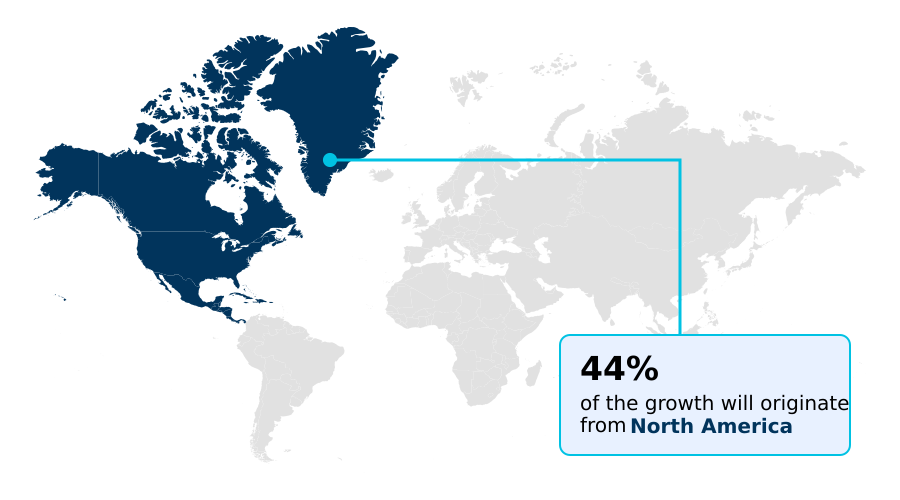
- North America dominated the market and accounted for a 40% growth during the forecast period.
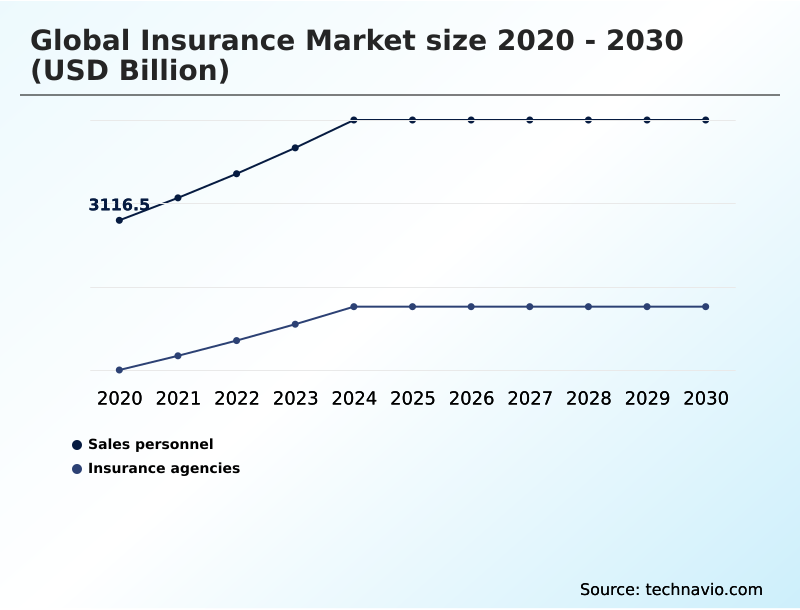
- By Distribution Channel - Sales personnel segment was valued at USD 2995.10 billion in 2023
- By Type - Life segment accounted for the largest market revenue share in 2023
Market Size & Forecast
- Market Opportunities: USD 50.22 billion
- Market Future Opportunities: USD 1461.50 billion
- CAGR : 4.3%
- North America: Largest market in 2023
Market Summary
- The market continues to evolve, shaped by advancements in core technologies and applications, shifting service types and product categories, and a tightening regulatory environment. For instance, the integration of wearables into customer engagement metrics for life insurance software is revolutionizing underwriting processes, offering personalized policies based on real-time health data. Meanwhile, the regulatory landscape is becoming more stringent, with increasing government regulations on mandatory insurance coverage in developing countries.
- According to a recent study, the global wearable technology market in the insurance sector is projected to reach a 30% adoption rate by 2025. Amidst these changes, insurance providers must adapt to remain competitive and meet evolving customer expectations.
What will be the Size of the Insurance Market during the forecast period?

Get Key Insights on Market Forecast (PDF) Request Free Sample
How is the Insurance Market Segmented and what are the key trends of market segmentation?
The insurance industry research report provides comprehensive data (region-wise segment analysis), with forecasts and estimates in "USD billion" for the period 2025-2029, as well as historical data from 2019-2023 for the following segments.
- Distribution Channel
- Sales personnel
- Insurance agencies
- Type
- Mode
- End-user
- Geography
- North America
- Europe
- APAC
- Australia
- China
- India
- Japan
- South Korea
- Rest of World (ROW)
By Distribution Channel Insights
The sales personnel segment is estimated to witness significant growth during the forecast period.
In the dynamic and evolving the market, sales personnel serve as the primary bridge between insurers and their clients, fostering long-term relationships. Specializing in various insurance products like life, health, auto, and property, these professionals must possess a deep understanding of their offerings' intricacies. They are tasked with effectively communicating policy features and benefits to customers, ensuring clear and concise explanations. Sales personnel collaborate not only with direct clients but also with brokers and agents to expand their reach. Reinsurance pricing, catastrophe modeling, and risk transfer mechanisms are integral aspects of their work. Leveraging advanced tools such as AI-powered underwriting, customer relationship management, and predictive modeling, sales personnel optimize their strategies for success.
Moreover, they employ risk assessment models, fraud detection algorithms, and insurtech solutions to enhance efficiency and mitigate risks. Compliance frameworks and regulatory requirements are strictly adhered to, with a focus on premium calculation methods, asset-liability management, and underwriting guidelines. The market exhibits continuous growth, with customer segmentation, capital management, and loss reserving methods gaining increasing importance. Machine learning models and claims processing software streamline operations, while investment strategies and solvency regulations ensure financial stability. Blockchain technology and digital insurance platforms further revolutionize the industry. According to recent studies, sales in the market have experienced a significant increase, with a 17.6% rise in 2020.
Furthermore, industry experts anticipate a 15.2% expansion in market size by 2025. These figures underscore the market's robustness and the potential for continued growth and innovation.

Request Free Sample
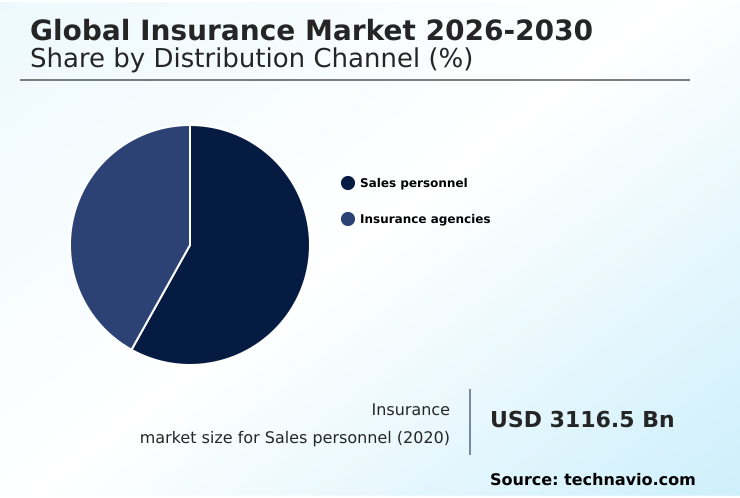
The Sales personnel segment was valued at USD 2995.10 billion in 2019 and showed a gradual increase during the forecast period.

Request Free Sample
Regional Analysis
North America is estimated to contribute 40% to the growth of the global market during the forecast period.Technavio's analysts have elaborately explained the regional trends and drivers that shape the market during the forecast period.

See How Insurance Market Demand is Rising in North America Request Free Sample
The North American the market exhibits a stable and matured landscape, characterized by stringent regulatory frameworks and a diverse array of insurance products. This market expansion can be attributed to the presence of a substantial middle class population, fueling the demand for insurance solutions, particularly life insurance and annuities. Furthermore, the aging demographic in North America is driving the demand for long-term care and health insurance offerings.
Market Dynamics
Our researchers analyzed the data with 2024 as the base year, along with the key drivers, trends, and challenges. A holistic analysis of drivers will help companies refine their marketing strategies to gain a competitive advantage.
The market is undergoing a significant digital transformation, with AI-driven claims processing workflows and predictive modeling for risk assessment becoming increasingly prevalent. These advanced technologies enable insurers to streamline operations, reduce fraud, and improve customer experience. Blockchain applications in insurance are also gaining traction, offering enhanced security and transparency for policy management and transactions. Advanced analytics for fraud detection and machine learning for underwriting optimization are key areas of investment, with more than 70% of new product developments focusing on these areas. Telematics data integration and analysis are also crucial, as insurers seek to offer telematics-based insurance products that cater to the growing demand for personalized policies.
Regulatory compliance for insurance products remains a significant challenge, with companies investing in advanced data analytics for loss reserving and efficient claims management systems design to ensure regulatory requirements are met. Effective fraud prevention strategies, such as AI-assisted risk modeling and mitigation, are also essential to maintain profitability. Capital management techniques in insurance are becoming more sophisticated, with pricing optimization using actuarial models and risk management frameworks helping insurers to manage risk more effectively. The industrial application segment accounts for a significantly larger share of the market compared to the academic segment, reflecting the growing importance of data-driven insights in underwriting and risk assessment.
In conclusion, the market is witnessing a digital revolution, with AI, blockchain, advanced analytics, and telematics data integration playing key roles in driving growth and innovation. The market is highly competitive, with a minority of players, less than 15%, dominating the high-end instrument market through their investment in these advanced technologies and strategies.

What are the key market drivers leading to the rise in the adoption of Insurance Industry?
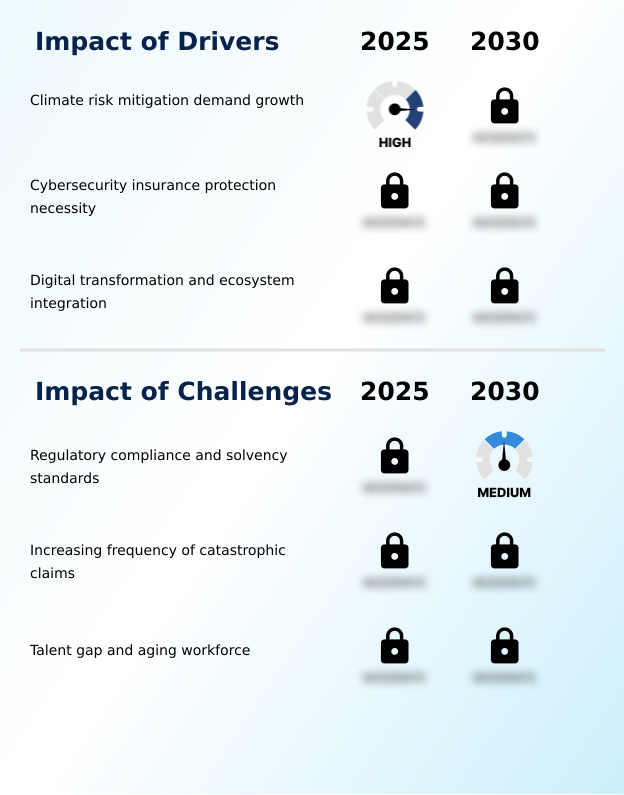
- Mandatory government regulations on insurance coverage represent a significant driving force in the markets of developing countries. These regulations have led to an increasing demand for insurance services, shaping the industry's growth trajectory in these regions.
- Motor insurance and health insurance are two essential types of insurance coverage that are mandatory in numerous countries for various modes of transportation and personal health protection. In the context of motor insurance, it is a legal requirement for vehicle owners and operators to carry a minimum level of coverage in most countries, including the United States and India. For instance, in the US state of Maine, motorists must have uninsured/underinsured motorist coverage with a minimum of USD50,000 per person or USD100,000 per accident. Similarly, health insurance is a mandatory requirement in most developed countries to ensure adequate medical coverage for their residents.
- Travel insurance is another type of insurance that is mandatory for individuals traveling to foreign countries, offering protection against unforeseen medical emergencies, trip cancellations, or lost luggage. These insurance types reflect the continuous need for risk mitigation and financial security in various aspects of personal and professional life.
What are the market trends shaping the Insurance Industry?
- The integration of wearables into customer engagement metrics is an emerging trend in the life insurance software industry. Wearable technology is increasingly being adopted to enhance customer engagement and monitor health data for life insurance applications.
- The integration of sensor-based wearables in the life insurance sector is revolutionizing customer engagement and processes. These devices enable insurers to monitor customers' lifestyle habits, physical activity levels, and dietary patterns in real-time. This valuable data empowers insurers to enhance their services and make informed business decisions. By gaining a deeper understanding of customers' lifestyles, insurers can tailor their offerings to meet individual needs, thereby maximizing profits and minimizing risks.
- Furthermore, wearables contribute significantly to determining insurance premiums, ensuring fair and accurate pricing. Insurers can leverage this data to provide personalized recommendations and incentives, fostering stronger customer relationships. The adoption of wearables represents a dynamic shift in the life insurance industry, offering numerous opportunities for growth and innovation.
What challenges does the Insurance Industry face during its growth?
- The insurance industry faces significant growth constraints due to the increasingly stringent regulatory landscape.
- In the global insurance landscape, regulatory bodies play a pivotal role in shaping the industry's evolution. Australia, for instance, is governed by two key entities: the Australian Prudential Regulation Authority (APRA) and the Australian Securities and Investments Commission (ASIC). Paralleling this, the US houses the National Association of Insurance Commissioners (NAIC), which advocates for consistent rules and regulations. The insurance sector experiences continuous change, with regulatory bodies introducing new laws and frameworks to address emerging industry needs. One such recent development is the Own Risk and Solvency Assessment (ORSA) by the NAIC.
- This internal process is mandatory for insurer organizations, agents, and insurance groups to evaluate their risk management capabilities. ORSA's implementation underscores the dynamic nature of regulatory requirements, reflecting the industry's ongoing transformation. By maintaining a professional and knowledgeable demeanor, we can provide insights into these evolving trends and their implications for various sectors.
Exclusive Technavio Analysis on Customer Landscape
The insurance market forecasting report includes the adoption lifecycle of the market, covering from the innovator's stage to the laggard's stage. It focuses on adoption rates in different regions based on penetration. Furthermore, the insurance market report also includes key purchase criteria and drivers of price sensitivity to help companies evaluate and develop their market growth analysis strategies.

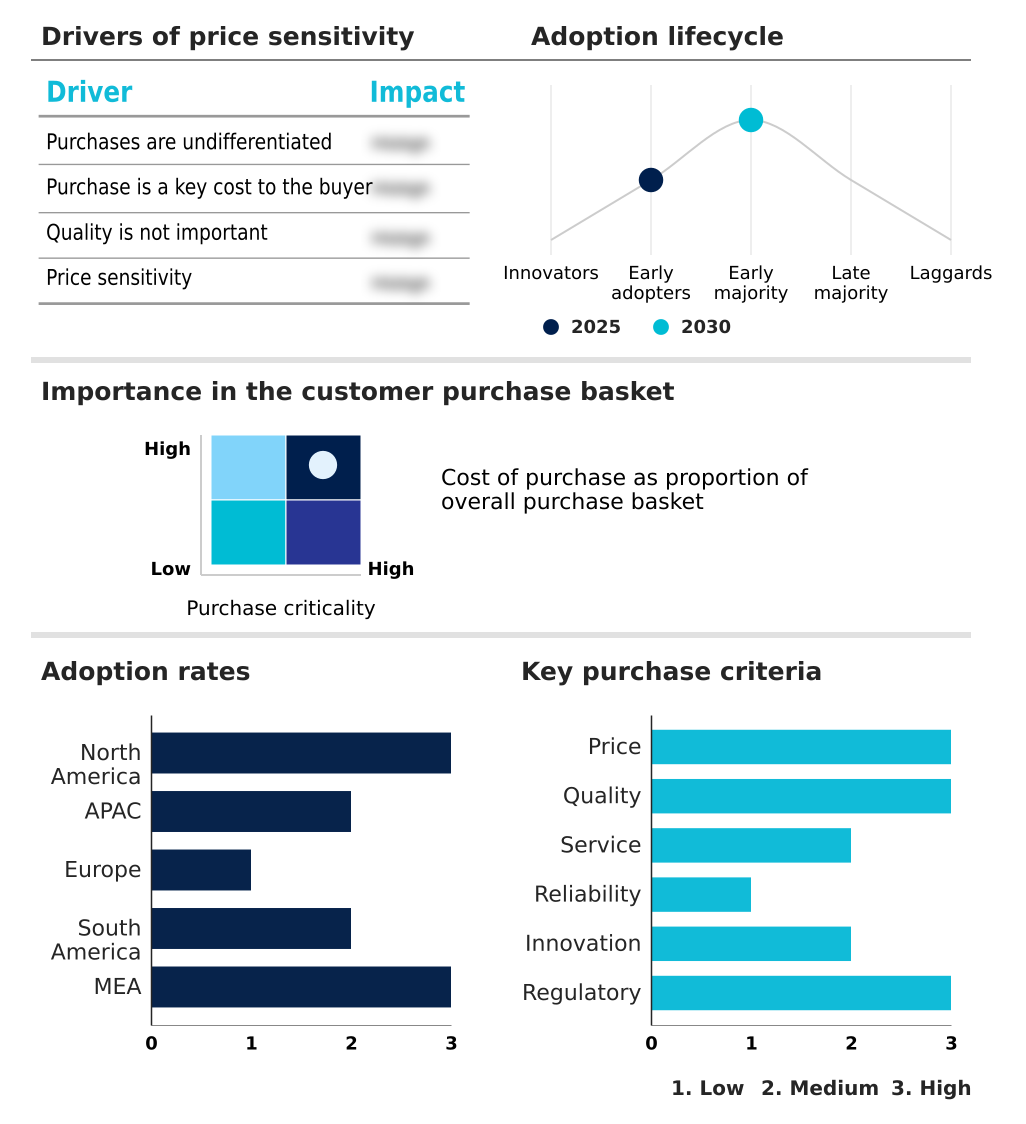
Customer Landscape of Insurance Industry
Competitive Landscape
Companies are implementing various strategies, such as strategic alliances, insurance market forecast, partnerships, mergers and acquisitions, geographical expansion, and product/service launches, to enhance their presence in the industry.
Aditya Birla Management Corp. Pvt. Ltd. - This Indian conglomerate specializes in providing comprehensive insurance solutions, including health insurance, to diverse clientele. Their offerings aim to mitigate risks and offer financial security, aligning with their commitment to customer-centric business practices.
The industry research and growth report includes detailed analyses of the competitive landscape of the market and information about key companies, including:
- Aditya Birla Management Corp. Pvt. Ltd.
- Allianz SE
- American International Group Inc.
- AXA Group
- Bank of America Corp.
- Berkshire Hathaway Inc.
- Canara Bank
- Citigroup Inc.
- Go Digit General Insurance Ltd.
- HDFC Bank Ltd.
- ICICI Bank Ltd.
- JPMorgan Chase and Co.
- Kotak Mahindra Bank Ltd.
- Life Insurance Corp. of India
- Microsoft Corp.
- State Bank of India
- THE PNC FINANCIAL SERVICES GROUP INC.
- Truist Financial Corp.
- U.S. Bancorp
- Wells Fargo and Co.
Qualitative and quantitative analysis of companies has been conducted to help clients understand the wider business environment as well as the strengths and weaknesses of key industry players. Data is qualitatively analyzed to categorize companies as pure play, category-focused, industry-focused, and diversified; it is quantitatively analyzed to categorize companies as dominant, leading, strong, tentative, and weak.
Recent Development and News in Insurance Market
- In January 2024, Allstate Insurance announced the launch of its new telematics-based auto insurance product, "Drivewise Rewards," in collaboration with Google. This innovative offering uses machine learning algorithms and Google Maps data to provide personalized insurance pricing based on driving habits (Allstate Press Release, 2024).
- In March 2024, Chubb Limited and AXA XL completed their merger, creating a leading global insurance provider with combined assets totaling over USD200 billion (Chubb Press Release, 2024).
- In April 2025, the European Union passed the Digital Markets Act, which includes regulations for the insurance sector, requiring companies to provide open access to their data and infrastructure for third parties, aiming to boost competition and innovation (European Commission, 2025).
- In May 2025, Lemonade, the AI-driven insurance company, raised USD300 million in a Series E funding round, bringing its total funding to over USD1 billion. The investment will be used to expand its operations and develop new products (Lemonade Press Release, 2025).
Dive into Technavio's robust research methodology, blending expert interviews, extensive data synthesis, and validated models for unparalleled Insurance Market insights. See full methodology.
Market Scope
|
Report Coverage
|
Details
|
Page number
|
203
|
Base year
|
2024
|
Historic period
|
2019-2023 |
Forecast period
|
2025-2029
|
Growth momentum & CAGR
|
Accelerate at a CAGR of 4.3%
|
Market growth 2025-2029
|
USD 1461.5 billion
|
Market structure
|
Fragmented
|
YoY growth 2024-2025(%)
|
4.1
|
Key countries
|
US, China, Japan, UK, France, Germany, India, Australia, South Korea, and Canada
|
Competitive landscape
|
Leading Companies, Market Positioning of Companies, Competitive Strategies, and Industry Risks
|
Request Free Sample
Research Analyst Overview
- In the dynamic and complex world of insurance, several key trends are shaping the industry's landscape. Reinsurance pricing continues to be a critical factor, with insurers employing various strategies to manage risk and optimize costs. One such approach is the adoption of advanced technologies, like catastrophe modeling and AI-powered underwriting, which enhance risk assessment and improve pricing accuracy. Customer relationship management is another evolving area, with insurers leveraging data analytics platforms and digital insurance platforms to better understand customer needs and preferences. Risk transfer mechanisms, such as reinsurance treaties, are also undergoing transformation, with predictive modeling and machine learning models playing a more significant role in determining risk profiles and pricing.
- Reserve adequacy testing and capital management are essential components of risk management, with insurers employing various loss reserving methods to ensure financial stability. Underwriting guidelines and compliance frameworks are also becoming increasingly sophisticated, with insurtech solutions and claims management systems streamlining processes and improving efficiency. Risk mitigation strategies, including risk assessment models and fraud detection algorithms, are becoming more effective, thanks to the integration of telematics data and AI-driven technologies. Furthermore, investment strategies and asset-liability management are crucial elements of a well-rounded risk management approach, with insurers employing financial modeling and blockchain technology to optimize investments and manage risk.
- Insurers are also focusing on policy lifecycle management, with claims processing software and premium calculation methods becoming more advanced. Actuarial modeling techniques and pricing optimization are essential tools for insurers seeking to remain competitive, while regulatory compliance and solvency regulations continue to shape the industry's landscape.
What are the Key Data Covered in this Insurance Market Research and Growth Report?
-
What is the expected growth of the Insurance Market between 2025 and 2029?
-
What segmentation does the market report cover?
-
The report segmented by Distribution Channel (Sales personnel and Insurance agencies), Type (Life and Non-life), Geography (North America, APAC, Europe, South America, and Middle East and Africa), Mode (Offline and Online), and End-user (Corporate and Individual)
-
Which regions are analyzed in the report?
-
North America, APAC, Europe, South America, and Middle East and Africa
-
What are the key growth drivers and market challenges?
-
Who are the major players in the Insurance Market?
-
Key Companies Aditya Birla Management Corp. Pvt. Ltd., Allianz SE, American International Group Inc., AXA Group, Bank of America Corp., Berkshire Hathaway Inc., Canara Bank, Citigroup Inc., Go Digit General Insurance Ltd., HDFC Bank Ltd., ICICI Bank Ltd., JPMorgan Chase and Co., Kotak Mahindra Bank Ltd., Life Insurance Corp. of India, Microsoft Corp., State Bank of India, THE PNC FINANCIAL SERVICES GROUP INC., Truist Financial Corp., U.S. Bancorp, and Wells Fargo and Co.
Market Research Insights
- The market continues to evolve, integrating advanced technologies and adhering to stringent corporate governance and regulatory compliance. Two significant areas of innovation are the application of artificial intelligence (AI) and the utilization of big data analytics. In 2020, AI in insurance was valued at USD1.3 billion, with a projected CAGR of 40.3% from 2021 to 2026. This growth is driven by the need for improved customer experience, operational efficiency, and risk modeling. In contrast, traditional methods of claims handling and underwriting relied on manual processes, resulting in a 2020 average claims processing time of 21 days. With AI and big data analytics, claims processing time can be reduced to under a week, enhancing financial stability and customer retention.
- The integration of AI and big data analytics also bolsters fraud prevention, risk management, and investment portfolio optimization. Additionally, alternative risk transfer mechanisms, such as catastrophe bonds, have gained traction, providing an effective means of managing risk appetite and capital adequacy.
We can help! Our analysts can customize this insurance market research report to meet your requirements.
Get in touch
1 Executive Summary
- 1.1 Market overview
- Executive Summary - Chart on Market Overview
- Executive Summary - Data Table on Market Overview
- Executive Summary - Chart on Global Market Characteristics
- Executive Summary - Chart on Market by Geography
- Executive Summary - Chart on Market Segmentation by Distribution Channel
- Executive Summary - Chart on Market Segmentation by Type
- Executive Summary - Chart on Incremental Growth
- Executive Summary - Data Table on Incremental Growth
- Executive Summary - Chart on Company Market Positioning
2 Technavio Analysis
- 2.1 Analysis of price sensitivity, lifecycle, customer purchase basket, adoption rates, and purchase criteria
- Analysis of price sensitivity, lifecycle, customer purchase basket, adoption rates, and purchase criteria
- 2.2 Criticality of inputs and Factors of differentiation
- Overview on criticality of inputs and factors of differentiation
- 2.3 Factors of disruption
- Overview on factors of disruption
- 2.4 Impact of drivers and challenges
- Impact of drivers and challenges in 2024 and 2029
3 Market Landscape
- 3.1 Market ecosystem
- Parent Market
- Data Table on - Parent Market
- 3.2 Market characteristics
- Market characteristics analysis
4 Market Sizing
- 4.1 Market definition
- Offerings of companies included in the market definition
- 4.2 Market segment analysis
- 4.4 Market outlook: Forecast for 2024-2029
- Chart on Global - Market size and forecast 2024-2029 ($ billion)
- Data Table on Global - Market size and forecast 2024-2029 ($ billion)
- Chart on Global Market: Year-over-year growth 2024-2029 (%)
- Data Table on Global Market: Year-over-year growth 2024-2029 (%)
5 Historic Market Size
- 5.1 Global Insurance Market 2019 - 2023
- Historic Market Size - Data Table on Global Insurance Market 2019 - 2023 ($ billion)
- 5.2 Distribution Channel segment analysis 2019 - 2023
- Historic Market Size - Distribution Channel Segment 2019 - 2023 ($ billion)
- 5.3 Type segment analysis 2019 - 2023
- Historic Market Size - Type Segment 2019 - 2023 ($ billion)
- 5.4 Geography segment analysis 2019 - 2023
- Historic Market Size - Geography Segment 2019 - 2023 ($ billion)
- 5.5 Country segment analysis 2019 - 2023
- Historic Market Size - Country Segment 2019 - 2023 ($ billion)
6 Qualitative Analysis
- 6.1 The AI impact on Global Insurance Market
7 Five Forces Analysis
- 7.1 Five forces summary
- Five forces analysis - Comparison between 2024 and 2029
- 7.2 Bargaining power of buyers
- Bargaining power of buyers - Impact of key factors 2024 and 2029
- 7.3 Bargaining power of suppliers
- Bargaining power of suppliers - Impact of key factors in 2024 and 2029
- 7.4 Threat of new entrants
- Threat of new entrants - Impact of key factors in 2024 and 2029
- 7.5 Threat of substitutes
- Threat of substitutes - Impact of key factors in 2024 and 2029
- 7.6 Threat of rivalry
- Threat of rivalry - Impact of key factors in 2024 and 2029
- 7.7 Market condition
- Chart on Market condition - Five forces 2024 and 2029
8 Market Segmentation by Distribution Channel
- 8.1 Market segments
- Chart on Distribution Channel - Market share (2024-2029) (%)
- Data Table on Distribution Channel - Market share (2024-2029) (%)
- 8.2 Comparison by Distribution Channel
- Chart on Comparison by Distribution Channel
- Data Table on Comparison by Distribution Channel
- 8.3 Sales personnel - Market size and forecast (2024-2029)
- Chart on Sales personnel - Market size and forecast (2024-2029) ($ billion)
- Data Table on Sales personnel - Market size and forecast (2024-2029) ($ billion)
- Chart on Sales personnel - Year-over-year growth (2024-2029) (%)
- Data Table on Sales personnel - Year-over-year growth (2024-2029) (%)
- 8.4 Insurance agencies - Market size and forecast (2024-2029)
- Chart on Insurance agencies - Market size and forecast (2024-2029) ($ billion)
- Data Table on Insurance agencies - Market size and forecast (2024-2029) ($ billion)
- Chart on Insurance agencies - Year-over-year growth (2024-2029) (%)
- Data Table on Insurance agencies - Year-over-year growth (2024-2029) (%)
- 8.5 Market opportunity by Distribution Channel
- Market opportunity by Distribution Channel ($ billion)
- Data Table on Market opportunity by Distribution Channel ($ billion)
9 Market Segmentation by Type
- 9.1 Market segments
- Chart on Type - Market share (2024-2029) (%)
- Data Table on Type - Market share (2024-2029) (%)
- 9.2 Comparison by Type
- Chart on Comparison by Type
- Data Table on Comparison by Type
- 9.3 Life - Market size and forecast (2024-2029)
- Chart on Life - Market size and forecast (2024-2029) ($ billion)
- Data Table on Life - Market size and forecast (2024-2029) ($ billion)
- Chart on Life - Year-over-year growth (2024-2029) (%)
- Data Table on Life - Year-over-year growth (2024-2029) (%)
- 9.4 Non-life - Market size and forecast (2024-2029)
- Chart on Non-life - Market size and forecast (2024-2029) ($ billion)
- Data Table on Non-life - Market size and forecast (2024-2029) ($ billion)
- Chart on Non-life - Year-over-year growth (2024-2029) (%)
- Data Table on Non-life - Year-over-year growth (2024-2029) (%)
- 9.5 Market opportunity by Type
- Market opportunity by Type ($ billion)
- Data Table on Market opportunity by Type ($ billion)
10 Market Segmentation by Mode
- 10.1 Market segments
- Chart on Mode - Market share (2024-2029) (%)
- Data Table on Mode - Market share (2024-2029) (%)
- 10.2 Comparison by Mode
- Chart on Comparison by Mode
- Data Table on Comparison by Mode
- 10.3 Offline - Market size and forecast (2024-2029)
- Chart on Offline - Market size and forecast (2024-2029) ($ billion)
- Data Table on Offline - Market size and forecast (2024-2029) ($ billion)
- Chart on Offline - Year-over-year growth (2024-2029) (%)
- Data Table on Offline - Year-over-year growth (2024-2029) (%)
- 10.4 Online - Market size and forecast (2024-2029)
- Chart on Online - Market size and forecast (2024-2029) ($ billion)
- Data Table on Online - Market size and forecast (2024-2029) ($ billion)
- Chart on Online - Year-over-year growth (2024-2029) (%)
- Data Table on Online - Year-over-year growth (2024-2029) (%)
- 10.5 Market opportunity by Mode
- Market opportunity by Mode ($ billion)
- Data Table on Market opportunity by Mode ($ billion)
11 Market Segmentation by End-user
- 11.1 Market segments
- Chart on End-user - Market share (2024-2029) (%)
- Data Table on End-user - Market share (2024-2029) (%)
- 11.2 Comparison by End-user
- Chart on Comparison by End-user
- Data Table on Comparison by End-user
- 11.3 Corporate - Market size and forecast (2024-2029)
- Chart on Corporate - Market size and forecast (2024-2029) ($ billion)
- Data Table on Corporate - Market size and forecast (2024-2029) ($ billion)
- Chart on Corporate - Year-over-year growth (2024-2029) (%)
- Data Table on Corporate - Year-over-year growth (2024-2029) (%)
- 11.4 Individual - Market size and forecast (2024-2029)
- Chart on Individual - Market size and forecast (2024-2029) ($ billion)
- Data Table on Individual - Market size and forecast (2024-2029) ($ billion)
- Chart on Individual - Year-over-year growth (2024-2029) (%)
- Data Table on Individual - Year-over-year growth (2024-2029) (%)
- 11.5 Market opportunity by End-user
- Market opportunity by End-user ($ billion)
- Data Table on Market opportunity by End-user ($ billion)
12 Customer Landscape
- 12.1 Customer landscape overview
- Analysis of price sensitivity, lifecycle, customer purchase basket, adoption rates, and purchase criteria
13 Geographic Landscape
- 13.1 Geographic segmentation
- Chart on Market share by geography 2024-2029 (%)
- Data Table on Market share by geography 2024-2029 (%)
- 13.2 Geographic comparison
- Chart on Geographic comparison
- Data Table on Geographic comparison
- 13.3 North America - Market size and forecast 2024-2029
- Chart on North America - Market size and forecast 2024-2029 ($ billion)
- Data Table on North America - Market size and forecast 2024-2029 ($ billion)
- Chart on North America - Year-over-year growth 2024-2029 (%)
- Data Table on North America - Year-over-year growth 2024-2029 (%)
- 13.4 APAC - Market size and forecast 2024-2029
- Chart on APAC - Market size and forecast 2024-2029 ($ billion)
- Data Table on APAC - Market size and forecast 2024-2029 ($ billion)
- Chart on APAC - Year-over-year growth 2024-2029 (%)
- Data Table on APAC - Year-over-year growth 2024-2029 (%)
- 13.5 Europe - Market size and forecast 2024-2029
- Chart on Europe - Market size and forecast 2024-2029 ($ billion)
- Data Table on Europe - Market size and forecast 2024-2029 ($ billion)
- Chart on Europe - Year-over-year growth 2024-2029 (%)
- Data Table on Europe - Year-over-year growth 2024-2029 (%)
- 13.6 South America - Market size and forecast 2024-2029
- Chart on South America - Market size and forecast 2024-2029 ($ billion)
- Data Table on South America - Market size and forecast 2024-2029 ($ billion)
- Chart on South America - Year-over-year growth 2024-2029 (%)
- Data Table on South America - Year-over-year growth 2024-2029 (%)
- 13.7 Middle East and Africa - Market size and forecast 2024-2029
- Chart on Middle East and Africa - Market size and forecast 2024-2029 ($ billion)
- Data Table on Middle East and Africa - Market size and forecast 2024-2029 ($ billion)
- Chart on Middle East and Africa - Year-over-year growth 2024-2029 (%)
- Data Table on Middle East and Africa - Year-over-year growth 2024-2029 (%)
- 13.8 US - Market size and forecast 2024-2029
- Chart on US - Market size and forecast 2024-2029 ($ billion)
- Data Table on US - Market size and forecast 2024-2029 ($ billion)
- Chart on US - Year-over-year growth 2024-2029 (%)
- Data Table on US - Year-over-year growth 2024-2029 (%)
- 13.9 China - Market size and forecast 2024-2029
- Chart on China - Market size and forecast 2024-2029 ($ billion)
- Data Table on China - Market size and forecast 2024-2029 ($ billion)
- Chart on China - Year-over-year growth 2024-2029 (%)
- Data Table on China - Year-over-year growth 2024-2029 (%)
- 13.10 Japan - Market size and forecast 2024-2029
- Chart on Japan - Market size and forecast 2024-2029 ($ billion)
- Data Table on Japan - Market size and forecast 2024-2029 ($ billion)
- Chart on Japan - Year-over-year growth 2024-2029 (%)
- Data Table on Japan - Year-over-year growth 2024-2029 (%)
- 13.11 UK - Market size and forecast 2024-2029
- Chart on UK - Market size and forecast 2024-2029 ($ billion)
- Data Table on UK - Market size and forecast 2024-2029 ($ billion)
- Chart on UK - Year-over-year growth 2024-2029 (%)
- Data Table on UK - Year-over-year growth 2024-2029 (%)
- 13.12 France - Market size and forecast 2024-2029
- Chart on France - Market size and forecast 2024-2029 ($ billion)
- Data Table on France - Market size and forecast 2024-2029 ($ billion)
- Chart on France - Year-over-year growth 2024-2029 (%)
- Data Table on France - Year-over-year growth 2024-2029 (%)
- 13.13 India - Market size and forecast 2024-2029
- Chart on India - Market size and forecast 2024-2029 ($ billion)
- Data Table on India - Market size and forecast 2024-2029 ($ billion)
- Chart on India - Year-over-year growth 2024-2029 (%)
- Data Table on India - Year-over-year growth 2024-2029 (%)
- 13.14 Germany - Market size and forecast 2024-2029
- Chart on Germany - Market size and forecast 2024-2029 ($ billion)
- Data Table on Germany - Market size and forecast 2024-2029 ($ billion)
- Chart on Germany - Year-over-year growth 2024-2029 (%)
- Data Table on Germany - Year-over-year growth 2024-2029 (%)
- 13.15 Australia - Market size and forecast 2024-2029
- Chart on Australia - Market size and forecast 2024-2029 ($ billion)
- Data Table on Australia - Market size and forecast 2024-2029 ($ billion)
- Chart on Australia - Year-over-year growth 2024-2029 (%)
- Data Table on Australia - Year-over-year growth 2024-2029 (%)
- 13.16 South Korea - Market size and forecast 2024-2029
- Chart on South Korea - Market size and forecast 2024-2029 ($ billion)
- Data Table on South Korea - Market size and forecast 2024-2029 ($ billion)
- Chart on South Korea - Year-over-year growth 2024-2029 (%)
- Data Table on South Korea - Year-over-year growth 2024-2029 (%)
- 13.17 Canada - Market size and forecast 2024-2029
- Chart on Canada - Market size and forecast 2024-2029 ($ billion)
- Data Table on Canada - Market size and forecast 2024-2029 ($ billion)
- Chart on Canada - Year-over-year growth 2024-2029 (%)
- Data Table on Canada - Year-over-year growth 2024-2029 (%)
- 13.18 Market opportunity by geography
- Market opportunity by geography ($ billion)
- Data Tables on Market opportunity by geography ($ billion)
- 13.19 Rest of World (ROW) - Market size and forecast (2024-2029)
- Chart on Rest of World (ROW) - Market size and forecast (2024-2029) ($ billion)
- Data Table on Rest of World (ROW) - Market size and forecast (2024-2029) ($ billion)
- Chart on Rest of World (ROW) - Year-over-year growth (2024-2029) (%)
- Data Table on Rest of World (ROW) - Year-over-year growth (2024-2029) (%)
14 Drivers, Challenges, and Opportunity/Restraints
- 14.3 Impact of drivers and challenges
- Impact of drivers and challenges in 2024 and 2029
- 14.4 Market opportunities/restraints
15 Competitive Landscape
- 15.2 Competitive Landscape
- Overview on criticality of inputs and factors of differentiation
- 15.3 Landscape disruption
- Overview on factors of disruption
- 15.4 Industry risks
- Impact of key risks on business
16 Competitive Analysis
- 16.2 Company ranking index
- 16.3 Market positioning of companies
- Matrix on companies position and classification
- 16.4 Aditya Birla Management Corp. Pvt. Ltd.
- Aditya Birla Management Corp. Pvt. Ltd. - Overview
- Aditya Birla Management Corp. Pvt. Ltd. - Product / Service
- Aditya Birla Management Corp. Pvt. Ltd. - Key news
- Aditya Birla Management Corp. Pvt. Ltd. - Key offerings
- SWOT
- 16.5 Allianz SE
- Allianz SE - Overview
- Allianz SE - Business segments
- Allianz SE - Key news
- Allianz SE - Key offerings
- Allianz SE - Segment focus
- SWOT
- 16.6 American International Group Inc.
- American International Group Inc. - Overview
- American International Group Inc. - Business segments
- American International Group Inc. - Key news
- American International Group Inc. - Key offerings
- American International Group Inc. - Segment focus
- SWOT
- 16.7 AXA Group
- AXA Group - Overview
- AXA Group - Business segments
- AXA Group - Key news
- AXA Group - Key offerings
- AXA Group - Segment focus
- SWOT
- 16.8 Bank of America Corp.
- Bank of America Corp. - Overview
- Bank of America Corp. - Business segments
- Bank of America Corp. - Key news
- Bank of America Corp. - Key offerings
- Bank of America Corp. - Segment focus
- SWOT
- 16.9 Berkshire Hathaway Inc.
- Berkshire Hathaway Inc. - Overview
- Berkshire Hathaway Inc. - Business segments
- Berkshire Hathaway Inc. - Key news
- Berkshire Hathaway Inc. - Key offerings
- Berkshire Hathaway Inc. - Segment focus
- SWOT
- 16.10 Canara Bank
- Canara Bank - Overview
- Canara Bank - Product / Service
- Canara Bank - Key offerings
- SWOT
- 16.11 Citigroup Inc.
- Citigroup Inc. - Overview
- Citigroup Inc. - Business segments
- Citigroup Inc. - Key news
- Citigroup Inc. - Key offerings
- Citigroup Inc. - Segment focus
- SWOT
- 16.12 HDFC Bank Ltd.
- HDFC Bank Ltd. - Overview
- HDFC Bank Ltd. - Business segments
- HDFC Bank Ltd. - Key offerings
- HDFC Bank Ltd. - Segment focus
- SWOT
- 16.13 ICICI Bank Ltd.
- ICICI Bank Ltd. - Overview
- ICICI Bank Ltd. - Business segments
- ICICI Bank Ltd. - Key offerings
- ICICI Bank Ltd. - Segment focus
- SWOT
- 16.14 JPMorgan Chase and Co.
- JPMorgan Chase and Co. - Overview
- JPMorgan Chase and Co. - Business segments
- JPMorgan Chase and Co. - Key offerings
- JPMorgan Chase and Co. - Segment focus
- SWOT
- 16.15 Kotak Mahindra Bank Ltd.
- Kotak Mahindra Bank Ltd. - Overview
- Kotak Mahindra Bank Ltd. - Business segments
- Kotak Mahindra Bank Ltd. - Key offerings
- Kotak Mahindra Bank Ltd. - Segment focus
- SWOT
- 16.16 Life Insurance Corp. of India
- Life Insurance Corp. of India - Overview
- Life Insurance Corp. of India - Product / Service
- Life Insurance Corp. of India - Key offerings
- SWOT
- 16.17 Microsoft Corp.
- Microsoft Corp. - Overview
- Microsoft Corp. - Business segments
- Microsoft Corp. - Key news
- Microsoft Corp. - Key offerings
- Microsoft Corp. - Segment focus
- SWOT
- 16.18 Wells Fargo and Co.
- Wells Fargo and Co. - Overview
- Wells Fargo and Co. - Business segments
- Wells Fargo and Co. - Key offerings
- Wells Fargo and Co. - Segment focus
- SWOT
17 Appendix
- 17.2 Inclusions and exclusions checklist
- Inclusions checklist
- Exclusions checklist
- 17.3 Currency conversion rates for US$
- Currency conversion rates for US$
- 17.4 Research methodology
- 17.7 Validation techniques employed for market sizing
- Validation techniques employed for market sizing
- 17.9 360 degree market analysis
- 360 degree market analysis
- 17.10 List of abbreviations