South Africa Endoscopy Devices Market Size 2024-2028
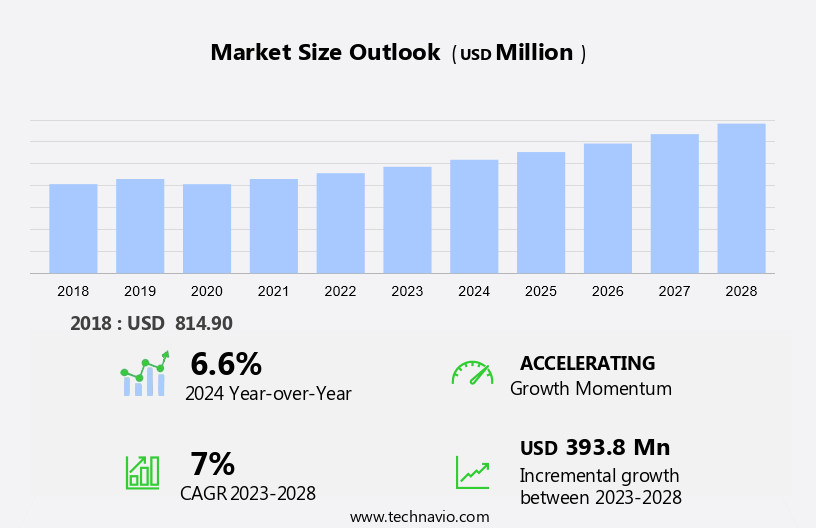
The South Africa endoscopy devices market size is forecast to increase by USD 393.8 million, at a CAGR of 7% between 2023 and 2028.
- The market is driven by the increasing prevalence of chronic diseases and technological advancements. Chronic diseases such as gastrointestinal disorders, liver diseases, and cancer continue to rise, fueling the demand for endoscopic procedures. These conditions often require regular monitoring and diagnostic procedures, making endoscopy devices an essential tool for healthcare providers. Technological advancements in endoscopy devices contribute significantly to market growth. Innovations like single-use endoscopes, wireless capsule endoscopes, and 3D imaging systems offer enhanced diagnostic capabilities and improved patient comfort. However, the market faces challenges, including the lack of skilled surgeons and high costs associated with advanced endoscopic procedures.
- These challenges necessitate strategic partnerships between device manufacturers and healthcare providers to address the skills gap and make advanced endoscopic procedures more accessible and affordable. Companies seeking to capitalize on market opportunities should focus on developing cost-effective solutions while maintaining high-quality standards. Additionally, collaborating with healthcare providers to offer training programs and invest in research and development can help overcome the challenges and solidify the market position.
What will be the size of the South Africa Endoscopy Devices Market during the forecast period?
Explore in-depth regional segment analysis with market size data - historical 2018-2022 and forecasts 2024-2028 - in the full report.
Request Free Sample
- In the South African endoscopy market, clinical applications continue to expand, driving the demand for advanced endoscopy devices. Compatibility and reliability are crucial factors in endoscopy device selection, as performance during procedures such as endoscopic polypectomy and mucosal resection significantly impacts patient outcomes. Usability, image analysis, and patient comfort are also key considerations, with procedural efficiency and cost effectiveness becoming increasingly important. Endoscopy device certification, validation, and quality assurance are essential for ensuring safety and infection prevention. Equipment upgrades, system integration, and calibration are necessary for maintaining optimal performance and data security. Advanced imaging endoscopy and therapeutic devices offer new possibilities for diagnosing and treating conditions.
- Endoscopy workflow optimization and procedural documentation streamline processes and improve efficiency. Cost effectiveness, cleaning, innovation, durability, and lifespan are all essential factors in the long-term investment strategy for endoscopy equipment. Safety remains a top priority, with ongoing efforts to minimize risks and enhance infection prevention measures.
How is this market segmented?
The market research report provides comprehensive data (region-wise segment analysis), with forecasts and estimates in "USD million" for the period 2024-2028, as well as historical data from 2018-2022 for the following segments.
- Product
- Endoscope
- Mechanical endoscopic equipment
- Visualization and documentation systems
- Accessories
- Others
- End-user
- Hospitals
- Ambulatory surgery centers and clinics
- Others
- Geography
- Middle East and Africa
- South Africa
- Middle East and Africa
By Product Insights
The endoscope segment is estimated to witness significant growth during the forecast period.
Endoscopes, minimally invasive diagnostic and surgical tools, utilize thin, lit tubes to explore internal organs through natural openings. Specializations include the cystoscope for the bladder, nephroscope for the kidney, bronchoscope for the bronchus, arthroscope for joints, colonoscope for the colon, and laparoscope for the abdomen. Advanced endoscopy techniques, such as high-definition imaging, image-enhanced procedures, and chromoendoscopy, offer improved diagnostic accuracy. Endoscopic ultrasound systems provide real-time imaging for tissue characterization. Endoscopy data management, sterilization, and infection control are essential aspects. Surgical endoscopy devices, including endoscopic surgical instruments and endoscopic biopsy devices, facilitate minimally invasive surgeries. Remote endoscopy assistance, confocal laser endomicroscopy, and optical coherence tomography offer enhanced diagnostic capabilities.
Flexible endoscopy systems, ergonomically designed for user comfort, are essential. Training in advanced endoscopy techniques, procedural workflows, and equipment maintenance is crucial. Single-use endoscopy scopes and disposable endoscopy accessories reduce infection risk. Video endoscopy processing and endoscopy camera technology enable precise documentation and analysis. Endoscopy equipment maintenance and virtual endoscopy simulation ensure optimal performance. Minimally invasive endoscopy, including capsule endoscopy technology and wireless capsule endoscopy, offers non-invasive exploration of the gastrointestinal tract. Endoscopy device repair and flexible endoscope design ensure longevity and effectiveness. In conclusion, the endoscopy market is dynamic, driven by technological advancements and evolving patient needs.
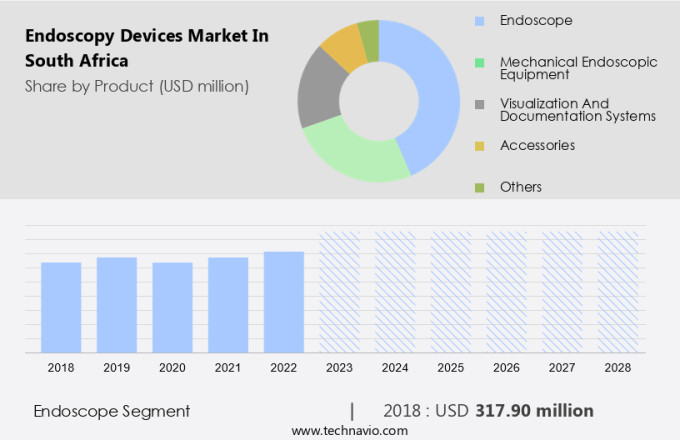
The Endoscope segment was valued at USD 317.90 million in 2018 and showed a gradual increase during the forecast period.
Market Dynamics
Our researchers analyzed the data with 2023 as the base year, along with the key drivers, trends, and challenges. A holistic analysis of drivers will help companies refine their marketing strategies to gain a competitive advantage.
What are the South Africa Endoscopy Devices Market drivers leading to the rise in adoption of the Industry?
- The primary catalyst fueling market growth is the continuous advancement of technology.
- Endoscopy devices have experienced significant advancements in technology, leading to innovative visualization techniques that benefit both companies and healthcare providers. These developments address healthcare challenges such as cost containment, early diagnosis, and affordable services. Among the emerging technologies are natural orifice transluminal endoscopic surgery (NOTES), endoscopic mucosal resection (EMR), and endoscopic ultrasonography (EUS). NOTES is an evolving field in interventional gastroenterology and GI surgery, enabling physicians to access the peritoneal cavity through a hollow viscus for diagnostic procedures. This approach is gaining popularity due to its potential for fewer complications.
- EMR and EUS offer enhanced diagnostic capabilities, contributing to earlier and more accurate diagnoses. These advancements represent a harmonious balance between innovation and developmental stages, offering opportunities for companies and healthcare providers to address healthcare needs in a professional and effective manner.
What are the South Africa Endoscopy Devices Market trends shaping the Industry?
- Chronic diseases are on the rise, making it a significant market trend for the health care industry. The increasing prevalence of chronic conditions represents a growing demand for innovative solutions and advanced treatments.
- The endoscopy devices market in Africa is experiencing significant growth due to the increasing patient population with chronic disorders, particularly gastrointestinal (GI) diseases. The prevalence of conditions such as colorectal, esophageal, pancreatic cancers, biliary diseases, inflammatory bowel disease, and gastroesophageal reflux disease (GERD) is driving market expansion. Unhealthy lifestyle choices, including poor diet and physical inactivity, have led to a rise in complications like high blood pressure, blood glucose, lipids, and obesity, contributing to the increasing morbidity and mortality from chronic diseases such as esophageal cancer, colon cancer, rectal cancer, and critical GI disorders.
- Moreover, advanced endoscopy features, endoscopy data management, endoscopy device sterilization, surgical endoscopy devices, high-definition endoscopy, endoscopy accessory components, and capsule endoscopy technology are enhancing the diagnostic capabilities and effectiveness of endoscopic procedures. These developments are expected to further fuel market growth.
How does South Africa Endoscopy Devices Market face challenges during its growth?
- The scarcity of proficient surgeons poses a significant challenge to the expansion and growth of the industry.
- Endoscopy procedures are essential for diagnosing and treating various gastrointestinal disorders, including endoscopic retrograde cholangiopancreatography (ERCP) and image-enhanced endoscopy. However, these procedures demand highly skilled professionals due to the restricted operating area vision, the need for hand-eye coordination, and the complexity in handling various devices and instruments. The use of advanced endoscopy devices, such as chromoendoscopy techniques, endoscopy device ergonomics, endoscopic ultrasound systems, remote endoscopy assistance, and confocal laser endomicroscopy, can enhance procedural outcomes. Proper training is crucial to operate and understand the functioning of a flexible endoscope and navigate through anatomy to identify the target site.
- Despite the technological advancements, the availability of skilled healthcare professionals remains a challenge. The integration of these advanced technologies can improve diagnostic accuracy, reduce complications, and streamline endoscopy procedural workflows.
Exclusive South Africa Endoscopy Devices Market Customer Landscape
The market forecasting report includes the adoption lifecycle of the market, covering from the innovator's stage to the laggard's stage. It focuses on adoption rates in different regions based on penetration. Furthermore, the report also includes key purchase criteria and drivers of price sensitivity to help companies evaluate and develop their market growth analysis strategies.
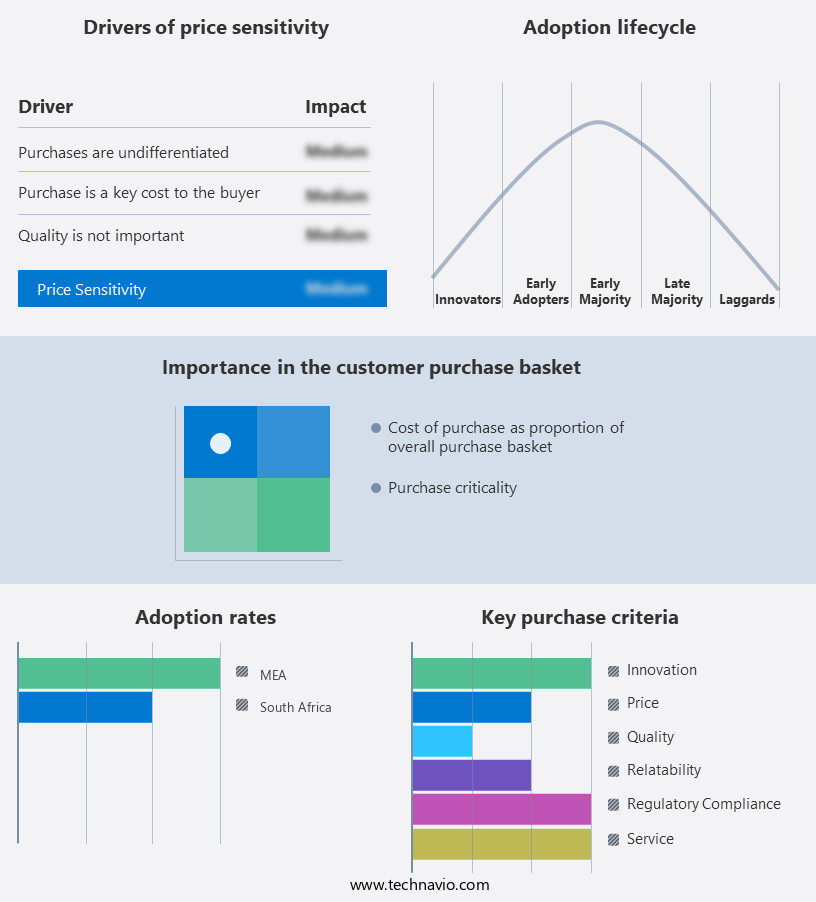
Customer Landscape
Key Companies & Market Insights
Companies are implementing various strategies, such as strategic alliances, market forecast partnerships, mergers and acquisitions, geographical expansion, and product/service launches, to enhance their presence in the market.
The market research and growth report includes detailed analyses of the competitive landscape of the market and information about key companies, including:
- Boston Scientific Corp.
- Cook Group Inc.
- FUJIFILM Holdings Corp.
- HOYA Corp.
- Johnson and Johnson Inc.
- KARL STORZ SE and Co. KG
- Medtronic Plc
- Olympus Corp.
- Richard Wolf GmbH
- Smith and Nephew plc
- Stryker Corp.
Qualitative and quantitative analysis of companies has been conducted to help clients understand the wider business environment as well as the strengths and weaknesses of key market players. Data is qualitatively analyzed to categorize companies as pure play, category-focused, industry-focused, and diversified; it is quantitatively analyzed to categorize companies as dominant, leading, strong, tentative, and weak.
Recent Development and News in Endoscopy Devices Market In South Africa
- In January 2024, Medtronic, a global healthcare solutions company, announced the launch of its new EndoSheath Duo endoscope, designed for single-use gastrointestinal procedures, in South Africa (Medtronic Press Release, 2024). This innovation aimed to address the growing demand for disposable endoscopy devices to minimize infection risks.
- In March 2024, Ethicon Endo-Surgery, a part of Johnson & Johnson, and Mediclinic, a leading private hospital group in South Africa, entered into a strategic partnership to offer advanced endoscopic procedures using Ethicon Endo-Surgery's devices (Mediclinic Press Release, 2024). This collaboration aimed to enhance Mediclinic's endoscopy capabilities and improve patient care.
- In May 2025, Stryker, a leading medical technology company, acquired South Africa's Medi-Tech Medical Systems, a significant player in the local endoscopy market, for approximately ZAR 1.3 billion (Stryker Press Release, 2025). This acquisition expanded Stryker's presence in Africa and strengthened its endoscopy product offerings.
- In the same month, the South African Health Products Regulatory Authority (SAHPRA) granted approval for the use of Olympus's new high-definition endoscopy system, the Evis Exera III, in the country (Olympus Press Release, 2025). This approval marked the first high-definition endoscopy system to be authorized in South Africa, paving the way for improved diagnostic accuracy and patient outcomes.
Research Analyst Overview
The market continues to evolve, driven by advancements in imaging techniques and the integration of sophisticated features. Endoscopic imaging techniques, such as image-enhanced endoscopy and chromoendoscopy, provide enhanced visualization for improved diagnostic accuracy. Advanced endoscopy features, including high-definition endoscopy and endoscopic ultrasound systems, offer superior image quality and diagnostic capabilities. Endoscopy data management, device sterilization, and infection control are crucial aspects of the market, ensuring the safe and efficient use of endoscopic equipment. Remote endoscopy assistance and virtual endoscopy simulation enable specialists to collaborate and consult on complex cases, expanding the reach of endoscopic procedures. Endoscopy procedural workflows are continually optimized to streamline processes and improve patient outcomes.
Flexible endoscopy systems, including capsule endoscopy technology and single-use scopes, offer increased accessibility and convenience for both patients and healthcare providers. Endoscopy accessory components, such as endoscopic surgical instruments and biopsy devices, expand the capabilities of endoscopic procedures. Video endoscopy processing and endoscopy equipment maintenance ensure the highest quality imaging and prolong the life of endoscopic devices. Ongoing advancements in endoscopy technology include wireless capsule endoscopy, disposable scopes, and advanced endoscopy training programs. Ergonomic design and endoscopy procedural training enhance the user experience and contribute to the overall success of the market. Confocal laser endomicroscopy and optical coherence tomography offer new possibilities for real-time, high-resolution imaging, while minimally invasive endoscopy and virtual endoscopy simulation expand the scope of endoscopic procedures.
The endoscopy market in South Africa remains dynamic, with ongoing innovation and advancements shaping its future.
Dive into Technavio's robust research methodology, blending expert interviews, extensive data synthesis, and validated models for unparalleled Endoscopy Devices Market in South Africa insights. See full methodology.
|
Market Scope |
|
|
Report Coverage |
Details |
|
Page number |
144 |
|
Base year |
2023 |
|
Historic period |
2018-2022 |
|
Forecast period |
2024-2028 |
|
Growth momentum & CAGR |
Accelerate at a CAGR of 7% |
|
Market growth 2024-2028 |
USD 393.8 million |
|
Market structure |
Concentrated |
|
YoY growth 2023-2024(%) |
6.6 |
|
Competitive landscape |
Leading Companies, Market Positioning of Companies, Competitive Strategies, and Industry Risks |
What are the Key Data Covered in this Market Research Report?
- CAGR of the market during the forecast period
- Detailed information on factors that will drive the market growth and forecasting between 2024 and 2028
- Precise estimation of the size of the market and its contribution of the market in focus to the parent market
- Accurate predictions about upcoming market growth and trends and changes in consumer behaviour
- Growth of the market across South Africa
- Thorough analysis of the market's competitive landscape and detailed information about companies
- Comprehensive analysis of factors that will challenge the growth of market companies
We can help! Our analysts can customize this market research report to meet your requirements Get in touch