Fast Casual Restaurants Market Analysis, Size, and Forecast 2026-2030: North America (US, Canada, and Mexico), APAC (China, Japan, and India), Europe (Germany, UK, and France), South America (Brazil and Argentina), Middle East and Africa (Saudi Arabia, UAE, and South Africa), and Rest of World (ROW)

Fast Casual Restaurants Market Analysis, Size, and Forecast 2026-2030:
North America (US, Canada, and Mexico), APAC (China, Japan, and India), Europe (Germany, UK, and France), South America (Brazil and Argentina), Middle East and Africa (Saudi Arabia, UAE, and South Africa), and Rest of World (ROW)

Published: Apr 2026 288 Pages SKU: IRTNTR41067

Market Overview at a Glance

$240.60 B
Market Opportunity
18%
CAGR 2025 - 2030
45.9%
North America Growth
$66.90 B
North American segment 2024

Fast Casual Restaurants Market Size 2026-2030

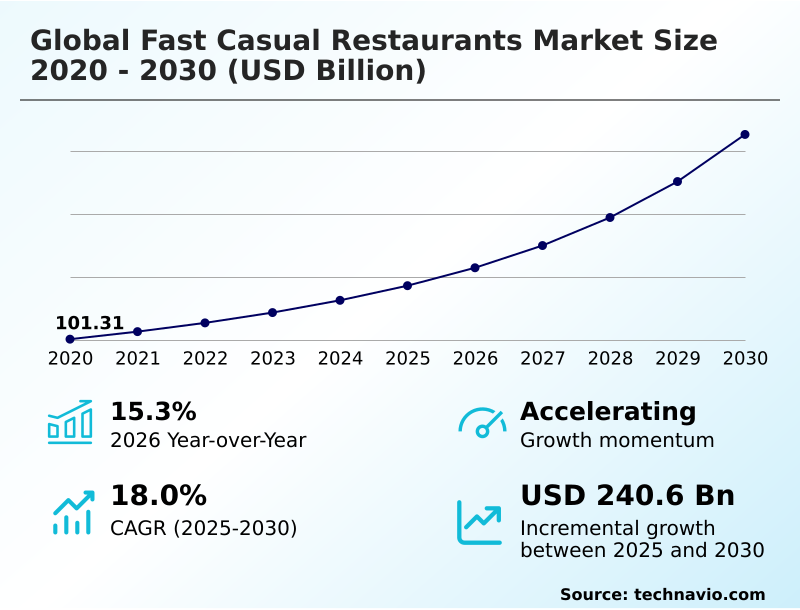
The fast casual restaurants market size is valued to increase by USD 240.60 billion, at a CAGR of 18% from 2025 to 2030. Demand for innovation and customization in food menus will drive the fast casual restaurants market.

Major Market Trends & Insights

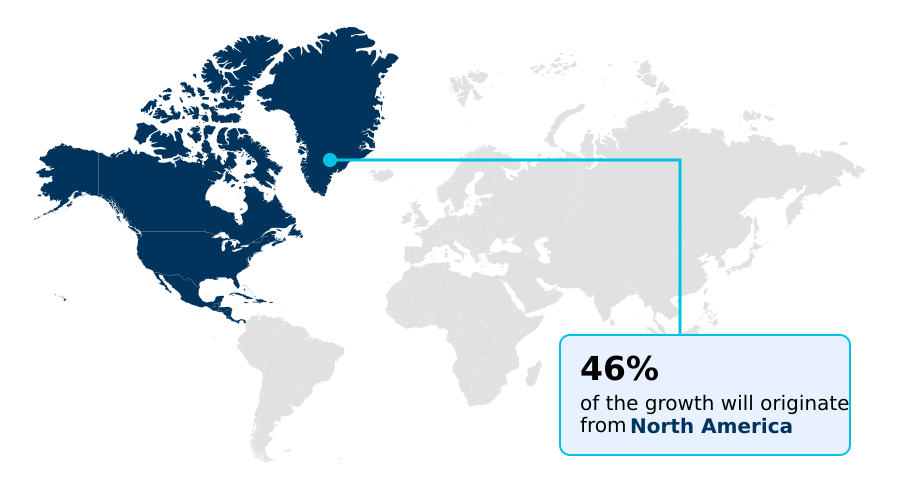
  • North America dominated the market and accounted for a 45.9% growth during the forecast period.
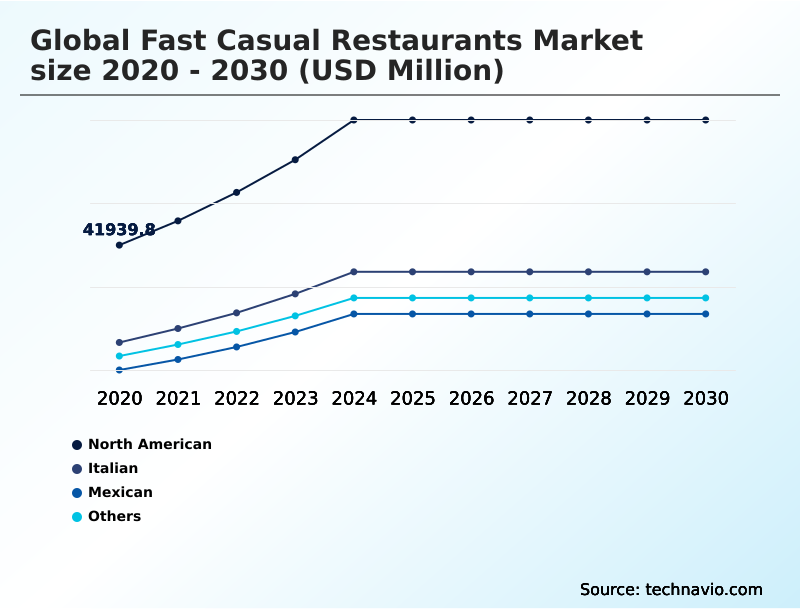
  • By Product - North American segment was valued at USD 66.90 billion in 2024
  • By Channel - Dine-in segment accounted for the largest market revenue share in 2024

Market Size & Forecast

  • Market Opportunities: USD 325.71 billion
  • Market Future Opportunities: USD 240.60 billion
  • CAGR from 2025 to 2030 : 18%

Market Summary

  • The Fast Casual Restaurants Market is characterized by a fundamental shift in consumer dining habits, moving toward a hybrid model that blends the convenience of quick-service with the quality of casual dining. This evolution is driven by demand for healthy fast casual meals, food transparency initiatives, and highly personalized options.
  • Core to this market are fast casual service models centered around made-to-order meal preparation and fully customizable menu options, allowing consumers to tailor meals to specific dietary and taste preferences. This focus on customization enhances the overall fast casual dining experience.
  • Premium fast casual brands are differentiating themselves through commitments to sustainable ingredient sourcing and the adoption of eco-friendly packaging solutions. Technology is a critical enabler, with digital ordering platforms and sophisticated customer relationship management (CRM) systems reshaping fast casual market dynamics.
  • For instance, operators are leveraging data analytics for supply chain optimization, matching inventory of fresh ingredients precisely with fluctuating local demand for convenient dining solutions. This reduces waste and ensures ingredient availability, directly impacting profitability and service consistency without compromising the freshness central to the fast casual promise.

What will be the Size of the Fast Casual Restaurants Market during the forecast period?

Get Key Insights on Market Forecast (PDF) Request Free Sample

How is the Fast Casual Restaurants Market Segmented?

The fast casual restaurants industry research report provides comprehensive data (region-wise segment analysis), with forecasts and estimates in "USD million" for the period 2026-2030, as well as historical data from 2020-2024 for the following segments.

  • Product
    • North American
    • Italian
    • Mexican
    • Others
  • Channel
    • Dine-in
    • Takeaway
  • Type
    • Franchised
    • Standalone
  • Geography
    • North America
      • US
      • Canada
      • Mexico
    • APAC
      • China
      • Japan
      • India
    • Europe
      • Germany
      • UK
      • France
    • South America
      • Brazil
      • Argentina
    • Middle East and Africa
      • Saudi Arabia
      • UAE
      • South Africa
    • Rest of World (ROW)

By Product Insights

The north american segment is estimated to witness significant growth during the forecast period.

The North American fast casual restaurants market is defined by a convergence of consumer demand for quality and convenience. The sector thrives by offering a superior alternative to traditional quick service, emphasizing high-quality, made-to-order meal preparation and customizable menu options.

Urban and suburban consumers increasingly prioritize food transparency initiatives, favoring brands that commit to sustainable ingredient sourcing and provide options like plant-based menu items. This demand for healthy fast casual meals aligns with a fast-paced lifestyle.

To enhance the fast casual dining experience, operators are investing in technology; digital ordering platforms and self-ordering kiosks have improved operational flows, with some platforms reducing order errors by over 15%.

This focus on premium ingredient positioning and convenient dining solutions, coupled with eco-friendly packaging solutions, defines the competitive landscape for urban dining trends.

Request Free Sample

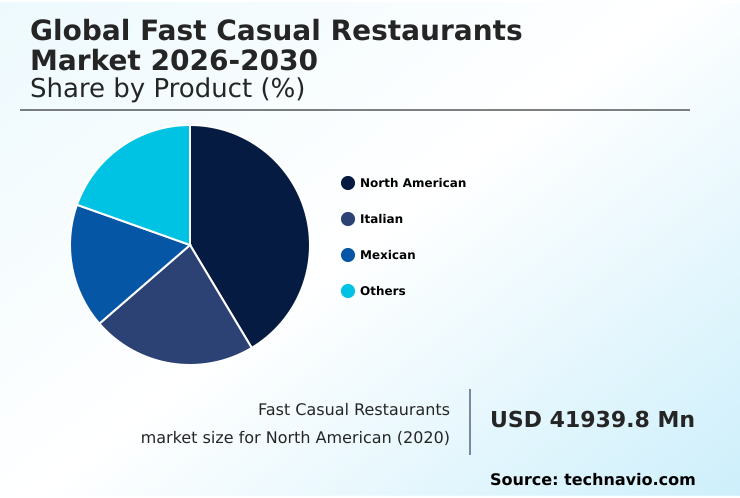
The North American segment was valued at USD 66.90 billion in 2024 and showed a gradual increase during the forecast period.

Request Free Sample

Regional Analysis

North America is estimated to contribute 45.9% to the growth of the global market during the forecast period.Technavio’s analysts have elaborately explained the regional trends and drivers that shape the market during the forecast period.

See How Fast Casual Restaurants Market Demand is Rising in North America Request Free Sample

North America is set to contribute approximately 45.9% of the market's incremental growth, driven by mature consumer preferences for gourmet fast casual options and advanced food delivery ecosystems.

The region's leadership is reinforced by widespread adoption of contactless dining solutions, with contactless payment systems and self-ordering kiosks becoming standard. Meanwhile, APAC is emerging as a key growth region, fueled by rapid urbanization and rising disposable incomes.

The popularity of urban dining trends and hyper-local dining trends is creating opportunities for concepts featuring globally inspired noodle dishes and Hawaiian-inspired poke bowls.

In this region, loyalty program integration via mobile apps has been shown to improve customer retention rates by over 20%. The expansion of third-party delivery aggregation supports the growth of takeaway and delivery models across both regions.

Market Dynamics

Our researchers analyzed the data with 2025 as the base year, along with the key drivers, trends, and challenges. A holistic analysis of drivers will help companies refine their marketing strategies to gain a competitive advantage.

  • The future of the Fast Casual Restaurants Market hinges on navigating several interconnected strategic imperatives. The impact of technology on fast casual dining is profound, with digital transformation in restaurant operations becoming a baseline for competitive survival. Companies are actively optimizing fast casual for delivery services and implementing self-ordering kiosks effectively to meet consumer expectations for convenience.
  • This technology push also involves leveraging data analytics for menu optimization and integrating AI for personalized menu recommendations, which directly addresses the consumer demand for food customization. A key trend is the rise of chef-driven fast casual franchises, which challenges operators to balance culinary creativity with the scalability of franchised vs. standalone fast casual models.
  • The importance of menu innovation and engineering is paramount, especially with the accelerated growth of healthy and gluten-free options and the increasing role of plant-based food in fast casual menus.
  • Operationally, success requires diligent fast casual restaurant supply chain management to buffer against the challenge of managing food commodity price fluctuations, which can impact margins more significantly than in less fresh-focused segments. For instance, brands with agile supply chains report 20% better margin stability during periods of price volatility.
  • Furthermore, navigating food safety and labeling regulations and developing robust strategies for customer loyalty and crm programs are critical for sustainable fast casual expansion in urban and suburban markets. Ultimately, the industry must continuously redefine the future of dine-in versus takeaway channels while addressing the persistent challenges of competing with quick-service restaurants.

What are the key market drivers leading to the rise in the adoption of Fast Casual Restaurants Industry?

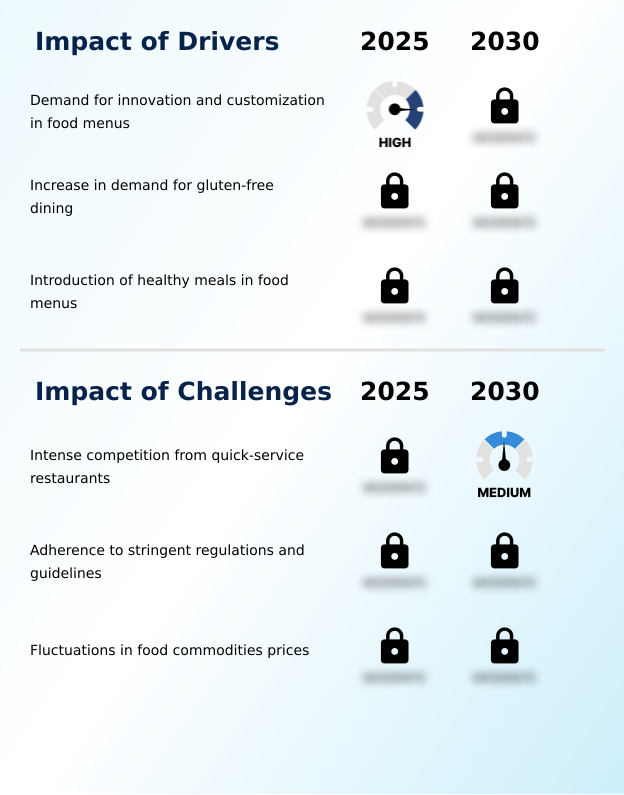
  • The demand for innovation and customization in food menus serves as a key driver for the market's growth.

  • The market is significantly driven by consumer demand for healthier and personalized meals. The availability of build-your-own meal formats and premium ingredient positioning caters to a desire for control over dietary choices.
  • This includes a growing preference for healthy fast casual meals featuring plant-based menu items and dedicated gluten-free dining options.
  • To enhance the fast casual dining experience, brands are adopting food transparency initiatives and providing clear nutritional information transparency, which can boost consumer trust by over 25%. Such customer engagement strategies are reshaping fast casual market dynamics.
  • The success of concepts offering premium chargrilled burgers or customizable sub sandwiches underscores the demand for quality. Digital platforms offering convenient dining solutions have also proven to increase repeat customer visits by up to 15%.

What are the market trends shaping the Fast Casual Restaurants Industry?

  • The increasing popularity of chef-driven fast casual restaurant franchises represents a notable market trend, blending culinary expertise with scalable, convenient dining formats.

  • A notable trend is the rise of chef-driven restaurant concepts, which are enhancing the market through artisanal food preparation and culinary innovation. These establishments, operating under both franchise operational systems and as standalone restaurant concepts, are leveraging fast casual franchising to scale premium dining experiences.
  • The integration of fast casual restaurant technology is pivotal; operators using integrated kitchen display systems (KDS) report up to a 20% improvement in order throughput. Furthermore, a focus on ethnic cuisine integration with offerings like Mediterranean bowls and unique smoothies and wraps is diversifying menus.
  • This is supported by advanced menu engineering and AI-driven personalization, which have been shown to increase average check sizes by over 8%. The expansion of efficient takeaway and delivery models continues to reshape service delivery.

What challenges does the Fast Casual Restaurants Industry face during its growth?

  • Intense competition from quick-service restaurants presents a key challenge that affects the industry’s growth trajectory.

  • Intense competition and operational complexities present key challenges. The line between fast casual and traditional QSRs is blurring, creating a quick service restaurant (QSR) convergence that intensifies price pressure. Maintaining restaurant-style food quality for items like Nashville-style hot chicken or chicken wings and fries while managing fluctuating commodity prices requires robust supply chain optimization.
  • Issues in the fast casual supply chain can increase input costs by as much as 10-15% annually. Adherence to stringent food safety compliance and allergen management protocols is non-negotiable, demanding sophisticated cloud-based restaurant management systems. Firms failing to meet these standards face significant reputational risk.
  • Furthermore, differentiating breakfast, brunch, and lunch dining services or experiential dining concepts becomes more difficult in a crowded market, affecting profitability.

Exclusive Technavio Analysis on Customer Landscape

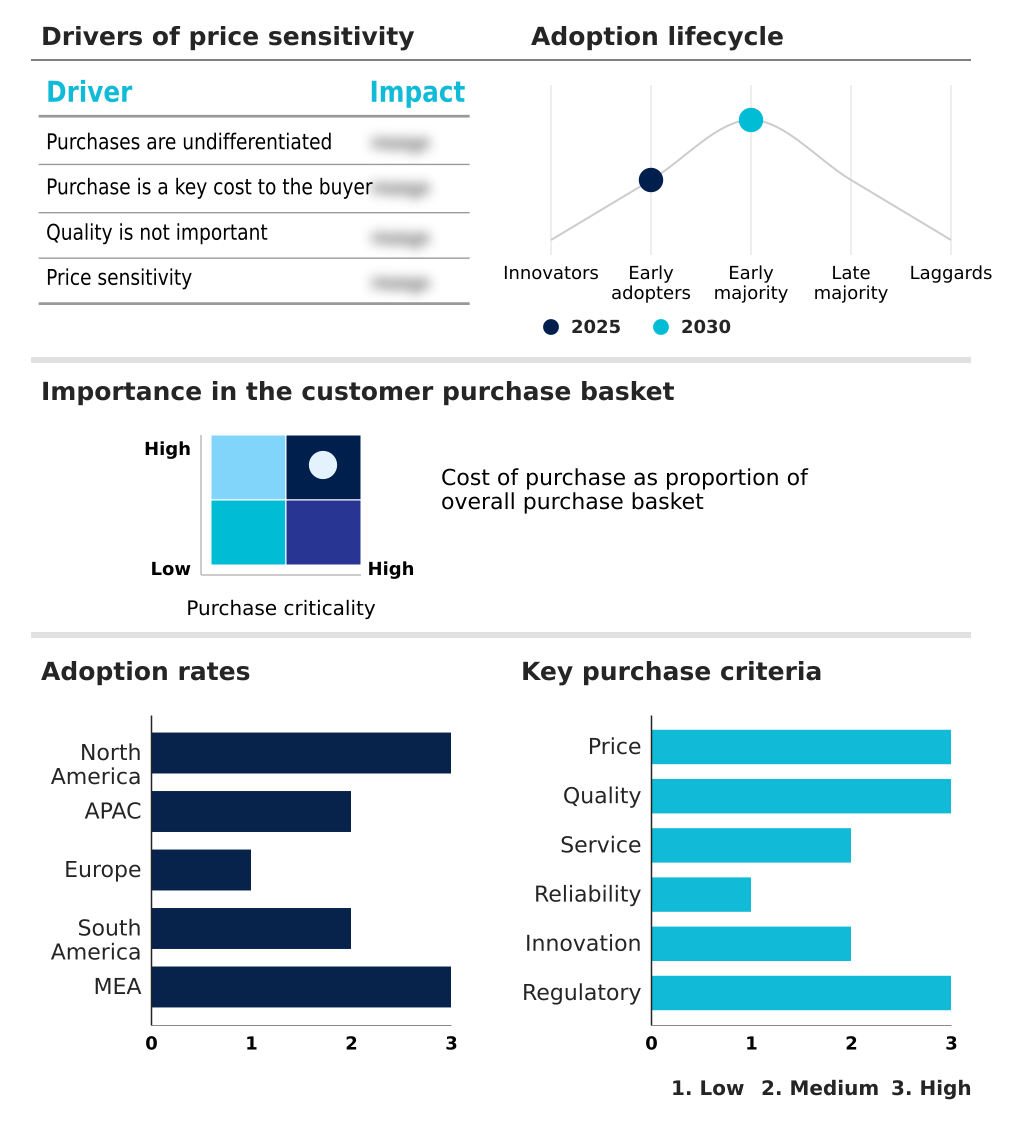
The fast casual restaurants market forecasting report includes the adoption lifecycle of the market, covering from the innovator’s stage to the laggard’s stage. It focuses on adoption rates in different regions based on penetration. Furthermore, the fast casual restaurants market report also includes key purchase criteria and drivers of price sensitivity to help companies evaluate and develop their market growth analysis strategies.

Customer Landscape of Fast Casual Restaurants Industry

Competitive Landscape

Companies are implementing various strategies, such as strategic alliances, fast casual restaurants market forecast, partnerships, mergers and acquisitions, geographical expansion, and product/service launches, to enhance their presence in the industry.

Blaze Pizza LLC - Offerings are centered on made-to-order meals, combining high-quality, fresh ingredients with the speed and convenience of customizable fast casual dining formats.

The industry research and growth report includes detailed analyses of the competitive landscape of the market and information about key companies, including:

  • Blaze Pizza LLC
  • CAVA Group, Inc.
  • Chipotle Mexican Grill Inc.
  • Daves Hot Chicken
  • First Watch Restaurant Group
  • Five Guys Enterprises LLC
  • Jersey Mikes Franchise Systems
  • MOD Super Fast Pizza LLC
  • Noodles and Co.
  • Panda Restaurant Group Inc.
  • Panera Bread
  • Pokeworks LLC
  • Potbelly Corp.
  • Qdoba Restaurant Corp.
  • Raising Canes Restaurants LLC
  • Shake Shack Inc.
  • Sweetgreen Inc.
  • The Habit Restaurants Inc.
  • Tropical Smoothie Cafe LLC
  • Wingstop Inc.

Qualitative and quantitative analysis of companies has been conducted to help clients understand the wider business environment as well as the strengths and weaknesses of key industry players. Data is qualitatively analyzed to categorize companies as pure play, category-focused, industry-focused, and diversified; it is quantitatively analyzed to categorize companies as dominant, leading, strong, tentative, and weak.

Recent Development and News in Fast casual restaurants market

  • In March 2025, Panera Bread announced an expansion of its AI-powered drive-thru ordering systems across several US locations to enhance service speed and order accuracy.
  • In February 2025, MOD Super Fast Pizza LLC revealed its plan to deploy a new digital kitchen management system in select US outlets, aiming to optimize order processing during peak service times.
  • In January 2025, Chipotle Mexican Grill initiated the rollout of an AI-driven kitchen management platform in certain restaurants to streamline order flow and minimize customer wait times.
  • In April 2025, CAVA Group, Inc. launched an AI-powered personalization feature within its mobile app, providing customers with menu recommendations based on their previous order history and stated preferences.

Dive into Technavio’s robust research methodology, blending expert interviews, extensive data synthesis, and validated models for unparalleled Fast Casual Restaurants Market insights. See full methodology.

Market Scope
Page number 288
Base year 2025
Historic period 2020-2024
Forecast period 2026-2030
Growth momentum & CAGR Accelerate at a CAGR of 18%
Market growth 2026-2030 USD 240602.4 million
Market structure Fragmented
YoY growth 2025-2026(%) 15.3%
Key countries US, Canada, Mexico, China, Japan, India, South Korea, Australia, Indonesia, Germany, UK, France, Italy, Spain, The Netherlands, Brazil, Argentina, Chile, Saudi Arabia, UAE, South Africa, Israel and Turkey
Competitive landscape Leading Companies, Market Positioning of Companies, Competitive Strategies, and Industry Risks

Request Free Sample

Research Analyst Overview

  • The Fast Casual Restaurants Market is evolving beyond a simple hybrid of service speeds, now defined by sophisticated operational frameworks and deep technological integration. Successful operators utilize advanced fast casual service models centered on efficient made-to-order meal preparation with highly customizable menu options, including build-your-own meal formats and diverse offerings like Nashville-style hot chicken, Mediterranean bowls, and Hawaiian-inspired poke bowls.
  • The backbone of this efficiency lies in technology, from digital ordering platforms and self-ordering kiosks to comprehensive cloud-based restaurant management systems. These platforms integrate kitchen display systems (KDS) and inventory management systems, with some operators achieving a 30% reduction in food waste through better supply chain optimization.
  • Boardroom decisions are increasingly focused on franchise operational systems versus standalone restaurant concepts and the ROI from AI-driven personalization and loyalty program integration within customer relationship management (CRM) platforms. Strategic differentiation is achieved through premium ingredient positioning, sustainable ingredient sourcing, and transparent nutritional information transparency.
  • Adherence to strict food safety compliance and allergen management protocols, along with the use of eco-friendly packaging solutions, are now critical brand pillars.

What are the Key Data Covered in this Fast Casual Restaurants Market Research and Growth Report?

  • What is the expected growth of the Fast Casual Restaurants Market between 2026 and 2030?

    • USD 240.60 billion, at a CAGR of 18%

  • What segmentation does the market report cover?

    • The report is segmented by Product (North American, Italian, Mexican, and Others), Channel (Dine-in, and Takeaway), Type (Franchised, and Standalone) and Geography (North America, APAC, Europe, South America, Middle East and Africa)

  • Which regions are analyzed in the report?

    • North America, APAC, Europe, South America and Middle East and Africa

  • What are the key growth drivers and market challenges?

    • Demand for innovation and customization in food menus, Intense competition from quick-service restaurants

  • Who are the major players in the Fast Casual Restaurants Market?

    • Blaze Pizza LLC, CAVA Group, Inc., Chipotle Mexican Grill Inc., Daves Hot Chicken, First Watch Restaurant Group, Five Guys Enterprises LLC, Jersey Mikes Franchise Systems, MOD Super Fast Pizza LLC, Noodles and Co., Panda Restaurant Group Inc., Panera Bread, Pokeworks LLC, Potbelly Corp., Qdoba Restaurant Corp., Raising Canes Restaurants LLC, Shake Shack Inc., Sweetgreen Inc., The Habit Restaurants Inc., Tropical Smoothie Cafe LLC and Wingstop Inc.

Market Research Insights

  • The market's dynamism is driven by the integration of fast casual restaurant technology and a focus on experiential dining concepts. The rise of chef-driven restaurant concepts and fast casual franchising has elevated expectations for restaurant-style food quality and artisanal food preparation.
  • Operators that successfully implement technology see tangible results; for example, integrated ordering systems reduce error rates by up to 15% compared to manual methods. Furthermore, expanding takeaway and delivery models can increase a location's customer reach by over 50%.
  • A growing emphasis on ethnic cuisine integration is diversifying menus, creating new avenues for growth and appealing to a broader consumer base seeking novel dining experiences.

We can help! Our analysts can customize this fast casual restaurants market research report to meet your requirements.

Get in touch

1. Executive Summary

1.1 Market overview

Executive Summary - Chart on Market Overview
Executive Summary - Data Table on Market Overview
Executive Summary - Chart on Global Market Characteristics
Executive Summary - Chart on Market by Geography
Executive Summary - Chart on Market Segmentation by Product
Executive Summary - Chart on Market Segmentation by Channel
Executive Summary - Chart on Market Segmentation by Type
Executive Summary - Chart on Incremental Growth
Executive Summary - Data Table on Incremental Growth
Executive Summary - Chart on Company Market Positioning

2. Technavio Analysis

2.1 Analysis of price sensitivity, lifecycle, customer purchase basket, adoption rates, and purchase criteria

2.2 Criticality of inputs and Factors of differentiation

Chart on Overview on criticality of inputs and factors of differentiation

2.3 Factors of disruption

Chart on Overview on factors of disruption

2.4 Impact of drivers and challenges

Chart on Impact of drivers and challenges in 2025 and 2030

3. Market Landscape

3.1 Market ecosystem

Chart on Parent Market
Data Table on - Parent Market

3.2 Market characteristics

Chart on Market characteristics analysis

3.3 Value chain analysis

Chart on Value chain analysis

4. Market Sizing

4.1 Market definition

Data Table on Offerings of companies included in the market definition

4.2 Market segment analysis

Market segments

4.3 Market size 2025

4.4 Market outlook: Forecast for 2025-2030

Chart on Global - Market size and forecast 2025-2030 ($ million)
Data Table on Global - Market size and forecast 2025-2030 ($ million)
Chart on Global Market: Year-over-year growth 2025-2030 (%)
Data Table on Global Market: Year-over-year growth 2025-2030 (%)

5. Historic Market Size

5.1 Global Fast Casual Restaurants Market 2020 - 2024

Historic Market Size - Data Table on Global Fast Casual Restaurants Market 2020 - 2024 ($ million)

5.2 Product segment analysis 2020 - 2024

Historic Market Size - Product Segment 2020 - 2024 ($ million)

5.3 Channel segment analysis 2020 - 2024

Historic Market Size - Channel Segment 2020 - 2024 ($ million)

5.4 Type segment analysis 2020 - 2024

Historic Market Size - Type Segment 2020 - 2024 ($ million)

5.5 Geography segment analysis 2020 - 2024

Historic Market Size - Geography Segment 2020 - 2024 ($ million)

5.6 Country segment analysis 2020 - 2024

Historic Market Size - Country Segment 2020 - 2024 ($ million)

6. Qualitative Analysis

6.1 Impact of AI on Global Fast Casual Restaurants Market

6.2 Impact of Geopolitical Conflicts on Global Fast Casual Restaurants Market

7. Five Forces Analysis

7.1 Five forces summary

Five forces analysis - Comparison between 2025 and 2030

7.2 Bargaining power of buyers

Bargaining power of buyers - Impact of key factors 2025 and 2030

7.3 Bargaining power of suppliers

Bargaining power of suppliers - Impact of key factors in 2025 and 2030

7.4 Threat of new entrants

Threat of new entrants - Impact of key factors in 2025 and 2030

7.5 Threat of substitutes

Threat of substitutes - Impact of key factors in 2025 and 2030

7.6 Threat of rivalry

Threat of rivalry - Impact of key factors in 2025 and 2030

7.7 Market condition

Chart on Market condition - Five forces 2025 and 2030

8. Market Segmentation by Product

8.1 Market segments

Chart on Product - Market share 2025-2030 (%)
Data Table on Product - Market share 2025-2030 (%)

8.2 Comparison by Product

Chart on Comparison by Product
Data Table on Comparison by Product

8.3 North American - Market size and forecast 2025-2030

Chart on North American - Market size and forecast 2025-2030 ($ million)
Data Table on North American - Market size and forecast 2025-2030 ($ million)
Chart on North American - Year-over-year growth 2025-2030 (%)
Data Table on North American - Year-over-year growth 2025-2030 (%)

8.4 Italian - Market size and forecast 2025-2030

Chart on Italian - Market size and forecast 2025-2030 ($ million)
Data Table on Italian - Market size and forecast 2025-2030 ($ million)
Chart on Italian - Year-over-year growth 2025-2030 (%)
Data Table on Italian - Year-over-year growth 2025-2030 (%)

8.5 Mexican - Market size and forecast 2025-2030

Chart on Mexican - Market size and forecast 2025-2030 ($ million)
Data Table on Mexican - Market size and forecast 2025-2030 ($ million)
Chart on Mexican - Year-over-year growth 2025-2030 (%)
Data Table on Mexican - Year-over-year growth 2025-2030 (%)

8.6 Others - Market size and forecast 2025-2030

Chart on Others - Market size and forecast 2025-2030 ($ million)
Data Table on Others - Market size and forecast 2025-2030 ($ million)
Chart on Others - Year-over-year growth 2025-2030 (%)
Data Table on Others - Year-over-year growth 2025-2030 (%)

8.7 Market opportunity by Product

Market opportunity by Product ($ million)
Data Table on Market opportunity by Product ($ million)

9. Market Segmentation by Channel

9.1 Market segments

Chart on Channel - Market share 2025-2030 (%)
Data Table on Channel - Market share 2025-2030 (%)

9.2 Comparison by Channel

Chart on Comparison by Channel
Data Table on Comparison by Channel

9.3 Dine-in - Market size and forecast 2025-2030

Chart on Dine-in - Market size and forecast 2025-2030 ($ million)
Data Table on Dine-in - Market size and forecast 2025-2030 ($ million)
Chart on Dine-in - Year-over-year growth 2025-2030 (%)
Data Table on Dine-in - Year-over-year growth 2025-2030 (%)

9.4 Takeaway - Market size and forecast 2025-2030

Chart on Takeaway - Market size and forecast 2025-2030 ($ million)
Data Table on Takeaway - Market size and forecast 2025-2030 ($ million)
Chart on Takeaway - Year-over-year growth 2025-2030 (%)
Data Table on Takeaway - Year-over-year growth 2025-2030 (%)

9.5 Market opportunity by Channel

Market opportunity by Channel ($ million)
Data Table on Market opportunity by Channel ($ million)

10. Market Segmentation by Type

10.1 Market segments

Chart on Type - Market share 2025-2030 (%)
Data Table on Type - Market share 2025-2030 (%)

10.2 Comparison by Type

Chart on Comparison by Type
Data Table on Comparison by Type

10.3 Franchised - Market size and forecast 2025-2030

Chart on Franchised - Market size and forecast 2025-2030 ($ million)
Data Table on Franchised - Market size and forecast 2025-2030 ($ million)
Chart on Franchised - Year-over-year growth 2025-2030 (%)
Data Table on Franchised - Year-over-year growth 2025-2030 (%)

10.4 Standalone - Market size and forecast 2025-2030

Chart on Standalone - Market size and forecast 2025-2030 ($ million)
Data Table on Standalone - Market size and forecast 2025-2030 ($ million)
Chart on Standalone - Year-over-year growth 2025-2030 (%)
Data Table on Standalone - Year-over-year growth 2025-2030 (%)

10.5 Market opportunity by Type

Market opportunity by Type ($ million)
Data Table on Market opportunity by Type ($ million)

11. Customer Landscape

11.1 Customer landscape overview

Analysis of price sensitivity, lifecycle, customer purchase basket, adoption rates, and purchase criteria

12. Geographic Landscape

12.1 Geographic segmentation

Chart on Market share by geography 2025-2030 (%)
Data Table on Market share by geography 2025-2030 (%)

12.2 Geographic comparison

Chart on Geographic comparison
Data Table on Geographic comparison

12.3 North America - Market size and forecast 2025-2030

Chart on North America - Market size and forecast 2025-2030 ($ million)
Data Table on North America - Market size and forecast 2025-2030 ($ million)
Chart on North America - Year-over-year growth 2025-2030 (%)
Data Table on North America - Year-over-year growth 2025-2030 (%)
Chart on Regional Comparison - North America
Data Table on Regional Comparison - North America

12.3.1 US - Market size and forecast 2025-2030

Chart on US - Market size and forecast 2025-2030 ($ million)
Data Table on US - Market size and forecast 2025-2030 ($ million)
Chart on US - Year-over-year growth 2025-2030 (%)
Data Table on US - Year-over-year growth 2025-2030 (%)

12.3.2 Canada - Market size and forecast 2025-2030

Chart on Canada - Market size and forecast 2025-2030 ($ million)
Data Table on Canada - Market size and forecast 2025-2030 ($ million)
Chart on Canada - Year-over-year growth 2025-2030 (%)
Data Table on Canada - Year-over-year growth 2025-2030 (%)

12.3.3 Mexico - Market size and forecast 2025-2030

Chart on Mexico - Market size and forecast 2025-2030 ($ million)
Data Table on Mexico - Market size and forecast 2025-2030 ($ million)
Chart on Mexico - Year-over-year growth 2025-2030 (%)
Data Table on Mexico - Year-over-year growth 2025-2030 (%)

12.4 APAC - Market size and forecast 2025-2030

Chart on APAC - Market size and forecast 2025-2030 ($ million)
Data Table on APAC - Market size and forecast 2025-2030 ($ million)
Chart on APAC - Year-over-year growth 2025-2030 (%)
Data Table on APAC - Year-over-year growth 2025-2030 (%)
Chart on Regional Comparison - APAC
Data Table on Regional Comparison - APAC

12.4.1 China - Market size and forecast 2025-2030

Chart on China - Market size and forecast 2025-2030 ($ million)
Data Table on China - Market size and forecast 2025-2030 ($ million)
Chart on China - Year-over-year growth 2025-2030 (%)
Data Table on China - Year-over-year growth 2025-2030 (%)

12.4.2 Japan - Market size and forecast 2025-2030

Chart on Japan - Market size and forecast 2025-2030 ($ million)
Data Table on Japan - Market size and forecast 2025-2030 ($ million)
Chart on Japan - Year-over-year growth 2025-2030 (%)
Data Table on Japan - Year-over-year growth 2025-2030 (%)

12.4.3 India - Market size and forecast 2025-2030

Chart on India - Market size and forecast 2025-2030 ($ million)
Data Table on India - Market size and forecast 2025-2030 ($ million)
Chart on India - Year-over-year growth 2025-2030 (%)
Data Table on India - Year-over-year growth 2025-2030 (%)

12.4.4 South Korea - Market size and forecast 2025-2030

Chart on South Korea - Market size and forecast 2025-2030 ($ million)
Data Table on South Korea - Market size and forecast 2025-2030 ($ million)
Chart on South Korea - Year-over-year growth 2025-2030 (%)
Data Table on South Korea - Year-over-year growth 2025-2030 (%)

12.4.5 Australia - Market size and forecast 2025-2030

Chart on Australia - Market size and forecast 2025-2030 ($ million)
Data Table on Australia - Market size and forecast 2025-2030 ($ million)
Chart on Australia - Year-over-year growth 2025-2030 (%)
Data Table on Australia - Year-over-year growth 2025-2030 (%)

12.4.6 Indonesia - Market size and forecast 2025-2030

Chart on Indonesia - Market size and forecast 2025-2030 ($ million)
Data Table on Indonesia - Market size and forecast 2025-2030 ($ million)
Chart on Indonesia - Year-over-year growth 2025-2030 (%)
Data Table on Indonesia - Year-over-year growth 2025-2030 (%)

12.5 Europe - Market size and forecast 2025-2030

Chart on Europe - Market size and forecast 2025-2030 ($ million)
Data Table on Europe - Market size and forecast 2025-2030 ($ million)
Chart on Europe - Year-over-year growth 2025-2030 (%)
Data Table on Europe - Year-over-year growth 2025-2030 (%)
Chart on Regional Comparison - Europe
Data Table on Regional Comparison - Europe

12.5.1 Germany - Market size and forecast 2025-2030

Chart on Germany - Market size and forecast 2025-2030 ($ million)
Data Table on Germany - Market size and forecast 2025-2030 ($ million)
Chart on Germany - Year-over-year growth 2025-2030 (%)
Data Table on Germany - Year-over-year growth 2025-2030 (%)

12.5.2 UK - Market size and forecast 2025-2030

Chart on UK - Market size and forecast 2025-2030 ($ million)
Data Table on UK - Market size and forecast 2025-2030 ($ million)
Chart on UK - Year-over-year growth 2025-2030 (%)
Data Table on UK - Year-over-year growth 2025-2030 (%)

12.5.3 France - Market size and forecast 2025-2030

Chart on France - Market size and forecast 2025-2030 ($ million)
Data Table on France - Market size and forecast 2025-2030 ($ million)
Chart on France - Year-over-year growth 2025-2030 (%)
Data Table on France - Year-over-year growth 2025-2030 (%)

12.5.4 Italy - Market size and forecast 2025-2030

Chart on Italy - Market size and forecast 2025-2030 ($ million)
Data Table on Italy - Market size and forecast 2025-2030 ($ million)
Chart on Italy - Year-over-year growth 2025-2030 (%)
Data Table on Italy - Year-over-year growth 2025-2030 (%)

12.5.5 Spain - Market size and forecast 2025-2030

Chart on Spain - Market size and forecast 2025-2030 ($ million)
Data Table on Spain - Market size and forecast 2025-2030 ($ million)
Chart on Spain - Year-over-year growth 2025-2030 (%)
Data Table on Spain - Year-over-year growth 2025-2030 (%)

12.5.6 The Netherlands - Market size and forecast 2025-2030

Chart on The Netherlands - Market size and forecast 2025-2030 ($ million)
Data Table on The Netherlands - Market size and forecast 2025-2030 ($ million)
Chart on The Netherlands - Year-over-year growth 2025-2030 (%)
Data Table on The Netherlands - Year-over-year growth 2025-2030 (%)

12.6 South America - Market size and forecast 2025-2030

Chart on South America - Market size and forecast 2025-2030 ($ million)
Data Table on South America - Market size and forecast 2025-2030 ($ million)
Chart on South America - Year-over-year growth 2025-2030 (%)
Data Table on South America - Year-over-year growth 2025-2030 (%)
Chart on Regional Comparison - South America
Data Table on Regional Comparison - South America

12.6.1 Brazil - Market size and forecast 2025-2030

Chart on Brazil - Market size and forecast 2025-2030 ($ million)
Data Table on Brazil - Market size and forecast 2025-2030 ($ million)
Chart on Brazil - Year-over-year growth 2025-2030 (%)
Data Table on Brazil - Year-over-year growth 2025-2030 (%)

12.6.2 Argentina - Market size and forecast 2025-2030

Chart on Argentina - Market size and forecast 2025-2030 ($ million)
Data Table on Argentina - Market size and forecast 2025-2030 ($ million)
Chart on Argentina - Year-over-year growth 2025-2030 (%)
Data Table on Argentina - Year-over-year growth 2025-2030 (%)

12.6.3 Chile - Market size and forecast 2025-2030

Chart on Chile - Market size and forecast 2025-2030 ($ million)
Data Table on Chile - Market size and forecast 2025-2030 ($ million)
Chart on Chile - Year-over-year growth 2025-2030 (%)
Data Table on Chile - Year-over-year growth 2025-2030 (%)

12.7 Middle East and Africa - Market size and forecast 2025-2030

Chart on Middle East and Africa - Market size and forecast 2025-2030 ($ million)
Data Table on Middle East and Africa - Market size and forecast 2025-2030 ($ million)
Chart on Middle East and Africa - Year-over-year growth 2025-2030 (%)
Data Table on Middle East and Africa - Year-over-year growth 2025-2030 (%)
Chart on Regional Comparison - Middle East and Africa
Data Table on Regional Comparison - Middle East and Africa

12.7.1 Saudi Arabia - Market size and forecast 2025-2030

Chart on Saudi Arabia - Market size and forecast 2025-2030 ($ million)
Data Table on Saudi Arabia - Market size and forecast 2025-2030 ($ million)
Chart on Saudi Arabia - Year-over-year growth 2025-2030 (%)
Data Table on Saudi Arabia - Year-over-year growth 2025-2030 (%)

12.7.2 UAE - Market size and forecast 2025-2030

Chart on UAE - Market size and forecast 2025-2030 ($ million)
Data Table on UAE - Market size and forecast 2025-2030 ($ million)
Chart on UAE - Year-over-year growth 2025-2030 (%)
Data Table on UAE - Year-over-year growth 2025-2030 (%)

12.7.3 South Africa - Market size and forecast 2025-2030

Chart on South Africa - Market size and forecast 2025-2030 ($ million)
Data Table on South Africa - Market size and forecast 2025-2030 ($ million)
Chart on South Africa - Year-over-year growth 2025-2030 (%)
Data Table on South Africa - Year-over-year growth 2025-2030 (%)

12.7.4 Israel - Market size and forecast 2025-2030

Chart on Israel - Market size and forecast 2025-2030 ($ million)
Data Table on Israel - Market size and forecast 2025-2030 ($ million)
Chart on Israel - Year-over-year growth 2025-2030 (%)
Data Table on Israel - Year-over-year growth 2025-2030 (%)

12.7.5 Turkey - Market size and forecast 2025-2030

Chart on Turkey - Market size and forecast 2025-2030 ($ million)
Data Table on Turkey - Market size and forecast 2025-2030 ($ million)
Chart on Turkey - Year-over-year growth 2025-2030 (%)
Data Table on Turkey - Year-over-year growth 2025-2030 (%)

12.8 Market opportunity by geography

Market opportunity by geography ($ million)
Data Tables on Market opportunity by geography ($ million)

13. Drivers, Challenges, and Opportunity

13.1 Market drivers

Demand for innovation and customization in food menus
Increase in demand for gluten-free dining
Introduction of healthy meals in food menus

13.2 Market challenges

Intense competition from quick-service restaurants
Adherence to stringent regulations and guidelines
Fluctuations in food commodities prices

13.3 Impact of drivers and challenges

Impact of drivers and challenges in 2025 and 2030

13.4 Market opportunities

Rise in popularity of chef-driven fast casual restaurant franchises
Embracing technological advancements is aiding market growth
Increasing focus on digitalization of services

14. Competitive Landscape

14.1 Overview

14.2

Overview on criticality of inputs and factors of differentiation

14.3 Landscape disruption

Overview on factors of disruption

14.4 Industry risks

Impact of key risks on business

15. Competitive Analysis

15.1 Companies profiled

Companies covered

15.2 Company ranking index

15.3 Market positioning of companies

Matrix on companies position and classification

15.4 Blaze Pizza LLC

Blaze Pizza LLC - Overview
Blaze Pizza LLC - Product / Service
Blaze Pizza LLC - Key offerings
SWOT

15.5 CAVA Group, Inc.

CAVA Group, Inc. - Overview
CAVA Group, Inc. - Product / Service
CAVA Group, Inc. - Key offerings
SWOT

15.6 Chipotle Mexican Grill Inc.

Chipotle Mexican Grill Inc. - Overview
Chipotle Mexican Grill Inc. - Product / Service
Chipotle Mexican Grill Inc. - Key offerings
SWOT

15.7 Daves Hot Chicken

Daves Hot Chicken - Overview
Daves Hot Chicken - Product / Service
Daves Hot Chicken - Key offerings
SWOT

15.8 First Watch Restaurant Group

First Watch Restaurant Group - Overview
First Watch Restaurant Group - Product / Service
First Watch Restaurant Group - Key offerings
SWOT

15.9 Five Guys Enterprises LLC

Five Guys Enterprises LLC - Overview
Five Guys Enterprises LLC - Product / Service
Five Guys Enterprises LLC - Key offerings
SWOT

15.10 Jersey Mikes Franchise Systems

Jersey Mikes Franchise Systems - Overview
Jersey Mikes Franchise Systems - Product / Service
Jersey Mikes Franchise Systems - Key offerings
SWOT

15.11 MOD Super Fast Pizza LLC

MOD Super Fast Pizza LLC - Overview
MOD Super Fast Pizza LLC - Product / Service
MOD Super Fast Pizza LLC - Key offerings
SWOT

15.12 Noodles and Co.

Noodles and Co. - Overview
Noodles and Co. - Product / Service
Noodles and Co. - Key offerings
SWOT

15.13 Panda Restaurant Group Inc.

Panda Restaurant Group Inc. - Overview
Panda Restaurant Group Inc. - Product / Service
Panda Restaurant Group Inc. - Key offerings
SWOT

15.14 Panera Bread

Panera Bread - Overview
Panera Bread - Product / Service
Panera Bread - Key offerings
SWOT

15.15 Pokeworks LLC

Pokeworks LLC - Overview
Pokeworks LLC - Product / Service
Pokeworks LLC - Key offerings
SWOT

15.16 Potbelly Corp.

Potbelly Corp. - Overview
Potbelly Corp. - Product / Service
Potbelly Corp. - Key offerings
SWOT

15.17 Shake Shack Inc.

Shake Shack Inc. - Overview
Shake Shack Inc. - Product / Service
Shake Shack Inc. - Key offerings
SWOT

15.18 Wingstop Inc.

Wingstop Inc. - Overview
Wingstop Inc. - Product / Service
Wingstop Inc. - Key offerings
SWOT

16. Appendix

16.1 Scope of the report

Market definition
Objectives
Notes and caveats

16.2 Inclusions and exclusions checklist

Inclusions checklist
Exclusions checklist

16.3 Currency conversion rates for US$

16.4 Research methodology

16.5 Data procurement

Information sources

16.6 Data validation

16.7 Validation techniques employed for market sizing

16.8 Data synthesis

16.9 360 degree market analysis

16.10 List of abbreviations

Research Methodology

Technavio presents a detailed picture of the market by way of study, synthesis, and summation of data from multiple sources. The analysts have presented the various facets of the market with a particular focus on identifying the key industry influencers. The data thus presented is comprehensive, reliable, and the result of extensive research, both primary and secondary.

INFORMATION SOURCES

Primary sources

  • Manufacturers and suppliers
  • Channel partners
  • Industry experts
  • Strategic decision makers

Secondary sources

  • Industry journals and periodicals
  • Government data
  • Financial reports of key industry players
  • Historical data
  • Press releases

DATA ANALYSIS

Data Synthesis

  • Collation of data
  • Estimation of key figures
  • Analysis of derived insights

Data Validation

  • Triangulation with data models
  • Reference against proprietary databases
  • Corroboration with industry experts

REPORT WRITING

Qualitative

  • Market drivers
  • Market challenges
  • Market trends
  • Five forces analysis

Quantitative

  • Market size and forecast
  • Market segmentation
  • Geographical insights
  • Competitive landscape

Interested in this report?

Get your sample now to see our research methodology and insights!

Download Now

Frequently Asked Questions

Fast Casual Restaurants market growth will increase by USD 240602.4 million during 2026-2030.

The Fast Casual Restaurants market is expected to grow at a CAGR of 18% during 2026-2030.

Fast Casual Restaurants market is segmented by Product (North American, Italian, Mexican, Others) Channel (Dine-in, Takeaway) Type (Franchised, Standalone)

Blaze Pizza LLC, CAVA Group, Inc., Chipotle Mexican Grill Inc., Daves Hot Chicken, First Watch Restaurant Group, Five Guys Enterprises LLC, Jersey Mikes Franchise Systems, MOD Super Fast Pizza LLC, Noodles and Co., Panda Restaurant Group Inc., Panera Bread, Pokeworks LLC, Potbelly Corp., Qdoba Restaurant Corp., Raising Canes Restaurants LLC, Shake Shack Inc., Sweetgreen Inc., The Habit Restaurants Inc., Tropical Smoothie Cafe LLC, Wingstop Inc. are a few of the key vendors in the Fast Casual Restaurants market.

North America will register the highest growth rate of 45.9% among the other regions. Therefore, the Fast Casual Restaurants market in North America is expected to garner significant business opportunities for the vendors during the forecast period.

US, Canada, Mexico, China, Japan, India, South Korea, Australia, Indonesia, Germany, UK, France, Italy, Spain, The Netherlands, Brazil, Argentina, Chile, Saudi Arabia, UAE, South Africa, Israel, Turkey

  • Demand for innovation and customization in food menus is the driving factor this market.

The Fast Casual Restaurants market vendors should focus on grabbing business opportunities from the Product segment as it accounted for the largest market share in the base year.
RIA - Research AI Assistant
Ask RIA